219 Windmill Dr · Rhome, TX
Flood risk 1/10 · Minimal
- FEMA flood zone
- X (unshaded)
- Chance of flooding over 30 yrs
- 0.0%
- Est. flood insurance / yr
- $507 – $1,088
Fire risk 7/10 · Major
- Est. fire insurance / yr
- $1,222 – $2,270
Heat risk 7/10 · Major
- Hot days now (above 109°F)
- 7 days/yr
- Hot days in 30 yrs
- 20 days/yr
Wind risk 6/10 · Moderate
- Chance of severe wind over 30 yrs
- 27.0%
Air-quality risk 2/10 · Minimal
- Unhealthy air days now
- 1 days/yr
- Unhealthy air days in 30 yrs
- 2 days/yr
Risk factors via First Street. Map © Google.
Why this score? — see what drove the D- grade
The composite is a weighted blend of 9 inputs, each scored 0–100. Each bar is that input's sub-score; the figure is the points it added to the 100-point composite (weight × sub-score).
- Appreciation +10.0/10.0
- Cash flow +6.6/30.0
- ARV discount +5.5/15.0
- Schools +4.6/10.0
- Livability +3.7/5.0
- Rent growth +2.5/5.0
- Condition / age +2.5/5.0
- 1% rule +2.0/10.0
- DSCR +0.8/10.0
$334,990
🖨 Deal sheet (PDF) 📄 Offer letter ✓ Due diligence
Listing remarks
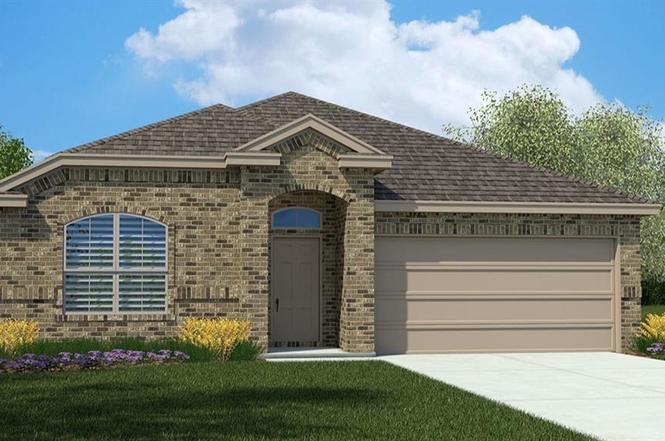
D. R. HORTON AMERICA'S BUILDER is EXCITED TO SERVE AS YOUR HOME BUILDER in the FABULOUS COMMUNITY of BLUESTEM in RHOME and NORTHWEST ISD! Beautiful single story 4 BEDROOM Carlsbad open Floorplan-Elevation B, with an estimated Spring completion. Large Chef's Kitchen with Quartz Countertops, Stainless Steel Appliances, Gas Range, Island, Pendant Lights and walk-in Pantry. Luxurious main Bedroom with dual sink Quartz top Vanity, over sized Shower, linen Closet and W-I Closet. Partial Gutters, front Coach Lights and Tankless Water Heater. Designer Pkg including Tiled Entry, Halls and Wet areas plus Home is Connected Smart Home Technology. Covered back Patio, 6 ft fenced backyard, Landscape Pkg
Key facts
- Quartz countertops
- Chef's kitchen
- Gas range
Tags
Property features AI
Finance
- Other: Community features include community pool, park, playground, jogging/bike path, fishing and sidewalks; Easements for utilities; Minerals retained by developer (exclusion)
- Financial info: Listing accepts Cash, Conventional, FHA and VA financing; No second mortgage reported
- HOA & community: Mandatory HOA with annual fee; HOA fees cover full use of facilities and management fees; HOA managed by CCMC
Exterior
- Parking: Attached 2-car garage with single 2-car door; Garage door opener; 2 covered parking spaces; Garage faces front
- Security: Smoke detectors; Carbon monoxide detectors; Smart home features
- Utilities: City water; City sewer; Individual water meter; Individual gas meter; Electricity connected / available; Natural gas available; Cable available; Phone available; Sewer available; Underground utilities; Sidewalks and curbs; Concrete
- Home design: Single-family residence; One-story; New construction (incomplete, 2025)
- Construction: Brick and frame construction; Composition roof; Slab foundation; Year built 2025 (new construction - incomplete)
- Exterior features: Covered rear porch; Covered porch(es); Private yard; Gutters; Sprinkler system; Landscaped yard; Few trees; Subdivision setting
Interior
- Kitchen: Gas range; Microwave; Dishwasher; Garbage disposal; Water line to refrigerator; Solid surface (non-natural) counters; Built-in cabinets
- Bedrooms: 4 bedrooms (all on the main level); Primary bedroom with dual sinks, separate shower, linen closet and walk-in closet; Remaining bedrooms arranged as split-bedroom layout
- Flooring: Carpet; Ceramic tile
- Bathrooms: 2 full bathrooms
- Heating & cooling: Central heating (natural gas); Central air conditioning (electric)
- Interior features: Open floor plan; Decorative lighting; Eat-in kitchen; Kitchen island; Pantry / walk-in pantry; Cable TV available; High-speed internet available; Smart home system; Vented exhaust fan; Plumbed for gas in kitchen
- Laundry & utility: Separate utility room; Full-size washer/dryer area; Washer hookup; Electric dryer hookup; Tankless water heater; Gas water heater
Neighborhood map
What this means for you Summary
Snapshot
- This is a 4-bed/2.0-bath single-family listed at $335k.
Deal economics
- At list price, monthly cash flow is $-555 ($-7k/yr) — negative.
- To cash-flow at today's rent, offer at most $255k (24.0% below list).
- To meet the 1% rule (rent ≥ 1% of price), the offer needs to be $233k (30.5% below list).
- Recommended offer: $233k (30.5% below list) — sets the bar for 1% rule.
Location & tenants
- Location reads 74/100 on livability (#165 in TX, #4,376 nationally) — a middle-class / working-renter tenant base. Strengths: cost of living A+, housing A+, crime A-; Watch: amenities F, commute F.
- Northwest ISD (rural): math 48% / reading 52% proficiency, ranked #120 of 826 in TX (top 14%) — acceptable for families but not a draw, mixed tenant base, ~2y average lease.
- Zoned schools: Seven Hills El (math 28% / reading 33%, grade F, #2,464 of 4,322 statewide, top 58%, 667 students, 48% FRL); Chisholm Trail Middle (math 39% / reading 35%, grade F, #756 of 1,662 statewide, top 47%, 684 students, 51% FRL); Northwest H S (math 55% / reading 64%, grade C+, #275 of 1,632 statewide, top 19%, 2,264 students, 0% FRL).
- Market conditions: 264 active listings in the ZIP; 4 comparable units currently listed for rent nearby; rentals at typical pace (median 24d on market — plan ~3-4 weeks tenant-placement turnaround); solid renter incomes; 460 units permitted in Wise County in 2024 (243 in 5+ unit buildings).
Forward outlook
- In year one you build about $36k of equity ($2k loan paydown + $33k appreciation (10.0% local appreciation)).
- Wise County population projected at +27% by 2050 — long-run rental-demand tailwind backs the buy-and-hold thesis.
- By year 2, paydown + projected appreciation supports a ~$58k cash-out refi (75% LTV) — recoverable capital for the next deal without selling this one.
Negotiation context
- It's been on market 57 days — a 3% lower offer ($325k) is reasonable based on typical stale-listing flexibility.
Risks & watch-outs
- Climate carrying-cost: major wind risk, 27% chance of damaging wind over 30y; major wildfire risk; extreme-heat days projected 7→20/yr by 2055 (HVAC capex compounding) — expect insurance premiums to compound above CPI over the hold.
Questions for the listing agent
- What do current leases actually rent for vs. the listed asking? Can we see a recent rent roll and the last 12 months of T-12 income?
- It's been on market 57 days. Have you received any prior offers? Is the seller open to a 30% concession, seller financing, or rate buy-down credit?
- What does the HOA fee cover, when was the last increase, and are there any pending special assessments or reserve-fund shortfalls?
- Is there a deadline driving the sale (1031 exchange, divorce, estate, relocation)? That informs how much negotiation room exists.
- Schools are D-rated, which usually means shorter tenancies and higher turnover. Who's the typical renter profile here, and what's been the actual vacancy rate?
- The area grade is low — what's the realistic commute time and amenity access for the typical tenant pool here? Any planned neighborhood developments (good or bad) we should know about?
- What's the average days-on-market for RENTAL listings here right now (not sales)? A rising rental-DOM trend means longer vacancies and softer asking-rent achievability than the comps imply.
- What's the recent tenant-quality profile in this submarket — average credit score on applications, eviction rate, late-payment / NSF rate, and stable-employment percentage? A property-management company in the area should have these aggregated.
- How much new for-sale + rental construction is in the pipeline within 1–3 miles? Heavy new supply typically softens prices + rents 12–24 months out; constrained supply supports both.
Investment metrics
- 1% rule
- 0.70% ✗
- Cap rate
- 4.30%
- Cash-on-cash
- -7.10%
- DSCR
- 0.68
- GRM
- 12.0
CMA / ARV
- ARV (on-the-fly)
- $320,766
- Comps found
- 12
Show comp detail 12 sales within ~0.75 mi
| Address | Dist | Beds/Ba | Sqft | Sold | Price | $/sf | Match |
|---|---|---|---|---|---|---|---|
| 139 Stanton Ave | 0.20mi | 4/2.0 | 1,662 (0%) | 4mo | $314,990 | $190 | 87 |
| 110 Castell Ave | 0.22mi | 4/2.0 | 1,662 (0%) | 6mo | $320,156 | $193 | 84 |
| 110 Stanton Ave | 0.13mi | 4/2.0 | 1,837 (+10%) | 0mo | $344,990 | $188 | 76 |
| 122 Castell Ct | 0.18mi | 4/2.0 | 1,837 (+10%) | 4mo | $333,990 | $182 | 70 |
| 179 Summer Rain Way | 0.50mi | 3/2.0 (-1) | 1,674 (+1%) | 1mo | $360,000 | $215 | 70 |
| 155 Texasage St | 0.60mi | 4/2.0 | 1,659 (-0%) | 3mo | $299,900 | $181 | 69 |
| 129 Medina Ln | 0.23mi | 4/2.0 | 1,837 (+10%) | 3mo | $334,990 | $182 | 69 |
| 141 Medina Ln | 0.22mi | 4/2.0 | 1,837 (+10%) | 7mo | $337,938 | $184 | 66 |
| 196 Pintail | 0.39mi | 3/2.0 (-1) | 1,581 (-5%) | 9mo | $348,000 | $220 | 61 |
| 192 Pintail Ln | 0.40mi | 3/2.0 (-1) | 1,511 (-9%) | 5mo | $329,000 | $218 | 57 |
| 127 Palo Duro | 0.57mi | 3/2.0 (-1) | 1,598 (-4%) | 6mo | $339,000 | $212 | 57 |
| 158 Pecan Ln | 0.45mi | 3/2.5 (-1) | 1,802 (+8%) | 9mo | $409,990 | $228 | 51 |
Match score weights: distance 35% · size 25% · config 20% · recency 20%. Top-matched comps best support the ARV.
Projected returns pro-forma
10.0% appreciation · 3.0% rent growth · sell at horizon
- IRR
- 19.3%
- Equity multiple
- 2.57×
- Total profit
- $147,181
- Equity at exit
- $301,786
- IRR
- 17.8%
- Equity multiple
- 5.92×
- Total profit
- $461,388
- Equity at exit
- $650,812
Cash invested: $93,797 (down + closing). Projections, not guarantees.
Landlord ↔ Tenant lean methodology
- Overall (STATE)
- 87 Strongly Landlord-Friendly
- State Texas
- 87 Strongly Landlord-Friendly · R+5
- County
- — inherits STATE
- City
- — inherits STATE
ZIP-level market 76078
- Home prices YoY
- 6.5%
- Active inventory
- 264
- Price-to-rent
- 12.0×
Monthly cashflow live
- Estimated rent
- $2,329 medium interval (Pro) →
- Mortgage (P&I)
- −$1,757
- Tax est. 1.5%
- −$419 /mo · $5,025/yr
- Insurance
- −$140
- HOA
- −$80
- Vacancy / Maint / Mgmt
- −$489
- Net cashflow
- $-555
Break-even live
Sensitivity live
| Price | -10% $-323 | -5% $-439 | +0% $-555 | +5% $-671 | +10% $-787 |
|---|---|---|---|---|---|
| Rent | -10% $-739 | -5% $-647 | +0% $-555 | +5% $-463 | +10% $-371 |
| Rate | -1.0pp $-386 | -0.5pp $-470 | base $-555 | +0.5pp $-642 | +1.0pp $-730 |
UW: 25.0% down · 7.5% · 30yr · 1.5% tax · 5.0% vac · 8.0% maint · 8.0% mgmt
Financing live
Cash to close
- Down payment
- $83,748
- Closing costs
- $10,050
- Reserves months
- —
- Total cash needed
- —
Loan-product check · same deal, 3 products live
Conventional
25% down · 7.5% · 30yr
- Down + closing
- —
- Monthly P&I
- —
- Monthly cashflow
- —
- DSCR
- —
- Eligible?
- —
Personal DTI + credit; lowest rate.
DSCR
20% down · 8.5% · 30yr
- Down + closing
- —
- Monthly P&I
- —
- Monthly cashflow
- —
- DSCR
- —
- Eligible?
- —
No personal income docs; deal must DSCR.
Hard money
10% down · 12.0% · 12mo
- Down + closing
- —
- Monthly P&I
- —
- Monthly cashflow
- —
- DSCR
- —
- Eligible?
- —
Short-term bridge; refi at stabilization.
Rent comps 4 comps
| Address | Beds | Baths | Sqft | Rent | $/sqft | DOM | Units | Dist |
|---|---|---|---|---|---|---|---|---|
| 135 Lunayena Rd Rhome, TX | 4.0 | 2.0 | 2039 | $2,200 | $1.08 | 0d | 1 | 0.25mi |
| 135 Lunayena Rd Rhome, TX | 4.0 | 2.0 | 2039 | $2,200 | $1.08 | 23d | 1 | 0.25mi |
| 201 S Main St Rhome, TX | 3.0 | 1.0 | 1071 | $1,295 | $1.21 | 45d | 1 | 0.96mi |
| 197 Private Road 4652 Unit 4652 Rhome, TX | 3.0 | 2.0 | 1428 | $2,295 | $1.61 | 0d | 1 | 1.08mi |
HOA detail
- Monthly dues
- $80 · $960/yr
- Likely covers
- watergas
Listing history 4 events
-
2026-04-17status Pending
-
2026-04-09price $334,990
-
2026-03-17price $339,990
-
2026-02-19$344,680 Active
ⓘ Source: listings_history table (triggers on properties + properties_extension) + one-shot
backfill from property_details.listing_events for pre-trigger history.
Climate risk First Street
- Flood 1/10 Low FEMA zone X (unshaded) · 0% chance over 30 yrs
- Wildfire 7/10 Severe
- Heat 7/10 Severe 7 d/yr ≥109°F today · 20 d/yr by 30 yrs out
- Wind 6/10 Major 27% chance of damaging wind over 30 yrs
- Air quality 2/10 Low 1 unhealthy d/yr today · 2 by 30 yrs out
Nearby sold comps map
Loading sold comps map…
Walkable amenities ~0.75 mi
Loading nearby amenities…
Taxation est. · year 1
- Rental income
- $27,950
- − Mortgage interest
- −$18,765
- − Property taxes
- −$5,025
- − Insurance
- −$1,675
- − Repairs & maintenance
- −$2,236
- − Management
- −$2,236
- − HOA
- −$960
- − Depreciation
- −$9,745
- Taxable loss
- −$12,692
- Est. tax savings @ 24.0%
- +$3,046
- After-tax cash flow
- $-3,614/yr
For passive investors: Depreciation is non-cash, so a rental often shows a tax loss while cash-flowing — sheltering income. Rental losses are passive: they offset passive income freely, and up to $25,000/yr can offset ordinary (W-2) income if you actively participate and your MAGI is under $100k (phasing out to $0 by $150k); unused losses carry forward. On sale, claimed depreciation is recaptured at up to 25%, and gains may owe capital-gains tax (a 1031 exchange can defer both). Figures are a year-1 estimate at your 24.0% rate — not tax advice; consult a CPA.
Schools (NCES district)
- District
- Northwest ISD
- NCES district ID
- 4833180
- Math proficiency
- 48% ▼ -15.00%
- Reading proficiency
- 52% ▼ -8.00%
- Median HH income
- $85,315
- Composite
- 46.15/100
- National rank
- #2504
- State rank
- #120 of 826 in TX
Livability — Rhome
- Score
- 74/100
- State rank
- #165
- US rank
- #4376
Category grades
Schools grade is shown separately in the Schools card above.
Census & demographics
- County
- Wise County · 49,037 people
- Metro
- Dallas-Fort Worth-Arlington, TX
- Population (ZIP)
- 10,828
- Household income
- $99,866
- Rent vs Own
- Severe rent burden
- 10.0
Population outlook (Wise County) Hauer SSP2
- Today (2025)
- 71,620 people
- By 2030
- 75,858 · +5.9%
- By 2040
- 83,908 · +17.2%
- By 2050
- 90,717 · +26.7%
- By 2075
- 107,583 · +50.2%
- By 2100
- 114,996 · +60.6%
Race, ethnicity, and origin ACS 2023
- Neighborhood character
- Predominantly White (69%)
- Race & ethnicity
- White 69% Hispanic / Latino 24% Two or more races 11% Native American 4% Black 2%
- Hispanic origin (detail)
- Mexican 20% Puerto Rican 3%
- Common ancestry
- Slovak 2% Lithuanian 2% Italian 1%
- Foreign-born
- 6% · Canada
- Languages at home
- 85% English-only · Spanish 14% German/W. Germanic 1%
Political lean MEDSL · Wise
- 2024 margin
- Solid R (+70.0) · D 14.7% · R 84.7%
- 2008→2024 swing
- -14.3pp toward R · 2008: -55.7pp · 2024: -70.0pp
- All cycles
- 2024: R+70.0 2020: R+68.2 2016: R+69.9 2012: R+67.5 2008: R+55.7
Not yet ingested
- Civics
- —
Market trends
- HPI YoY
- ▲ 19.94%
- Current HPI
- 325.22
- Rent YoY
- —
- Metro
- Dallas-Fort Worth-Arlington, TX
- State GDP YoY
- ▲ 3.95%
- F500 in state
- 110
Industry mix (Fortune 500 HQ in TX)
| Industry | F500 HQs | Revenue |
|---|---|---|
| Energy | 16 | $1,198B |
|
||
| Technology | 5 | $198B |
|
||
| Engineering / Construction | 4 | $72B |
|
||
| Energy Services | 3 | $60B |
|
||
| Utilities | 3 | $41B |
|
||
| Healthcare | 2 | $330B |
|
||
Price history
-2.8% since first listed4 events — show timeline
- 2026-04-17 Pending — NTREIS
- 2026-04-09 Price Changed $334,990 NTREIS
- 2026-03-17 Price Changed $339,990 NTREIS
- 2026-02-19 Listed $344,680 NTREIS
Cash-flow waterfall
monthlySold comps — $/sqft
last 12 mo · ≤1 miLoading sold comps…