3015 Cedar Crescent Dr · Mobile, AL
Flood risk No data
- FEMA flood zone
- —
- Chance of flooding over 30 yrs
- —
- Est. flood insurance / yr
- —
Fire risk No data
- Est. fire insurance / yr
- —
Heat risk No data
- Hot days now (above threshold)
- —
- Hot days in 30 yrs
- —
Wind risk No data
- Chance of severe wind over 30 yrs
- —
Air-quality risk No data
- Unhealthy air days now
- —
- Unhealthy air days in 30 yrs
- —
Risk factors via First Street. Map © Google.
Why this score? — see what drove the B- grade
The composite is a weighted blend of 9 inputs, each scored 0–100. Each bar is that input's sub-score; the figure is the points it added to the 100-point composite (weight × sub-score).
- Cash flow +30.0/30.0
- DSCR +10.0/10.0
- 1% rule +8.3/10.0
- ARV discount +7.1/15.0
- Rent growth +4.6/5.0
- Livability +3.8/5.0
- Condition / age +2.5/5.0
- Schools +2.3/10.0
- Appreciation +0.0/10.0
$123,000
🖨 Deal sheet 📄 Offer letter ✓ Due diligence
Listing remarks MLS
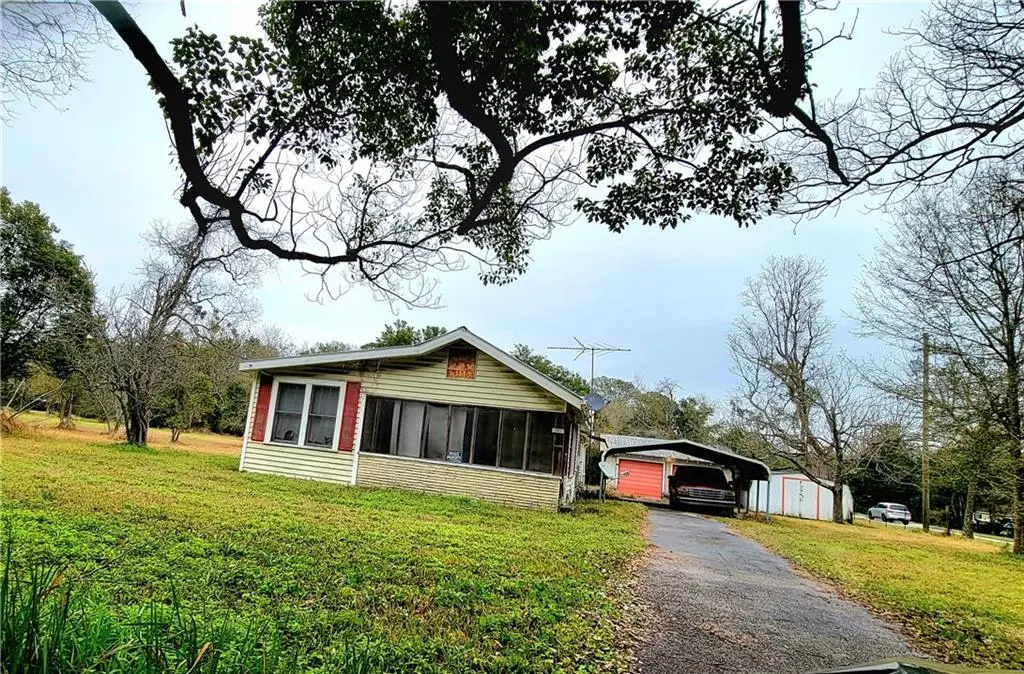
Welcome to this spacious 1,450+ sq. ft. corner-lot home situated on approximately 1.6 acres, offering room to spread out and endless potential. Featuring a durable metal roof, this property is a great opportunity for buyers looking to add their personal touch. Enter through the screened, covered patio into a welcoming living room. An adjacent den flows seamlessly into the kitchen, creating an open and functional layout ideal for everyday living and entertaining. The kitchen offers abundant cabinet space, perfect for storage of cookware and small appliances. Two bedrooms and a full guest bath are conveniently located off the living room, while the primary suite is privately tucked away with access from the den. The primary bedroom includes two large closets and a second full bathroom. Outside, the expansive property includes a two-car garage plus a double carport, providing ample parking and storage. The home is all electric; natural gas was previously connected but has not been used in recent years. This home is being sold AS IS, with no repairs to be made by the seller. Buyer and buyer’s agent to verify all measurements. The property will require some TLC to reach its full potential. Please use caution near the pool table in the den, as there is a known weak area in the flooring. Contact your favorite agent today to see this one! Listing agent is related to the seller through marriage. Listed by Crimson Jackson IXL Real Estate 251-802-4263
Key facts
- Corner-lot home
- Metal roof
- Two large closets
Tags
Neighborhood map
What this means for you Summary
Snapshot
- This is a 3-bed/1.0-bath single-family listed at $123k.
Deal economics
- At list price, monthly cash flow is $537 ($6k/yr) — positive.
- The deal already cash-flows at list — no discount required.
- Meets the 1% rule at list price ($2k rent vs $123k).
- Recommended offer: $108k (12.0% below list) — sets the bar for market timing.
- Cap rate 11.5% vs local median 4.9% in Mobile — top-decile yield for the area; either an underpriced asset or a hidden risk that comps aren't pricing in. Stress-test before assuming the spread holds.
Location & tenants
- Location reads 75/100 on livability (#20 in AL, #4,262 nationally) — a middle-class / working-renter tenant base. Strengths: commute A+, cost of living A+, housing A+; Watch: schools D-, crime F, employment D-.
- Mobile County (urban): math 15% / reading 39% proficiency, ranked #81 of 129 in AL (top 63%) — low school quality limits family demand, transient renter base, plan for 1-2y turnover; 67% free/reduced lunch — lower-income household profile, screen leases tightly.
- Market conditions: Rents rising fast (+8.3%/yr); 139 active listings in the ZIP; 7 comparable units currently listed for rent nearby; rentals at typical pace (median 21d on market — plan ~3-4 weeks tenant-placement turnaround); lower-income renter base — watch delinquency; 1,678 units permitted in Mobile County in 2024 (264 in 5+ unit buildings).
- At $1,641/mo this rent would consume 45% of the median local household income ($44k/yr) (locally 1521% of renters already pay >50% of income on rent) — very limited rent-growth headroom before tenants either downsize or default.
Forward outlook
- Local home prices are declining (-3.0%/yr); year-one equity from $850 of loan paydown is wiped out by about $4k of value loss. Plan a longer hold.
- Mobile County population projected to shrink 8% by 2050 — rents likely to lag national; underwrite the cash flow, not the appreciation.
- At projected returns (-3.0% appreciation + 8.0% rent growth), your $34k cash investment doubles in ~6 years — after that, you're playing with house money.
Negotiation context
- It's been on market 145 days — a 12% lower offer ($108k) is reasonable based on typical stale-listing flexibility.
Risks & watch-outs
- Watch-outs: built in 1910 — expect roof / HVAC / electrical / plumbing capex.
Questions for the listing agent
- It's been on market 145 days. Have you received any prior offers? Is the seller open to a 12% concession, seller financing, or rate buy-down credit?
- Built in 1910 — when were the roof, HVAC, electrical panel, plumbing, and water heater last replaced?
- Why hasn't it sold? Are there any deal-killer items the seller is aware of (foundation, flood, title, zoning, code violations)?
- Is there a deadline driving the sale (1031 exchange, divorce, estate, relocation)? That informs how much negotiation room exists.
- Schools are D-rated, which usually means shorter tenancies and higher turnover. Who's the typical renter profile here, and what's been the actual vacancy rate?
- Crime grade is F in this area — have there been break-ins, vandalism, or insurance claims at this property in the last 3 years? What carrier currently insures it and at what premium?
- What's the average days-on-market for RENTAL listings here right now (not sales)? A rising rental-DOM trend means longer vacancies and softer asking-rent achievability than the comps imply.
- What's the recent tenant-quality profile in this submarket — average credit score on applications, eviction rate, late-payment / NSF rate, and stable-employment percentage? A property-management company in the area should have these aggregated.
- How much new for-sale + rental construction is in the pipeline within 1–3 miles? Heavy new supply typically softens prices + rents 12–24 months out; constrained supply supports both.
Investment metrics
- 1% rule
- 1.33% ✓
- Cap rate
- 11.53%
- Cash-on-cash
- 18.70%
- DSCR
- 1.83
- GRM
- 6.2
CMA / ARV
- ARV (median comp)
- $122,027
- List price
- $123,000
- Delta
- 0.80%
- Verdict
- FAIR
- Comps
- 20 within 1.0 mi
Show comp detail 12 sales within ~0.75 mi
| Address | Dist | Beds/Ba | Sqft | Sold | Price | $/sf | Match |
|---|---|---|---|---|---|---|---|
| 1853 Brill Cir | 0.59mi | 3/1.5 | 1,492 (+0%) | 10mo | $130,000 | $87 | 62 |
| 1306 North Dr | 0.17mi | 3/2.0 | 1,602 (+8%) | 18mo | $164,000 | $102 | 60 |
| 3067 Bay Crescent Dr | 0.57mi | 3/2.0 | 1,592 (+7%) | 3mo | $130,000 | $82 | 55 |
| 3016 Curry Dr W | 0.41mi | 4/1.0 (+1) | 1,353 (-9%) | 10mo | $112,000 | $83 | 53 |
| 1658 Gulfdale Dr | 0.46mi | 3/2.0 | 1,375 (-7%) | 14mo | $166,224 | $121 | 50 |
| 2907 Gulfdale Ct | 0.54mi | 4/2.0 (+1) | 1,400 (-6%) | 10mo | $180,750 | $129 | 48 |
| 1808 Gulfdale Dr | 0.63mi | 4/2.0 (+1) | 1,537 (+4%) | 12mo | $215,000 | $140 | 46 |
| 1601 Cedar Downs Dr | 0.66mi | 4/2.0 (+1) | 1,512 (+2%) | 18mo | $185,000 | $122 | 42 |
| 3470 Bay Front Rd | 0.73mi | 3/1.0 | 1,642 (+11%) | 8mo | $190,000 | $116 | 42 |
| 1512 Lartigue Ave N | 0.55mi | 4/2.0 (+1) | 1,550 (+4%) | 21mo | $162,000 | $105 | 41 |
| 1719 Gulfdale Dr | 0.49mi | 3/2.0 | 1,269 (-14%) | 15mo | $148,000 | $117 | 36 |
| 3021 Pickell Dr | 0.68mi | 4/1.0 (+1) | 1,269 (-14%) | 19mo | $150,000 | $118 | 24 |
Match score weights: distance 35% · size 25% · config 20% · recency 20%. Top-matched comps best support the ARV.
Projected returns pro-forma
-3.0% appreciation · 8.0% rent growth · sell at horizon
- IRR
- 15.7%
- Equity multiple
- 1.66×
- Total profit
- $22,900
- Equity at exit
- $18,340
- IRR
- 27.6%
- Equity multiple
- 4.00×
- Total profit
- $103,311
- Equity at exit
- $10,635
Cash invested: $34,440 (down + closing). Projections, not guarantees.
Landlord ↔ Tenant lean methodology
- Overall (STATE)
- 90 Strongly Landlord-Friendly
- State Alabama
- 90 Strongly Landlord-Friendly · R+15
- County
- — inherits STATE
- City
- — inherits STATE
ZIP-level market 36605
- Rents YoY
- 8.3%
- Active inventory
- 139
- Price-to-rent
- 6.2×
Monthly cashflow live
- Estimated rent
- $1,641 high interval (Pro) →
- Mortgage (P&I)
- −$645
- Tax from tax record
- −$63 /mo · $758/yr
- Insurance
- −$51
- HOA
- −$0
- Vacancy / Maint / Mgmt
- −$345
- Net cashflow
- $537
Break-even live
UW: 25.0% down · 7.5% · 30yr · 1.5% tax · 5.0% vac · 8.0% maint · 8.0% mgmt
Financing live
Cash to close
- Down payment
- $30,750
- Closing costs
- $3,690
- Reserves months
- —
- Total cash needed
- —
Loan-product check · same deal, 3 products live
Conventional
25% down · 7.5% · 30yr
- Down + closing
- —
- Monthly P&I
- —
- Monthly cashflow
- —
- DSCR
- —
- Eligible?
- —
Personal DTI + credit; lowest rate.
DSCR
20% down · 8.5% · 30yr
- Down + closing
- —
- Monthly P&I
- —
- Monthly cashflow
- —
- DSCR
- —
- Eligible?
- —
No personal income docs; deal must DSCR.
Hard money
10% down · 12.0% · 12mo
- Down + closing
- —
- Monthly P&I
- —
- Monthly cashflow
- —
- DSCR
- —
- Eligible?
- —
Short-term bridge; refi at stabilization.
Rent comps 7 comps
| Address | Beds | Baths | Sqft | Rent | $/sqft | DOM | Units | Dist |
|---|---|---|---|---|---|---|---|---|
| 1326 Doyle Ave Mobile, AL | 3.0 | 2.0 | 1518 | $1,750 | $1.15 | 13d | 1 | 0.23mi |
| 1854 Jacob Dr Unit Jacob Dr unit Mobile, AL | 4.0 | 2.0 | 1700 | $1,950 | $1.15 | 44d | 1 | 0.71mi |
| 1806 Gill Rd Mobile, AL | 3.0 | 2.0 | 1360 | $1,250 | $0.92 | 21d | 1 | 0.74mi |
| 1258 E Charmaine Cir Mobile, AL | 3.0 | 1.0 | 1071 | $1,350 | $1.26 | 21d | 1 | 1.09mi |
| 3910 W Charmaine Cir Mobile, AL | 3.0 | 1.0 | 1400 | $1,200 | $0.86 | 44d | 1 | 1.17mi |
| 1815 Ogburn Ave Unit B Mobile, AL | 2.0 | 1.0 | 900 | $900 | $1.00 | 21d | 1 | 1.17mi |
| 3917 Bay Front Rd Mobile, AL | 3.0 | 2.0 | 1583 | $2,650 | $1.67 | 21d | 1 | 1.19mi |
Listing history 18 events
-
2026-06-18days on market $123,000 Active 145 DOM
-
2026-06-17days on market $123,000 Active 144 DOM
-
2026-06-16days on market $123,000 Active 143 DOM
-
2026-06-15days on market $123,000 Active 142 DOM
-
2026-06-14days on market $123,000 Active 140 DOM
-
2026-06-13days on market $123,000 Active 139 DOM
-
2026-06-10days on market $123,000 Active 137 DOM
-
2026-06-09days on market $123,000 Active 136 DOM
-
2026-06-09price $123,000 Active 135 DOM
-
2026-06-08days on market $130,000 Active 135 DOM
-
2026-06-07days on market $130,000 Active 134 DOM
-
2026-06-05days on market $130,000 Active 131 DOM
-
2026-06-03days on market $130,000 Active 130 DOM
-
2026-06-02days on market $130,000 Active 129 DOM
-
2026-06-01days on market $130,000 Active 128 DOM
-
2026-05-31days on market $130,000 Active 127 DOM
-
2026-05-30days on market $130,000 Active 126 DOM
-
2026-01-24$130,000 Active 1488-char remark
Show marketing remark (1488 chars)
Welcome to this spacious 1,450+ sq. ft. corner-lot home situated on approximately 1.6 acres, offering room to spread out and endless potential. Featuring a durable metal roof, this property is a great opportunity for buyers looking to add their personal touch. Enter through the screened, covered patio into a welcoming living room. An adjacent den flows seamlessly into the kitchen, creating an open and functional layout ideal for everyday living and entertaining. The kitchen offers abundant cabinet space, perfect for storage of cookware and small appliances. Two bedrooms and a full guest bath are conveniently located off the living room, while the primary suite is privately tucked away with access from the den. The primary bedroom includes two large closets and a second full bathroom. Outside, the expansive property includes a two-car garage plus a double carport, providing ample parking and storage. The home is all electric; natural gas was previously connected but has not been used in recent years. This home is being sold AS IS, with no repairs to be made by the seller. Buyer and buyer’s agent to verify all measurements. The property will require some TLC to reach its full potential. Please use caution near the pool table in the den, as there is a known weak area in the flooring. Contact your favorite agent today to see this one! Listing agent is related to the seller through marriage. Listed by Crimson Jackson IXL Real Estate 251-802-4263
ⓘ Source: listings_history table (triggers on properties + properties_extension) + one-shot
backfill from property_details.listing_events for pre-trigger history.
Tax reassessment forecast AL · Resets to sale price
- Current annual tax
- $758 · $63/mo
- Projected year-2 tax
- $758 · $63/mo
- Expected delta
- $0/yr ($0/mo · 0.0%)
ⓘ Screening estimate from a state-policy table — verify with the county assessor before closing.
Nearby sold comps map
Loading sold comps map…
Walkable amenities ~0.75 mi
Loading nearby amenities…
Taxation est. · year 1
- Rental income
- $19,691
- − Mortgage interest
- −$6,890
- − Property taxes
- −$758
- − Insurance
- −$615
- − Repairs & maintenance
- −$1,575
- − Management
- −$1,575
- − Depreciation
- −$3,578
- Taxable income
- $4,699
- Est. tax owed @ 24.0%
- −$1,128
- After-tax cash flow
- $5,314/yr
For passive investors: Depreciation is non-cash, so a rental often shows a tax loss while cash-flowing — sheltering income. Rental losses are passive: they offset passive income freely, and up to $25,000/yr can offset ordinary (W-2) income if you actively participate and your MAGI is under $100k (phasing out to $0 by $150k); unused losses carry forward. On sale, claimed depreciation is recaptured at up to 25%, and gains may owe capital-gains tax (a 1031 exchange can defer both). Figures are a year-1 estimate at your 24.0% rate — not tax advice; consult a CPA.
Schools (NCES district)
- District
- Mobile County
- NCES district ID
- 0102370
- Math proficiency
- 15% ▼ -28.00%
- Reading proficiency
- 39% ▬ 0.00%
- Median HH income
- $42,455
- Composite
- 22.9/100
- National rank
- #8002
- State rank
- #81 of 129 in AL
Livability — Mobile
- Score
- 75/100
- State rank
- #20
- US rank
- #4262
Category grades
Schools grade is shown separately in the Schools card above.
Census & demographics
- Census place
- Mobile, AL
- County
- Mobile County · 246,577 people
- City population
- 205,729
- Metro
- Mobile, AL
- Population (ZIP)
- 25,104
- Household income
- $43,538
- Rent vs Own
- Severe rent burden
- 1521.0
Population outlook (Mobile County) Hauer SSP2
- Today (2025)
- 415,303 people
- By 2030
- 411,755 · -0.9%
- By 2040
- 399,670 · -3.8%
- By 2050
- 382,616 · -7.9%
- By 2075
- 337,353 · -18.8%
- By 2100
- 283,391 · -31.8%
Race, ethnicity, and origin ACS 2023
- Neighborhood character
- Predominantly Black (67%)
- Race & ethnicity
- Black 67% White 27% Two or more races 4% Hispanic / Latino 3%
- Common ancestry
- Lithuanian 3% Slovak 2% Iranian 1%
- Foreign-born
- 3% · Canada
- Languages at home
- 97% English-only · Spanish 2%
Political lean MEDSL · Mobile
- 2024 margin
- R (+16.4) · D 41.3% · R 57.7%
- 2008→2024 swing
- -7.7pp toward R · 2008: -8.7pp · 2024: -16.4pp
- All cycles
- 2024: R+16.4 2020: R+11.9 2016: R+13.9 2012: R+9.3 2008: R+8.7
Not yet ingested
- Civics
- —
Market trends
- HPI YoY
- ▼ -96.46%
- Current HPI
- 125.9526
- Rent YoY
- ▲ 8.26%
- Metro
- Mobile, AL
- State GDP YoY
- ▲ 2.94%
- F500 in state
- 4
Industry mix (Fortune 500 HQ in AL)
| Industry | F500 HQs | Revenue |
|---|---|---|
| Financial Services | 1 | $8B |
|
||
| Healthcare | 1 | $5B |
|
||
Price history
1 event — show timeline
- 2026-01-24 Listed $130,000 GCMLS AL
Property tax history
-6.7%/yrLatest (2025): $758 · +1.7% YoY. Source: county tax records.
Cash-flow waterfall
monthlySold comps — $/sqft
last 12 mo · ≤1 miLoading sold comps…