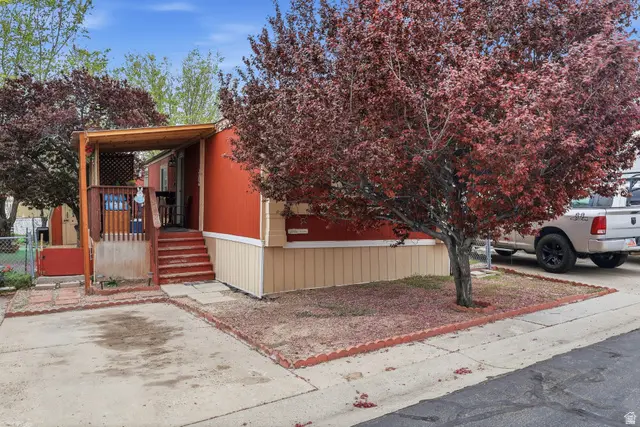
3771 S Deer Valley Dr #151 · Magna, UT
Flood risk 3/10 · Minor
- FEMA flood zone
- X (unshaded)
- Chance of flooding over 30 yrs
- 0.2%
- Est. flood insurance / yr
- $507 – $1,088
Fire risk 5/10 · Moderate
- Est. fire insurance / yr
- $453 – $841
Heat risk 4/10 · Minor
- Hot days now (above 93°F)
- 7 days/yr
- Hot days in 30 yrs
- 20 days/yr
Wind risk 1/10 · Minimal
- Chance of severe wind over 30 yrs
- —
Air-quality risk 3/10 · Minor
- Unhealthy air days now
- 3 days/yr
- Unhealthy air days in 30 yrs
- 4 days/yr
Risk factors via First Street. Map © Google.
Why this score? — see what drove the D+ grade
The composite is a weighted blend of 9 inputs, each scored 0–100. Each bar is that input's sub-score; the figure is the points it added to the 100-point composite (weight × sub-score).
- Cash flow +15.5/30.0
- 1% rule +10.0/10.0
- ARV discount +7.5/15.0
- DSCR +4.8/10.0
- Livability +3.7/5.0
- Schools +2.6/10.0
- Rent growth +2.5/5.0
- Condition / age +2.5/5.0
- Appreciation +0.0/10.0
$55,000
🖨 Deal sheet (PDF) 📄 Offer letter ✓ Due diligence
Listing remarks
Move-in ready manufactured home in Magna at $55,000 - priced below what the market is showing. Quick access to Hwy 201, Bangerter, and I-215 makes getting around the valley easy. Seller is motivated and open to seller financing. Text or call agent for details!
Key facts
- Built 1995
- Listed 78 days
Tags
Property features AI
Finance
- HOA & community: Homeowners association with a monthly fee of $1,109; Subdivision: SUNSET VISTA
Exterior
- Utilities: Natural gas connected; Electricity connected; Public sewer connection; Culinary (public) water connected
- Home design: Manufactured home; Property is built and standing; Residential use; 920 above-grade finished area
- Construction: Aluminum and frame construction
- Exterior features: Partially fenced lot; Paved road access; Double-pane windows; Asphalt roof
Interior
- Kitchen: Disposal
- Bedrooms: 3 main-level bedrooms
- Flooring: Carpet; Linoleum
- Bathrooms: 2 full bathrooms
- Heating & cooling: Gas central heating; Central air conditioning
- Interior features: Disposal; Slab basement; 9 total rooms
Neighborhood map
What this means for you Summary
Snapshot
- This is a 3-bed/2.0-bath manufactured listed at $55k.
Deal economics
- At list price, monthly cash flow is $22 ($270/yr) — positive.
- The deal already cash-flows at list — no discount required.
- Meets the 1% rule at list price ($2k rent vs $55k).
- Recommended offer: $52k (6.0% below list) — sets the bar for market timing.
Location & tenants
- Location reads 74/100 on livability (#65 in UT, #4,367 nationally) — a middle-class / working-renter tenant base. Strengths: commute A+, housing A+, cost of living B; Watch: amenities F, health & safety D-.
- Granite District (suburban): math 26% / reading 32% proficiency, ranked #69 of 80 in UT (top 86%) — low school quality limits family demand, transient renter base, plan for 1-2y turnover.
- Zoned schools: Copper Hills School (math 25% / reading 28%, grade F, #463 of 585 statewide, top 80%, 479 students, 60% FRL); Scott M Matheson Jr High (math 18% / reading 22%, grade F, #128 of 138 statewide, top 93%, 1,081 students, 51% FRL); Cyprus High (math 11% / reading 33%, grade F, #150 of 171 statewide, top 88%, 2,709 students, 47% FRL).
- Market conditions: 209 active listings in the ZIP; 8 comparable units currently listed for rent nearby; rentals at typical pace (median 16d on market — plan ~3-4 weeks tenant-placement turnaround); solid renter incomes; 4,970 units permitted in Salt Lake County in 2024 (1,963 in 5+ unit buildings).
Forward outlook
- Local home prices are declining (-3.0%/yr); year-one equity from $380 of loan paydown is wiped out by about $2k of value loss. Plan a longer hold.
- Salt Lake County population projected at +37% by 2050 — long-run rental-demand tailwind backs the buy-and-hold thesis.
Negotiation context
- It's been on market 78 days — a 6% lower offer ($52k) is reasonable based on typical stale-listing flexibility.
- 2 sale attempts since 11y ago with the ask held roughly flat each time — persistent listings suggest the price (not the market) is what's stuck; bring a comps-based counter.
Risks & watch-outs
- Watch-outs: HOA is 58% of rent.
- Climate carrying-cost: moderate wildfire risk — expect insurance premiums to compound above CPI over the hold.
Questions for the listing agent
- It's been on market 78 days. Have you received any prior offers? Is the seller open to a 6% concession, seller financing, or rate buy-down credit?
- What does the HOA fee cover, when was the last increase, and are there any pending special assessments or reserve-fund shortfalls?
- Why hasn't it sold? Are there any deal-killer items the seller is aware of (foundation, flood, title, zoning, code violations)?
- Is there a deadline driving the sale (1031 exchange, divorce, estate, relocation)? That informs how much negotiation room exists.
- Schools are F-rated, which usually means shorter tenancies and higher turnover. Who's the typical renter profile here, and what's been the actual vacancy rate?
- The area grade is low — what's the realistic commute time and amenity access for the typical tenant pool here? Any planned neighborhood developments (good or bad) we should know about?
- What's the average days-on-market for RENTAL listings here right now (not sales)? A rising rental-DOM trend means longer vacancies and softer asking-rent achievability than the comps imply.
- What's the recent tenant-quality profile in this submarket — average credit score on applications, eviction rate, late-payment / NSF rate, and stable-employment percentage? A property-management company in the area should have these aggregated.
- How much new for-sale + rental construction is in the pipeline within 1–3 miles? Heavy new supply typically softens prices + rents 12–24 months out; constrained supply supports both.
Investment metrics
- 1% rule
- 3.48% ✓
- Cap rate
- 6.78%
- Cash-on-cash
- 1.75%
- DSCR
- 1.08
- GRM
- 2.4
CMA / ARV
No comps found within radius.
Projected returns pro-forma
-3.0% appreciation · 3.0% rent growth · sell at horizon
- IRR
- -12.0%
- Equity multiple
- 0.56×
- Total profit
- $-6,771
- Equity at exit
- $8,201
- IRR
- -1.0%
- Equity multiple
- 0.92×
- Total profit
- $-1,168
- Equity at exit
- $4,755
Cash invested: $15,400 (down + closing). Projections, not guarantees.
Landlord ↔ Tenant lean methodology
- Overall (STATE)
- 86 Strongly Landlord-Friendly
- State Utah
- 86 Strongly Landlord-Friendly · R+15
- County
- — inherits STATE
- City
- — inherits STATE
ZIP-level market 84044
- Active inventory
- 209
- Price-to-rent
- 2.4×
Monthly cashflow live
- Estimated rent
- $1,913 high interval (Pro) →
- Mortgage (P&I)
- −$288
- Tax est. 1.5%
- −$69 /mo · $825/yr
- Insurance
- −$23
- HOA
- −$1,109
- Vacancy / Maint / Mgmt
- −$402
- Net cashflow
- $22
Break-even live
Sensitivity live
| Price | -10% $60 | -5% $41 | +0% $22 | +5% $3 | +10% $-16 |
|---|---|---|---|---|---|
| Rent | -10% $-129 | -5% $-53 | +0% $22 | +5% $98 | +10% $174 |
| Rate | -1.0pp $50 | -0.5pp $36 | base $22 | +0.5pp $8 | +1.0pp $-6 |
UW: 25.0% down · 7.5% · 30yr · 1.5% tax · 5.0% vac · 8.0% maint · 8.0% mgmt
Financing live
Cash to close
- Down payment
- $13,750
- Closing costs
- $1,650
- Reserves months
- —
- Total cash needed
- —
Loan-product check · same deal, 3 products live
Conventional
25% down · 7.5% · 30yr
- Down + closing
- —
- Monthly P&I
- —
- Monthly cashflow
- —
- DSCR
- —
- Eligible?
- —
Personal DTI + credit; lowest rate.
DSCR
20% down · 8.5% · 30yr
- Down + closing
- —
- Monthly P&I
- —
- Monthly cashflow
- —
- DSCR
- —
- Eligible?
- —
No personal income docs; deal must DSCR.
Hard money
10% down · 12.0% · 12mo
- Down + closing
- —
- Monthly P&I
- —
- Monthly cashflow
- —
- DSCR
- —
- Eligible?
- —
Short-term bridge; refi at stabilization.
Rent comps 8 comps
| Address | Beds | Baths | Sqft | Rent | $/sqft | DOM | Units | Dist |
|---|---|---|---|---|---|---|---|---|
| 8525 W Elk Mountain Rd Magna, UT | 2.0–3.0 | 1.5–2.0 | 1075 | $1,739 | $1.62 | 15d | 2 | 0.26mi |
| 8279 Arbor Park Dr Magna, UT | 1.0–3.0 | 1.0–2.0 | 849 | $2,094 | $2.46 | 3d | 7 | 0.32mi |
| 8548 W Henderson Way Magna, UT | 1.0–3.0 | 1.0–2.0 | 983 | $2,129 | $2.17 | 3d | 25 | 0.33mi |
| 3544 S Kingsburg Cv Magna, UT | 2.0 | 1.0 | 885 | $1,490 | $1.68 | 15d | 1 | 0.50mi |
| 8061 W Copperfield Pl #32 Magna, UT | 3.0 | 2.0 | 1005 | $1,650 | $1.64 | 6d | 1 | 0.71mi |
| 3700 Jefferson Cir Unit B Magna, UT | 2.0 | 1.0 | 1000 | $1,300 | $1.30 | 25d | 1 | 1.15mi |
| 2679 S Melville Dr Magna, UT | 2.0 | 1.0 | 795 | $1,598 | $2.01 | 18d | 1 | 1.48mi |
| 2846 S 9050 W Unit 2848 Magna, UT | 2.0 | 1.0 | 615 | $1,395 | $2.27 | 25d | 1 | 1.49mi |
HOA detail
- Monthly dues
- $1,109 · $13,308/yr
Listing history 15 events
-
2026-06-18days on market $55,000 Active 78 DOM
-
2026-06-17days on market $55,000 Active 77 DOM
-
2026-06-16days on market $55,000 Active 76 DOM
-
2026-06-15days on market $55,000 Active 75 DOM
-
2026-06-13days on market $55,000 Active 73 DOM
-
2026-06-09days on market $55,000 Active 69 DOM
-
2026-06-08days on market $55,000 Active 68 DOM
-
2026-06-07days on market $55,000 Active 67 DOM
-
2026-06-03days on market $55,000 Active 63 DOM
-
2026-06-02days on market $55,000 Active 62 DOM
-
2026-06-01days on market $55,000 Active 61 DOM
-
2026-05-31days on market $55,000 Active 60 DOM
-
2026-04-02$55,000 Active
-
2016-06-16historical
-
2015-12-16$27,900 Active
ⓘ Source: listings_history table (triggers on properties + properties_extension) + one-shot
backfill from property_details.listing_events for pre-trigger history.
Climate risk First Street
- Flood 3/10 Moderate FEMA zone X (unshaded) · 20% chance over 30 yrs
- Wildfire 5/10 Major
- Heat 4/10 Moderate 7 d/yr ≥93°F today · 20 d/yr by 30 yrs out
- Wind 1/10 Low
- Air quality 3/10 Moderate 3 unhealthy d/yr today · 4 by 30 yrs out
Nearby sold comps map
Loading sold comps map…
Walkable amenities ~0.75 mi
Loading nearby amenities…
Taxation est. · year 1
- Rental income
- $22,960
- − Mortgage interest
- −$3,081
- − Property taxes
- −$825
- − Insurance
- −$275
- − Repairs & maintenance
- −$1,837
- − Management
- −$1,837
- − HOA
- −$13,308
- − Depreciation
- −$1,600
- Taxable income
- $198
- Est. tax owed @ 24.0%
- −$47
- After-tax cash flow
- $222/yr
For passive investors: Depreciation is non-cash, so a rental often shows a tax loss while cash-flowing — sheltering income. Rental losses are passive: they offset passive income freely, and up to $25,000/yr can offset ordinary (W-2) income if you actively participate and your MAGI is under $100k (phasing out to $0 by $150k); unused losses carry forward. On sale, claimed depreciation is recaptured at up to 25%, and gains may owe capital-gains tax (a 1031 exchange can defer both). Figures are a year-1 estimate at your 24.0% rate — not tax advice; consult a CPA.
Schools (NCES district)
- District
- Granite District
- NCES district ID
- 4900360
- Math proficiency
- 26% ▼ -8.00%
- Reading proficiency
- 32% ▼ -3.00%
- Median HH income
- $55,971
- Composite
- 25.93/100
- National rank
- #7336
- State rank
- #69 of 80 in UT
Livability — Magna
- Score
- 74/100
- State rank
- #65
- US rank
- #4367
Category grades
Schools grade is shown separately in the Schools card above.
Census & demographics
- Census place
- Magna, UT
- County
- Salt Lake County · 1,195,750 people
- City population
- 30,031
- Metro
- Salt Lake City, UT
- Population (ZIP)
- 30,031
- Household income
- $90,346
- Rent vs Own
- Severe rent burden
- 384.0
Population outlook (Salt Lake County) Hauer SSP2
- Today (2025)
- 1,305,860 people
- By 2030
- 1,402,611 · +7.4%
- By 2040
- 1,594,533 · +22.1%
- By 2050
- 1,787,244 · +36.9%
- By 2075
- 2,224,138 · +70.3%
- By 2100
- 2,551,390 · +95.4%
Race, ethnicity, and origin ACS 2023
- Neighborhood character
- Diverse neighborhood (Simpson 0.58)
- Race & ethnicity
- White 54% Hispanic / Latino 36% Two or more races 14% Asian 2% Pacific Islander 2% Black 2%
- Hispanic origin (detail)
- Mexican 28%
- Common ancestry
- Slovak 4% Iranian 2% Italian 2%
- Foreign-born
- 16% · Canada, Jamaica
- Languages at home
- 71% English-only · Spanish 24% Other Asian/Pacific 2% Other Indo-European 2%
Political lean MEDSL · Salt Lake
- 2024 margin
- D (+10.2) · D 53.7% · R 43.5% · Other 2.8%
- 2008→2024 swing
- +10.1pp toward D · 2008: 0.1pp · 2024: 10.2pp
- All cycles
- 2024: D+10.2 2020: D+11.0 2016: D+10.2 2012: R+19.3 2008: D+0.1
Not yet ingested
- Civics
- —
Market trends
- HPI YoY
- ▼ -191.88%
- Current HPI
- 355.0523
- Rent YoY
- —
- Metro
- Salt Lake City, UT
- State GDP YoY
- ▲ 3.54%
- F500 in state
- 2
Industry mix (Fortune 500 HQ in UT)
| Industry | F500 HQs | Revenue |
|---|---|---|
| Financial Services | 1 | $3B |
|
||
Price history
+97.1% since first listed3 events — show timeline
- 2026-04-02 Listed $55,000 WFRMLS
- 2016-06-16 Listing Removed — WFRMLS
- 2015-12-16 Listed $27,900 WFRMLS
Cash-flow waterfall
monthlySold comps — $/sqft
last 12 mo · ≤1 miLoading sold comps…