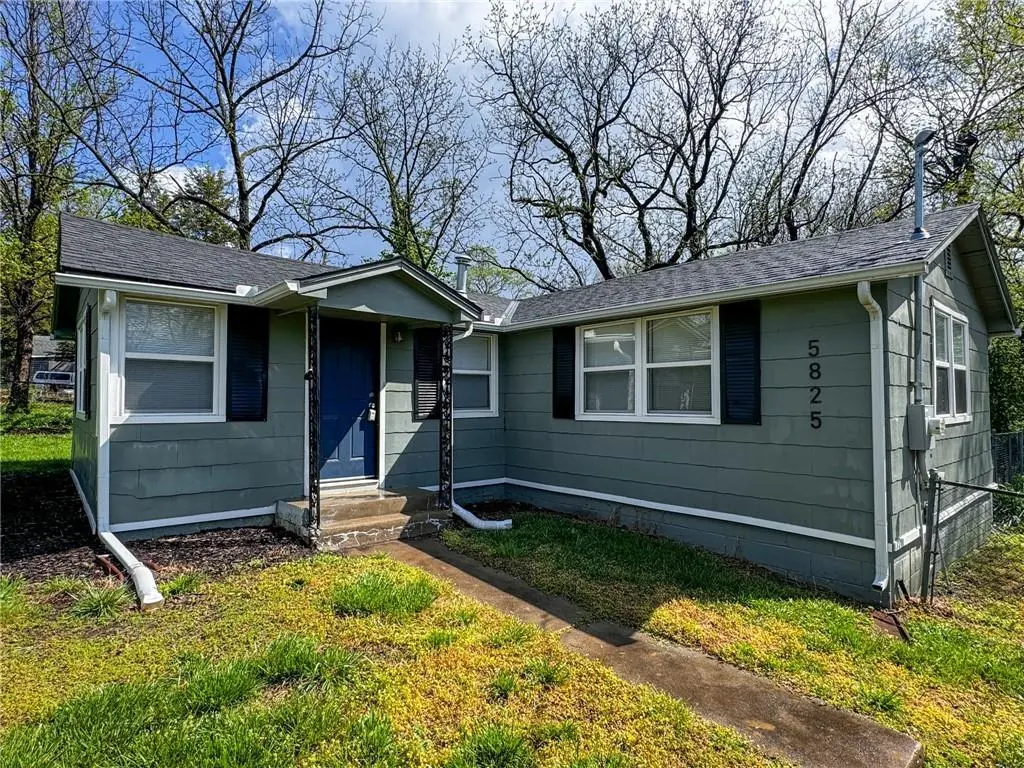
5825 Manchester Dr · Kansas City, MO
Flood risk 1/10 · Minimal
- FEMA flood zone
- X (unshaded)
- Chance of flooding over 30 yrs
- 0.0%
- Est. flood insurance / yr
- $507 – $1,088
Fire risk 2/10 · Minimal
- Est. fire insurance / yr
- $1,054 – $1,958
Heat risk 4/10 · Minor
- Hot days now (above 107°F)
- 7 days/yr
- Hot days in 30 yrs
- 16 days/yr
Wind risk 2/10 · Minimal
- Chance of severe wind over 30 yrs
- —
Air-quality risk 3/10 · Minor
- Unhealthy air days now
- 3 days/yr
- Unhealthy air days in 30 yrs
- 5 days/yr
Risk factors via First Street. Map © Google.
Why this score? — see what drove the C grade
The composite is a weighted blend of 9 inputs, each scored 0–100. Each bar is that input's sub-score; the figure is the points it added to the 100-point composite (weight × sub-score).
- Cash flow +25.4/30.0
- ARV discount +9.6/15.0
- DSCR +8.4/10.0
- 1% rule +5.7/10.0
- Livability +3.9/5.0
- Rent growth +2.5/5.0
- Condition / age +2.5/5.0
- Schools +1.8/10.0
- Appreciation +0.0/10.0
$122,500
🖨 Deal sheet (PDF) 📄 Offer letter ✓ Due diligence
Listing remarks
Attention Investors: Charming and updated! this 2-bedroom, 1-bathroom home offers a great blend of style and convenience. Inside, you'll find beautiful hardwood floors in the living areas and bedrooms, modern paint tones throughout, and a kitchen featuring newer flooring and appliances. Enjoy the spacious backyard—perfect for relaxing or entertaining. Located just minutes from 435 and 350 highways, with easy access to grocery stores, restaurants, and entertainment. Home is currently tenant-occupied through May 2026—perfect for investors or buyers looking for rental income right away.
Key facts
- Updated kitchen
- Main-floor laundry
- Hardwood floors
Tags
Property features AI
Finance
- Financial info: Annual tax amount reported
- HOA & community: No association fees
Exterior
- Parking: Off-street parking; Shared driveway
- Utilities: Public water; Public sewer
- Home design: Single-family residence; Residential property; Ranch style; One story
- Construction: Composition roof; Other construction materials; Property age: 76-100 years
- Exterior features: Not in a flood plain; Lot approximately 7,405 sq ft
Interior
- Bedrooms: 2 bedrooms
- Bathrooms: 1 full bathroom
- Heating & cooling: Forced air heating; No central cooling
- Interior features: Crawl space basement; Ranch floor plan
Neighborhood map
What this means for you Summary
Snapshot
- This is a 2-bed/1.0-bath single-family listed at $122k.
Deal economics
- At list price, monthly cash flow is $281 ($3k/yr) — positive.
- The deal already cash-flows at list — no discount required.
- Meets the 1% rule at list price ($1k rent vs $122k).
- Cap rate 9.0% vs local median 3.9% in Kansas City — top-decile yield for the area; either an underpriced asset or a hidden risk that comps aren't pricing in. Stress-test before assuming the spread holds.
Location & tenants
- Location reads 78/100 on livability (#28 in MO, #2,671 nationally) — a middle-class / working-renter tenant base. Strengths: amenities A+, commute A+, cost of living A+; Watch: crime F.
- Raytown C-2 (suburban): math 12% / reading 28% proficiency, ranked #302 of 324 in MO (top 93%) — low school quality limits family demand, transient renter base, plan for 1-2y turnover.
- Zoned schools: Blue Ridge Elem. (math 17% / reading 32%, grade F, #879 of 1,115 statewide, top 81%, 329 students, 69% FRL); Raytown South Sr. High (math 8% / reading 32%, grade F, #475 of 521 statewide, top 92%, 1,185 students, 68% FRL).
- Market conditions: 52 active listings in the ZIP; 9 comparable units currently listed for rent nearby; rentals lingering (median 45d on market — plan ~5-8 weeks vacancy on turnover, expect pricing pressure); 56% of comp listings sitting > 30 days — soft ceiling on asking rent; 4,002 units permitted in Jackson County in 2024 (2,271 in 5+ unit buildings).
- This rent runs 31% of the median local income ($51k/yr) — at the standard rent-burdened threshold; future hikes will face affordability resistance.
Forward outlook
- Local home prices are declining (-3.0%/yr); year-one equity from $847 of loan paydown is wiped out by about $4k of value loss. Plan a longer hold.
- Jackson County population projected at +4% by 2050 — modest demand growth; plan on rents tracking national, not racing it.
Negotiation context
- Only 10 days on market — expect competitive offers; lowballing is unlikely to land.
- 6 sale attempts since 26y ago with the ask held roughly flat each time — persistent listings suggest the price (not the market) is what's stuck; bring a comps-based counter.
Risks & watch-outs
- Watch-outs: built in 1950 — expect roof / HVAC / electrical / plumbing capex.
Questions for the listing agent
- Built in 1950 — when were the roof, HVAC, electrical panel, plumbing, and water heater last replaced?
- Is there a deadline driving the sale (1031 exchange, divorce, estate, relocation)? That informs how much negotiation room exists.
- Crime grade is F in this area — have there been break-ins, vandalism, or insurance claims at this property in the last 3 years? What carrier currently insures it and at what premium?
- What's the average days-on-market for RENTAL listings here right now (not sales)? A rising rental-DOM trend means longer vacancies and softer asking-rent achievability than the comps imply.
- What's the recent tenant-quality profile in this submarket — average credit score on applications, eviction rate, late-payment / NSF rate, and stable-employment percentage? A property-management company in the area should have these aggregated.
- How much new for-sale + rental construction is in the pipeline within 1–3 miles? Heavy new supply typically softens prices + rents 12–24 months out; constrained supply supports both.
Investment metrics
- 1% rule
- 1.07% ✓
- Cap rate
- 9.05%
- Cash-on-cash
- 9.83%
- DSCR
- 1.44
- GRM
- 7.8
CMA / ARV
- ARV (median comp)
- $128,388
- List price
- $122,500
- Delta
- -4.59%
- Verdict
- FAIR
- Comps
- 20 within 1.0 mi
Show comp detail 5 sales within ~0.75 mi
| Address | Dist | Beds/Ba | Sqft | Sold | Price | $/sf | Match |
|---|---|---|---|---|---|---|---|
| 8004 E 57th St | 0.22mi | 2/1.0 | 728 (-5%) | 12mo | $130,000 | $179 | 71 |
| 5605 Oakland Ave | 0.30mi | 2/1.0 | 728 (-5%) | 9mo | $149,950 | $206 | 70 |
| 8516 E 57th St | 0.49mi | 2/1.0 | 780 (+2%) | 12mo | $160,000 | $205 | 64 |
| 7407 E 56th Ter | 0.27mi | 2/1.0 | 844 (+10%) | 8mo | $95,000 | $113 | 64 |
| 7617 E 52nd Ter | 0.69mi | 3/1.0 (+1) | 864 (+12%) | 16mo | $160,000 | $185 | 28 |
Match score weights: distance 35% · size 25% · config 20% · recency 20%. Top-matched comps best support the ARV.
Projected returns pro-forma
-3.0% appreciation · 3.0% rent growth · sell at horizon
- IRR
- -1.5%
- Equity multiple
- 0.94×
- Total profit
- $-1,989
- Equity at exit
- $18,265
- IRR
- 8.1%
- Equity multiple
- 1.62×
- Total profit
- $21,169
- Equity at exit
- $10,592
Cash invested: $34,300 (down + closing). Projections, not guarantees.
Landlord ↔ Tenant lean methodology
- Overall (STATE)
- 81 Strongly Landlord-Friendly
- State Missouri
- 81 Strongly Landlord-Friendly · R+10
- County
- — inherits STATE
- City
- — inherits STATE
ZIP-level market 64129
- Home prices YoY
- -9.8%
- Active inventory
- 52
- Price-to-rent
- 7.8×
Monthly cashflow live
- Estimated rent
- $1,313 high interval (Pro) →
- Mortgage (P&I)
- −$642
- Tax from tax record
- −$63 /mo · $752/yr
- Insurance
- −$51
- HOA
- −$0
- Vacancy / Maint / Mgmt
- −$276
- Net cashflow
- $281
Break-even live
Sensitivity live
| Price | -10% $350 | -5% $316 | +0% $281 | +5% $246 | +10% $212 |
|---|---|---|---|---|---|
| Rent | -10% $177 | -5% $229 | +0% $281 | +5% $333 | +10% $385 |
| Rate | -1.0pp $343 | -0.5pp $312 | base $281 | +0.5pp $249 | +1.0pp $217 |
UW: 25.0% down · 7.5% · 30yr · 1.5% tax · 5.0% vac · 8.0% maint · 8.0% mgmt
Financing live
Cash to close
- Down payment
- $30,625
- Closing costs
- $3,675
- Reserves months
- —
- Total cash needed
- —
Loan-product check · same deal, 3 products live
Conventional
25% down · 7.5% · 30yr
- Down + closing
- —
- Monthly P&I
- —
- Monthly cashflow
- —
- DSCR
- —
- Eligible?
- —
Personal DTI + credit; lowest rate.
DSCR
20% down · 8.5% · 30yr
- Down + closing
- —
- Monthly P&I
- —
- Monthly cashflow
- —
- DSCR
- —
- Eligible?
- —
No personal income docs; deal must DSCR.
Hard money
10% down · 12.0% · 12mo
- Down + closing
- —
- Monthly P&I
- —
- Monthly cashflow
- —
- DSCR
- —
- Eligible?
- —
Short-term bridge; refi at stabilization.
Rent comps 9 comps
| Address | Beds | Baths | Sqft | Rent | $/sqft | DOM | Units | Dist |
|---|---|---|---|---|---|---|---|---|
| 5420 Blue Ridge Cutoff Raytown, MO | 1.0 | 1.0 | 550 | $1,004 | $1.83 | 45d | 1 | 0.83mi |
| 5126 Booth Ave Kansas City, MO | 2.0 | 1.0 | 950 | $1,149 | $1.21 | 13d | 1 | 0.84mi |
| 8855 E 59th St Raytown, MO | 3.0 | 1.5 | 864 | $1,396 | $1.62 | 45d | 1 | 0.85mi |
| 5312 Hunter St Raytown, MO | 3.0 | 1.5 | 912 | $1,450 | $1.59 | 3d | 1 | 1.05mi |
| 5312 Hunter St Raytown, MO | 3.0 | 1.5 | 912 | $1,450 | $1.59 | 4d | 1 | 1.05mi |
| 7601 Sni a Bar Ter Kansas City, MO | 2.0 | 1.0 | 827 | $1,099 | $1.33 | 45d | 1 | 1.13mi |
| 7615 E 49th St Kansas City, MO | 2.0 | 1.0 | 888 | $1,095 | $1.23 | 45d | 1 | 1.13mi |
| 4730 Richmond Ave Kansas City, MO | 3.0 | 1.0 | 821 | $1,395 | $1.70 | 45d | 1 | 1.30mi |
| 7611 E 47th Ter Kansas City, MO | 3.0 | 1.0 | 840 | $1,276 | $1.52 | 8d | 1 | 1.31mi |
Listing history 28 events
-
2026-06-21days on market $122,500 Active 10 DOM
-
2026-06-18days on market $122,500 Active 7 DOM
-
2026-06-17days on market $122,500 Active 6 DOM
-
2026-06-16days on market $122,500 Active 5 DOM
-
2026-06-15days on market $122,500 Active 4 DOM
-
2026-06-13days on market $122,500 Active 2 DOM
-
2026-06-13days on market $122,500 Active 1 DOM
-
2026-06-03days on market $122,500 Active 150 DOM
-
2026-06-02days on market $122,500 Active 149 DOM
-
2026-06-01days on market $122,500 Active 148 DOM
-
2026-05-31days on market $122,500 Active 147 DOM
-
2026-01-04$122,500 Active 602-char remark
-
2026-01-03historical
-
2025-08-30status Active
-
2025-08-20status Pending
-
2025-07-05$122,500 Active
-
2025-07-04historical
-
2024-03-26soldstatus Closed
-
2024-03-26soldstatus
-
2024-03-07status Pending
-
2024-02-23$119,000 Active
-
2021-05-28soldstatus
-
2021-01-20soldstatus
-
2020-08-05soldstatus
-
2000-09-15soldstatus
-
2000-06-01$16,000
-
1997-07-15soldstatus
-
1989-06-01soldstatus
ⓘ Source: listings_history table (triggers on properties + properties_extension) + one-shot
backfill from property_details.listing_events for pre-trigger history.
Tax reassessment forecast MO · Resets to sale price
- Current annual tax
- $752 · $63/mo
- Projected year-2 tax
- $1,188 · $99/mo
- Expected delta
- +$436/yr (+$36/mo · 58.0%)
ⓘ Screening estimate from a state-policy table — verify with the county assessor before closing.
Climate risk First Street
- Flood 1/10 Low FEMA zone X (unshaded) · 0% chance over 30 yrs
- Wildfire 2/10 Low
- Heat 4/10 Moderate 7 d/yr ≥107°F today · 16 d/yr by 30 yrs out
- Wind 2/10 Low
- Air quality 3/10 Moderate 3 unhealthy d/yr today · 5 by 30 yrs out
Nearby sold comps map
Loading sold comps map…
Walkable amenities ~0.75 mi
Loading nearby amenities…
Taxation est. · year 1
- Rental income
- $15,754
- − Mortgage interest
- −$6,862
- − Property taxes
- −$752
- − Insurance
- −$612
- − Repairs & maintenance
- −$1,260
- − Management
- −$1,260
- − Depreciation
- −$3,564
- Taxable income
- $1,443
- Est. tax owed @ 24.0%
- −$346
- After-tax cash flow
- $3,026/yr
For passive investors: Depreciation is non-cash, so a rental often shows a tax loss while cash-flowing — sheltering income. Rental losses are passive: they offset passive income freely, and up to $25,000/yr can offset ordinary (W-2) income if you actively participate and your MAGI is under $100k (phasing out to $0 by $150k); unused losses carry forward. On sale, claimed depreciation is recaptured at up to 25%, and gains may owe capital-gains tax (a 1031 exchange can defer both). Figures are a year-1 estimate at your 24.0% rate — not tax advice; consult a CPA.
Schools (NCES district)
- District
- Raytown C-2
- NCES district ID
- 2926070
- Math proficiency
- 12% ▼ -11.00%
- Reading proficiency
- 28% ▼ -9.00%
- Median HH income
- $47,215
- Composite
- 17.59/100
- National rank
- #9039
- State rank
- #302 of 324 in MO
Livability — Kansas City
- Score
- 78/100
- State rank
- #28
- US rank
- #2671
Category grades
Schools grade is shown separately in the Schools card above.
Census & demographics
- Census place
- Kansas City, MO
- County
- Jackson County · 687,798 people
- City population
- 439,467
- Metro
- Kansas City, MO-KS
- Population (ZIP)
- 9,267
- Household income
- $51,310
- Rent vs Own
- Severe rent burden
- 349.0
Population outlook (Jackson County) Hauer SSP2
- Today (2025)
- 719,589 people
- By 2030
- 731,456 · +1.6%
- By 2040
- 746,689 · +3.8%
- By 2050
- 749,289 · +4.1%
- By 2075
- 736,227 · +2.3%
- By 2100
- 668,210 · -7.1%
Race, ethnicity, and origin ACS 2023
- Neighborhood character
- Diverse neighborhood (Simpson 0.65)
- Race & ethnicity
- Black 45% White 37% Hispanic / Latino 11% Two or more races 9%
- Hispanic origin (detail)
- Mexican 6%
- Common ancestry
- Lithuanian 4% Italian 2% Armenian 1%
- Foreign-born
- 8% · Canada
- Languages at home
- 87% English-only · Spanish 8% Arabic 1%
Political lean MEDSL · Jackson
- 2024 margin
- D (+19.3) · D 58.9% · R 39.5% · Other 1.6%
- 2008→2024 swing
- -6.1pp toward R · 2008: 25.4pp · 2024: 19.3pp
- All cycles
- 2024: D+19.3 2020: D+22.0 2016: D+16.6 2012: D+19.0 2008: D+25.4
Not yet ingested
- Civics
- —
Market trends
- HPI YoY
- ▼ -32.25%
- Current HPI
- 297.5233
- Rent YoY
- —
- Metro
- Kansas City, MO-KS
- State GDP YoY
- ▲ 1.84%
- F500 in state
- 20
Industry mix (Fortune 500 HQ in MO)
| Industry | F500 HQs | Revenue |
|---|---|---|
| Healthcare | 1 | $163B |
|
||
| Insurance | 1 | $21B |
|
||
| Industrial Technology | 1 | $17B |
|
||
| Retail | 1 | $16B |
|
||
| Industrial Distribution | 1 | $10B |
|
||
| Utilities | 1 | $9B |
|
||
Price history
+665.6% since first listed19 events — show timeline
- 2026-06-11 Listed $122,500 Heartland MLS as Distributed by MLS Grid
- 2026-06-03 Listing Removed — Heartland MLS as Distributed by MLS Grid
- 2026-01-04 Listed $122,500 Heartland MLS as Distributed by MLS Grid
- 2026-01-03 Listing Removed — Heartland MLS as Distributed by MLS Grid
- 2025-08-30 Relisted — Heartland MLS as Distributed by MLS Grid
- 2025-08-20 Pending — Heartland MLS as Distributed by MLS Grid
- 2025-07-05 Listed $122,500 Heartland MLS as Distributed by MLS Grid
- 2025-07-04 Coming Soon — Heartland MLS as Distributed by MLS Grid
- 2024-03-26 Sold (Public Records) — Public Records
- 2024-03-26 Sold (MLS) — Heartland MLS as Distributed by MLS Grid
- 2024-03-07 Pending — Heartland MLS as Distributed by MLS Grid
- 2024-02-23 Listed $119,000 Heartland MLS as Distributed by MLS Grid
- 2021-05-28 Sold (Public Records) — Public Records
- 2021-01-20 Sold (Public Records) — Public Records
- 2020-08-05 Sold (Public Records) — Public Records
- 2000-09-15 Sold (MLS) — Heartland MLS as Distributed by MLS Grid
- 2000-06-01 Listed $16,000 Heartland MLS as Distributed by MLS Grid
- 1997-07-15 Sold (Public Records) — Public Records
- 1989-06-01 Sold (Public Records) — Public Records
Property tax history
+1.1%/yrLatest (2025): $752 · -48.7% YoY. Source: county tax records.
Cash-flow waterfall
monthlySold comps — $/sqft
last 12 mo · ≤1 miLoading sold comps…