483 1/2 Fruitwood Dr · Clifton, CO
Flood risk 1/10 · Minimal
- FEMA flood zone
- X (unshaded)
- Chance of flooding over 30 yrs
- 0.0%
- Est. flood insurance / yr
- $507 – $1,088
Fire risk 1/10 · Minimal
- Est. fire insurance / yr
- $939 – $1,743
Heat risk 5/10 · Moderate
- Hot days now (above 95°F)
- 7 days/yr
- Hot days in 30 yrs
- 18 days/yr
Wind risk 1/10 · Minimal
- Chance of severe wind over 30 yrs
- —
Air-quality risk 2/10 · Minimal
- Unhealthy air days now
- 1 days/yr
- Unhealthy air days in 30 yrs
- 1 days/yr
Risk factors via First Street. Map © Google.
Why this score? — see what drove the C- grade
The composite is a weighted blend of 9 inputs, each scored 0–100. Each bar is that input's sub-score; the figure is the points it added to the 100-point composite (weight × sub-score).
- Cash flow +21.7/30.0
- ARV discount +7.5/15.0
- DSCR +6.9/10.0
- 1% rule +5.7/10.0
- Rent growth +3.3/5.0
- Livability +3.3/5.0
- Schools +2.8/10.0
- Condition / age +1.0/5.0
- Appreciation +0.0/10.0
$203,000
🖨 Deal sheet 📄 Offer letter ✓ Due diligence
Listing remarks MLS
Freshly updated four bedroom home! You have to stop and see this one to appreciate it. The home has brand new beautiful LVT flooring, updated bathrooms, RV parking, a play set, storage shed, metal rough, and much more! You’ll love the oversized dining room for entertaining and sitting outside on your covered patio to enjoy your beautiful yard. Schedule your showing to see this beauty for yourself.
Key facts
- Cul de-sac lot
- Storage shed
- 0.24 acre lot
Tags
Property features AI
Exterior
- Parking: Attached 2-car garage
- Utilities: Public water; Sewer connected/available
- Home design: Single-family residential; Two-story home; Residential zoning (RSF)
- Construction: Brick veneer and wood siding exterior; Asphalt/composition roof
- Exterior features: Covered patio; Chain link and privacy fencing; Shed on the property
Interior
- Flooring: Laminate and simulated wood flooring
- Heating & cooling: Forced air heat (natural gas); No central cooling
- Interior features: Living room fireplace; Laminate/simulated wood flooring
Neighborhood map
What this means for you Summary
Snapshot
- This is a 4-bed/3.0-bath single-family listed at $203k. Condition is rated poor.
Deal economics
- At list price, monthly cash flow is $314 ($4k/yr) — positive.
- The deal already cash-flows at list — no discount required.
- Meets the 1% rule at list price ($2k rent vs $203k).
- Cap rate 8.1% vs local median 3.3% in Clifton — top-decile yield for the area; either an underpriced asset or a hidden risk that comps aren't pricing in. Stress-test before assuming the spread holds.
Location & tenants
- Location reads 66/100 on livability (#140 in CO) — a middle-class / working-renter tenant base. Strengths: housing A+, cost of living A, commute A-; Watch: crime F, amenities F, employment F.
- Mesa County Valley School District No. 51 (suburban): math 26% / reading 38% proficiency, ranked #43 of 86 in CO (top 50%) — families likely to look elsewhere, expect single-tenant / working-renter base with shorter leases.
- Zoned schools: Pear Park Elementary School (math 12% / reading 27%, grade F, #706 of 966 statewide, top 75%, 441 students, 71% FRL); Grand Mesa Middle School (math 13% / reading 29%, grade F, #198 of 270 statewide, top 74%, 511 students, 59% FRL); Central High School (math 19% / reading 43%, grade F, #229 of 381 statewide, top 60%, 1,613 students, 45% FRL) — zoned schools average 58% FRL vs 39% district-wide (19 pts higher); higher-poverty schools than district average — tighter screening recommended.
- Market conditions: Rents rising (+3.2%/yr); 280 active listings in the ZIP; 10 comparable units currently listed for rent nearby; rentals at typical pace (median 21d on market — plan ~3-4 weeks tenant-placement turnaround); 1,014 units permitted in Mesa County in 2024 (240 in 5+ unit buildings).
- This rent runs 37% of the median local income ($71k/yr) — at the standard rent-burdened threshold; future hikes will face affordability resistance.
Forward outlook
- Local home prices are declining (-3.0%/yr); year-one equity from $1k of loan paydown is wiped out by about $6k of value loss. Plan a longer hold.
Negotiation context
- Only 4 days on market — expect competitive offers; lowballing is unlikely to land.
- 4 sale attempts since 11y ago with the ask held roughly flat each time — persistent listings suggest the price (not the market) is what's stuck; bring a comps-based counter.
Risks & watch-outs
- Climate carrying-cost: extreme-heat days projected 7→18/yr by 2055 (HVAC capex compounding) — expect insurance premiums to compound above CPI over the hold.
Questions for the listing agent
- Have any recent inspections been done? Can we get a copy of the seller's disclosures and any deferred-maintenance estimates?
- Built in 1977 — when were the roof, HVAC, electrical panel, plumbing, and water heater last replaced?
- Is there a deadline driving the sale (1031 exchange, divorce, estate, relocation)? That informs how much negotiation room exists.
- Schools are F-rated, which usually means shorter tenancies and higher turnover. Who's the typical renter profile here, and what's been the actual vacancy rate?
- Crime grade is F in this area — have there been break-ins, vandalism, or insurance claims at this property in the last 3 years? What carrier currently insures it and at what premium?
- What's the average days-on-market for RENTAL listings here right now (not sales)? A rising rental-DOM trend means longer vacancies and softer asking-rent achievability than the comps imply.
- What's the recent tenant-quality profile in this submarket — average credit score on applications, eviction rate, late-payment / NSF rate, and stable-employment percentage? A property-management company in the area should have these aggregated.
- How much new for-sale + rental construction is in the pipeline within 1–3 miles? Heavy new supply typically softens prices + rents 12–24 months out; constrained supply supports both.
Investment metrics
- 1% rule
- 1.07% ✓
- Cap rate
- 8.15%
- Cash-on-cash
- 6.62%
- DSCR
- 1.29
- GRM
- 7.8
CMA / ARV
- ARV (on-the-fly)
- $427,008
- Comps found
- 12
Show comp detail 12 sales within ~0.75 mi
| Address | Dist | Beds/Ba | Sqft | Sold | Price | $/sf | Match |
|---|---|---|---|---|---|---|---|
| 483 1/2 Fruitwood Dr | 0.00mi | 4/3.0 | 1,536 (0%) | 0mo | $203,000 | $132 | 100 |
| 3062 1/2 Gunnison Ave | 0.14mi | 3/2.0 (-1) | 1,494 (-3%) | 2mo | $379,900 | $254 | 78 |
| 485 Fruitwood Dr | 0.02mi | 3/2.0 (-1) | 1,669 (+9%) | 1mo | $345,000 | $207 | 75 |
| 458 Arenosa St | 0.40mi | 3/2.0 (-1) | 1,509 (-2%) | 1mo | $427,500 | $283 | 68 |
| 3113 Arrowhead Trl | 0.61mi | 4/2.0 | 1,536 (0%) | 2mo | $405,000 | $264 | 66 |
| 453 Dodge St | 0.41mi | 3/2.0 (-1) | 1,452 (-6%) | 1mo | $450,000 | $310 | 62 |
| 3034 Red Pear Dr | 0.68mi | 3/2.0 (-1) | 1,555 (+1%) | 2mo | $390,000 | $251 | 56 |
| 426 Steven Creek St | 0.58mi | 3/2.0 (-1) | 1,440 (-6%) | 2mo | $424,000 | $294 | 52 |
| 425 Pear Ln | 0.56mi | 3/2.0 (-1) | 1,433 (-7%) | 2mo | $389,900 | $272 | 52 |
| 472 Tanager Ct | 0.36mi | 3/2.0 (-1) | 1,312 (-15%) | 1mo | $365,000 | $278 | 49 |
| 425 Alamo St | 0.65mi | 3/2.0 (-1) | 1,327 (-14%) | 1mo | $412,000 | $310 | 37 |
| 3089 Saddle Creek Pl | 0.68mi | 3/2.0 (-1) | 1,327 (-14%) | 1mo | $429,000 | $323 | 36 |
Match score weights: distance 35% · size 25% · config 20% · recency 20%. Top-matched comps best support the ARV.
Projected returns pro-forma
-3.0% appreciation · 3.2% rent growth · sell at horizon
- IRR
- -5.9%
- Equity multiple
- 0.78×
- Total profit
- $-12,440
- Equity at exit
- $30,268
- IRR
- 4.0%
- Equity multiple
- 1.30×
- Total profit
- $16,839
- Equity at exit
- $17,552
Cash invested: $56,840 (down + closing). Projections, not guarantees.
Landlord ↔ Tenant lean methodology
- Overall (STATE)
- 38 Tenant-Leaning
- State Colorado
- 38 Tenant-Leaning · D+4
- County
- — inherits STATE
- City
- — inherits STATE
ZIP-level market 81504
- Rents YoY
- 3.2%
- Active inventory
- 280
- Price-to-rent
- 7.8×
Monthly cashflow live
- Estimated rent
- $2,173 high interval (Pro) →
- Mortgage (P&I)
- −$1,065
- Tax est. 1.5%
- −$254 /mo · $3,045/yr
- Insurance
- −$85
- HOA
- −$0
- Vacancy / Maint / Mgmt
- −$456
- Net cashflow
- $314
Break-even live
UW: 25.0% down · 7.5% · 30yr · 1.5% tax · 5.0% vac · 8.0% maint · 8.0% mgmt
Financing live
Cash to close
- Down payment
- $50,750
- Closing costs
- $6,090
- Reserves months
- —
- Total cash needed
- —
Loan-product check · same deal, 3 products live
Conventional
25% down · 7.5% · 30yr
- Down + closing
- —
- Monthly P&I
- —
- Monthly cashflow
- —
- DSCR
- —
- Eligible?
- —
Personal DTI + credit; lowest rate.
DSCR
20% down · 8.5% · 30yr
- Down + closing
- —
- Monthly P&I
- —
- Monthly cashflow
- —
- DSCR
- —
- Eligible?
- —
No personal income docs; deal must DSCR.
Hard money
10% down · 12.0% · 12mo
- Down + closing
- —
- Monthly P&I
- —
- Monthly cashflow
- —
- DSCR
- —
- Eligible?
- —
Short-term bridge; refi at stabilization.
Rent comps 10 comps
| Address | Beds | Baths | Sqft | Rent | $/sqft | DOM | Units | Dist |
|---|---|---|---|---|---|---|---|---|
| 461 N Sun Ct Grand Junction, CO | 3.0 | 2.0 | 1200 | $1,780 | $1.48 | 21d | 1 | 0.33mi |
| 3005 Autumn Glenn Ct Grand Junction, CO | 4.0 | 2.0 | 1862 | $2,300 | $1.24 | 21d | 1 | 0.73mi |
| 3133 Meadow Ln Grand Junction, CO | 3.0 | 2.0 | 1255 | $2,000 | $1.59 | 21d | 1 | 0.91mi |
| 423 Brealyn Ct Unit B Grand Junction, CO | 3.0 | 2.5 | 1911 | $2,200 | $1.15 | 13d | 1 | 1.05mi |
| 423 Brealyn Ct Unit B Grand Junction, CO | 3.0 | 2.5 | 1911 | $2,200 | $1.15 | 21d | 1 | 1.05mi |
| 595 Starlight Dr Grand Junction, CO | 3.0 | 1.5 | 1622 | $2,215 | $1.37 | 13d | 1 | 1.16mi |
| 2967 Eastwood Pl Grand Junction, CO | 3.0 | 2.0 | 1614 | $1,500 | $0.93 | 13d | 1 | 1.24mi |
| 612 Round Table Rd Grand Junction, CO | 3.0 | 2.0 | 1238 | $1,750 | $1.41 | 13d | 1 | 1.26mi |
| 428 1/2 Keener St Grand Junction, CO | 3.0 | 2.0 | 1150 | $1,900 | $1.65 | 21d | 1 | 1.28mi |
| 2978 N Ronlin Ave Grand Junction, CO | 3.0 | 2.0 | 1478 | $2,095 | $1.42 | 21d | 1 | 1.33mi |
Listing history 8 events
-
2026-04-28status Pending
-
2026-04-23$203,000 Active
-
2021-10-21soldstatus $324,500 406-char remark
Show marketing remark (406 chars)
Freshly updated four bedroom home! You have to stop and see this one to appreciate it. The home has brand new beautiful LVT flooring, updated bathrooms, RV parking, a play set, storage shed, metal rough, and much more! You’ll love the oversized dining room for entertaining and sitting outside on your covered patio to enjoy your beautiful yard. Schedule your showing to see this beauty for yourself.
-
2021-07-30$340,000 406-char remark
Show marketing remark (406 chars)
Freshly updated four bedroom home! You have to stop and see this one to appreciate it. The home has brand new beautiful LVT flooring, updated bathrooms, RV parking, a play set, storage shed, metal rough, and much more! You’ll love the oversized dining room for entertaining and sitting outside on your covered patio to enjoy your beautiful yard. Schedule your showing to see this beauty for yourself.
-
2019-07-12soldstatus $212,400 392-char remark
Show marketing remark (392 chars)
You're going to fall in love with this 4 bed 2.5 bath home on lovely lot! Big shed and lots of RV parking behind gate! Covered patio for entertaining and extra space in the garage for all your storage needs! Great central location close to shopping. Homeowner has put in all new sod in the back yard, some newer paint interior, and a deep clean means this home is sparkling and ready for YOU!
-
2019-04-15$209,900 392-char remark
Show marketing remark (392 chars)
You're going to fall in love with this 4 bed 2.5 bath home on lovely lot! Big shed and lots of RV parking behind gate! Covered patio for entertaining and extra space in the garage for all your storage needs! Great central location close to shopping. Homeowner has put in all new sod in the back yard, some newer paint interior, and a deep clean means this home is sparkling and ready for YOU!
-
2017-01-16soldstatus $163,600
-
2015-09-23$159,900
ⓘ Source: listings_history table (triggers on properties + properties_extension) + one-shot
backfill from property_details.listing_events for pre-trigger history.
Climate risk First Street
- Flood 1/10 Low FEMA zone X (unshaded) · 0% chance over 30 yrs
- Wildfire 1/10 Low
- Heat 5/10 Major 7 d/yr ≥95°F today · 18 d/yr by 30 yrs out
- Wind 1/10 Low
- Air quality 2/10 Low 1 unhealthy d/yr today · 1 by 30 yrs out
Nearby sold comps map
Loading sold comps map…
Walkable amenities ~0.75 mi
Loading nearby amenities…
Taxation est. · year 1
- Rental income
- $26,076
- − Mortgage interest
- −$11,371
- − Property taxes
- −$3,045
- − Insurance
- −$1,015
- − Repairs & maintenance
- −$2,086
- − Management
- −$2,086
- − Depreciation
- −$5,905
- Taxable income
- $567
- Est. tax owed @ 24.0%
- −$136
- After-tax cash flow
- $3,629/yr
For passive investors: Depreciation is non-cash, so a rental often shows a tax loss while cash-flowing — sheltering income. Rental losses are passive: they offset passive income freely, and up to $25,000/yr can offset ordinary (W-2) income if you actively participate and your MAGI is under $100k (phasing out to $0 by $150k); unused losses carry forward. On sale, claimed depreciation is recaptured at up to 25%, and gains may owe capital-gains tax (a 1031 exchange can defer both). Figures are a year-1 estimate at your 24.0% rate — not tax advice; consult a CPA.
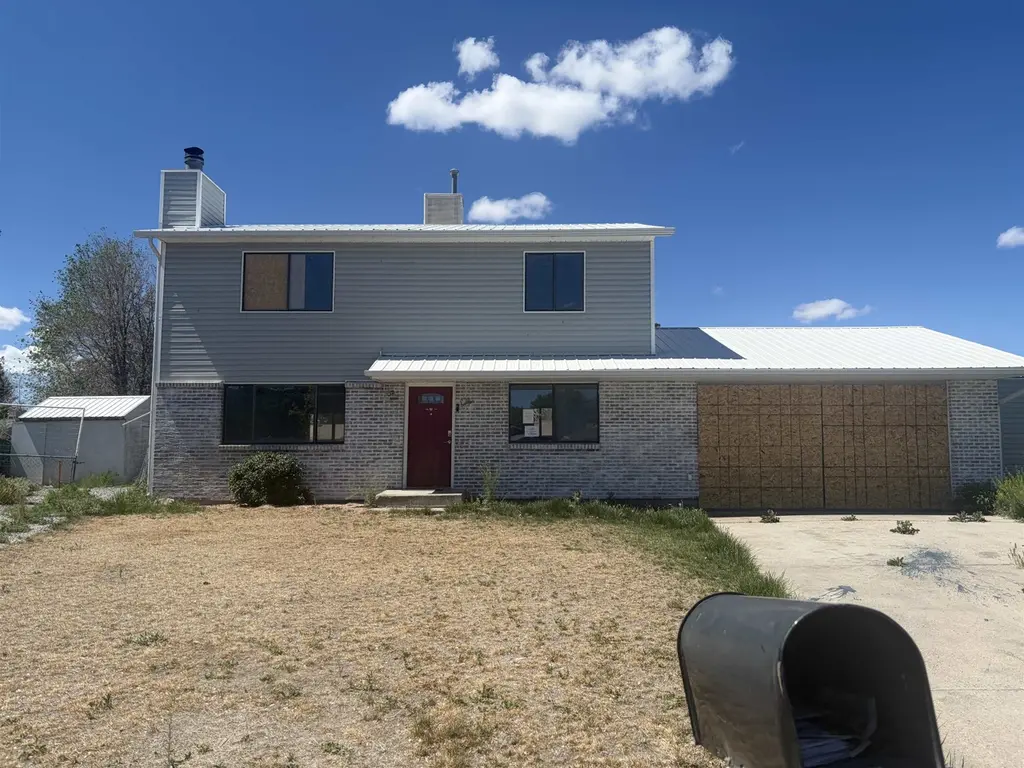
Condition & rehab AI · 1 photo
This home requires extensive repairs and rebuilding to be move-in ready. Significant investment is needed to improve its condition and increase its value.
Repairs flagged
- Major Exterior siding — Sections of siding are missing
- Major Metal roof — Rusted and weathered
- Major Windows — Damaged appearance
- Major Foundation — Exposed and in poor condition
Value-add opportunities
- Both Rebuild exterior siding — Improves both resale and rental value
- Both Replace metal roof — Improves both resale and rental value
- Both Repair or replace windows — Improves both resale and rental value
- Both Repair foundation — Improves both resale and rental value
Renovation cost estimate screening
| Repair item | Severity | Est. cost |
|---|---|---|
| Exterior siding · Sections of siding are missing | Major | $15,000–50,000 |
| Metal roof · Rusted and weathered | Major | $15,000–50,000 |
| Windows · Damaged appearance | Major | $15,000–50,000 |
| Foundation · Exposed and in poor condition | Major | $15,000–50,000 |
| Total estimated repair cost · 4 items | $60,000–200,000 |
Value-add ROI direction
- Both Rebuild exterior siding — Improves both resale and rental value ↑
- Both Replace metal roof — Improves both resale and rental value ↑
- Both Repair or replace windows — Improves both resale and rental value ↑
- Both Repair foundation — Improves both resale and rental value ↑
ⓘ Cost ranges are severity-bucket heuristics (US national rule-of-thumb). Get contractor quotes + a written scope before underwriting a rehab budget.
Schools (NCES district)
- District
- Mesa County Valley School District No. 51
- NCES district ID
- 0804350
- Math proficiency
- 26% ▲ 1.00%
- Reading proficiency
- 38% ▬ 0.00%
- Median HH income
- $50,189
- Composite
- 27.83/100
- National rank
- #6884
- State rank
- #43 of 86 in CO
Livability — Clifton
- Score
- 66/100
- State rank
- #140
- US rank
- #11665
Category grades
Schools grade is shown separately in the Schools card above.
Census & demographics
- Census place
- Clifton, CO
- County
- Mesa County · 143,088 people
- City population
- 12,892
- Metro
- Grand Junction, CO
- Population (ZIP)
- 32,376
- Household income
- $70,958
- Rent vs Own
- Severe rent burden
- 808.0
Population outlook (Mesa County) Hauer SSP2
- Today (2025)
- 153,000 people
- By 2030
- 154,479 · +1.0%
- By 2040
- 155,257 · +1.5%
- By 2050
- 153,384 · +0.3%
- By 2075
- 144,735 · -5.4%
- By 2100
- 123,825 · -19.1%
Race, ethnicity, and origin ACS 2023
- Neighborhood character
- Predominantly White (73%)
- Race & ethnicity
- White 73% Hispanic / Latino 21% Two or more races 18%
- Hispanic origin (detail)
- Mexican 13%
- Common ancestry
- Iranian 2% Slovak 2% Italian 2%
- Foreign-born
- 6% · Canada, Vietnam
- Languages at home
- 90% English-only · Spanish 8%
Political lean MEDSL · Mesa
- 2024 margin
- Strong R (+24.3) · D 36.6% · R 61.0% · Other 2.4%
- 2008→2024 swing
- +5.2pp toward D · 2008: -29.5pp · 2024: -24.3pp
- All cycles
- 2024: R+24.3 2020: R+28.0 2016: R+36.3 2012: R+32.8 2008: R+29.5
Not yet ingested
- Civics
- —
Market trends
- HPI YoY
- ▼ -345.40%
- Current HPI
- 309.0092
- Rent YoY
- ▲ 3.20%
- Metro
- Grand Junction, CO
- State GDP YoY
- ▲ 1.95%
- F500 in state
- 14
Industry mix (Fortune 500 HQ in CO)
| Industry | F500 HQs | Revenue |
|---|---|---|
| Technology Distribution | 1 | $31B |
|
||
| Food / Agriculture | 1 | $18B |
|
||
| Packaging | 1 | $14B |
|
||
| Healthcare | 1 | $13B |
|
||
| Energy | 1 | $10B |
|
||
| Technology | 1 | $4B |
|
||
Price history
+27.0% since first listed8 events — show timeline
- 2026-04-28 Pending — GJARA
- 2026-04-23 Listed $203,000 GJARA
- 2021-10-21 Sold (MLS) $324,500 GJARA
- 2021-07-30 Listed $340,000 GJARA
- 2019-07-12 Sold (MLS) $212,400 GJARA
- 2019-04-15 Listed $209,900 GJARA
- 2017-01-16 Sold (MLS) $163,600 GJARA
- 2015-09-23 Listed $159,900 GJARA
Cash-flow waterfall
monthlySold comps — $/sqft
last 12 mo · ≤1 miLoading sold comps…