19333 Green Valley Ct · North Fort Myers, FL
Flood risk No data
- FEMA flood zone
- —
- Chance of flooding over 30 yrs
- —
- Est. flood insurance / yr
- —
Fire risk No data
- Est. fire insurance / yr
- —
Heat risk No data
- Hot days now (above threshold)
- —
- Hot days in 30 yrs
- —
Wind risk No data
- Chance of severe wind over 30 yrs
- —
Air-quality risk No data
- Unhealthy air days now
- —
- Unhealthy air days in 30 yrs
- —
Risk factors via First Street. Map © Google.
Why this score? — see what drove the B grade
The composite is a weighted blend of 9 inputs, each scored 0–100. Each bar is that input's sub-score; the figure is the points it added to the 100-point composite (weight × sub-score).
- Cash flow +30.0/30.0
- 1% rule +10.0/10.0
- DSCR +10.0/10.0
- ARV discount +7.5/15.0
- Schools +4.1/10.0
- Condition / age +3.8/5.0
- Livability +3.7/5.0
- Rent growth +2.0/5.0
- Appreciation +0.0/10.0
$49,000
🖨 Deal sheet 📄 Offer letter ✓ Due diligence
Listing remarks
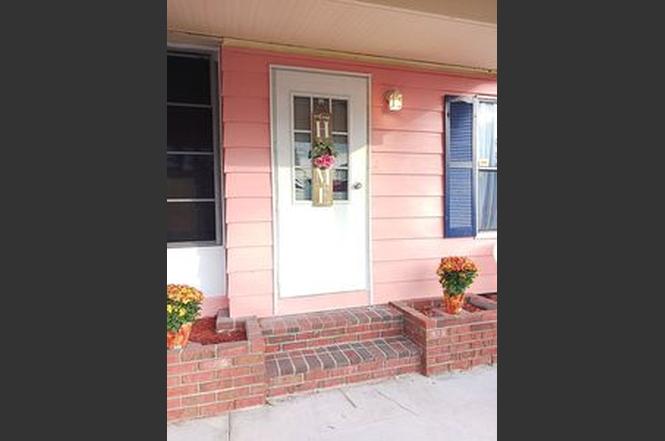
This is a beautiful 2/2 manufactured home in the golfing community of Lake Fairways which is for age 55 and up. It is on leased land and the current lot rent is $1,056 per month. When the house sells, the lot rent will go up. The sales office will determine the new lot rent. The community has many amenities such as an 18 hole golf course, pool, tennis courts, fitness center and bachi. The large club house is beautiful. The community is also pet friendly. This home has been extensively remodeled. There is a new roof with a 30 year guarantee from Vreeland Roofing. There is new laminate flooring throughout. Last year we turned the lanai into a hurricane proof, insulated bedroom with en suite b
Key facts
- En suite bathroom
- Laminate flooring
- 18 hole golf course
Tags
Property features AI
Exterior
- Home design: Single-family property; Located on Green Valley Court in North Fort Myers, FL
- Construction: Living area approximately 1,400
- Exterior features: Built in 1983
Interior
- Interior features: Located in the Jacarandas subdivision
Neighborhood map
What this means for you Summary
Snapshot
- This is a 2-bed/2.0-bath other listed at $49k. Condition is rated good.
Deal economics
- At list price, monthly cash flow is $1k ($14k/yr) — positive.
- The deal already cash-flows at list — no discount required.
- Meets the 1% rule at list price ($2k rent vs $49k).
- Cap rate 34.2% vs local median 3.6% in North Fort Myers — top-decile yield for the area; either an underpriced asset or a hidden risk that comps aren't pricing in. Stress-test before assuming the spread holds.
Location & tenants
- Location reads 74/100 on livability (#269 in FL, #4,409 nationally) — a middle-class / working-renter tenant base. Strengths: cost of living A+, housing A+, health & safety A+; Watch: employment C-, amenities F, commute F.
- Lee (suburban): math 47% / reading 50% proficiency, ranked #42 of 73 in FL (top 58%) — families likely to look elsewhere, expect single-tenant / working-renter base with shorter leases.
- Market conditions: Rents soft (-1.9%/yr); 472 active listings in the ZIP; 22 comparable units currently listed for rent nearby; rentals at typical pace (median 16d on market — plan ~3-4 weeks tenant-placement turnaround); 15,411 units permitted in Lee County in 2024 (4,686 in 5+ unit buildings).
- This rent runs 39% of the median local income ($57k/yr) — at the standard rent-burdened threshold; future hikes will face affordability resistance.
Forward outlook
- Local home prices are declining (-3.0%/yr); year-one equity from $339 of loan paydown is wiped out by about $1k of value loss. Plan a longer hold.
- Lee County population projected at +44% by 2050 — long-run rental-demand tailwind backs the buy-and-hold thesis.
- At projected returns (-3.0% appreciation + 0.0% rent growth), your $14k cash investment doubles in ~2 years — after that, you're playing with house money.
Negotiation context
- Only 8 days on market — expect competitive offers; lowballing is unlikely to land.
Questions for the listing agent
- Is there a deadline driving the sale (1031 exchange, divorce, estate, relocation)? That informs how much negotiation room exists.
- What's the average days-on-market for RENTAL listings here right now (not sales)? A rising rental-DOM trend means longer vacancies and softer asking-rent achievability than the comps imply.
- What's the recent tenant-quality profile in this submarket — average credit score on applications, eviction rate, late-payment / NSF rate, and stable-employment percentage? A property-management company in the area should have these aggregated.
- How much new for-sale + rental construction is in the pipeline within 1–3 miles? Heavy new supply typically softens prices + rents 12–24 months out; constrained supply supports both.
Investment metrics
- 1% rule
- 3.82% ✓
- Cap rate
- 34.23%
- Cash-on-cash
- 99.77%
- DSCR
- 5.44
- GRM
- 2.2
CMA / ARV
No comps found within radius.
Projected returns pro-forma
-3.0% appreciation · 0.0% rent growth · sell at horizon
- IRR
- 97.4%
- Equity multiple
- 5.32×
- Total profit
- $59,249
- Equity at exit
- $7,306
- IRR
- 99.5%
- Equity multiple
- 10.04×
- Total profit
- $124,047
- Equity at exit
- $4,237
Cash invested: $13,720 (down + closing). Projections, not guarantees.
Landlord ↔ Tenant lean methodology
- Overall (STATE)
- 87 Strongly Landlord-Friendly
- State Florida
- 87 Strongly Landlord-Friendly · R+3
- County
- — inherits STATE
- City
- — inherits STATE
ZIP-level market 33903
- Rents YoY
- -1.9%
- Active inventory
- 472
- Price-to-rent
- 2.2×
Monthly cashflow live
- Estimated rent
- $1,872 high interval (Pro) →
- Mortgage (P&I)
- −$257
- Tax est. 1.5%
- −$61 /mo · $735/yr
- Insurance
- −$20
- HOA
- −$0
- Vacancy / Maint / Mgmt
- −$393
- Net cashflow
- $1,141
Break-even live
UW: 25.0% down · 7.5% · 30yr · 1.5% tax · 5.0% vac · 8.0% maint · 8.0% mgmt
Financing live
Cash to close
- Down payment
- $12,250
- Closing costs
- $1,470
- Reserves months
- —
- Total cash needed
- —
Loan-product check · same deal, 3 products live
Conventional
25% down · 7.5% · 30yr
- Down + closing
- —
- Monthly P&I
- —
- Monthly cashflow
- —
- DSCR
- —
- Eligible?
- —
Personal DTI + credit; lowest rate.
DSCR
20% down · 8.5% · 30yr
- Down + closing
- —
- Monthly P&I
- —
- Monthly cashflow
- —
- DSCR
- —
- Eligible?
- —
No personal income docs; deal must DSCR.
Hard money
10% down · 12.0% · 12mo
- Down + closing
- —
- Monthly P&I
- —
- Monthly cashflow
- —
- DSCR
- —
- Eligible?
- —
Short-term bridge; refi at stabilization.
Rent comps 22 comps
| Address | Beds | Baths | Sqft | Rent | $/sqft | DOM | Units | Dist |
|---|---|---|---|---|---|---|---|---|
| 1701 NE 44th Ter Cape Coral, FL | 3.0 | 2.0 | 1147 | $1,800 | $1.57 | 13d | 1 | 0.33mi |
| 1701 NE 44th Ter Cape Coral, FL | 3.0 | 2.0 | 1147 | $1,800 | $1.57 | 15d | 1 | 0.33mi |
| 4421 NE 15th Pl Cape Coral, FL | 3.0 | 2.0 | 1240 | $2,000 | $1.61 | 23d | 1 | 0.39mi |
| 4215 E Gator Cir Cape Coral, FL | 3.0 | 2.0 | 1385 | $1,725 | $1.25 | 3d | 1 | 0.52mi |
| 19421 Bermuda Ct North Fort Myers, FL | 3.0 | 2.0 | 1198 | $1,499 | $1.25 | 1d | 1 | 0.55mi |
| 19477 Bermuda Ct North Fort Myers, FL | 3.0 | 2.0 | 1460 | $1,499 | $1.03 | 1d | 1 | 0.55mi |
| 19414 Bermuda Ct North Fort Myers, FL | 3.0 | 2.0 | 1251 | $1,499 | $1.20 | 1d | 1 | 0.56mi |
| 19152 Meadowbrook Ct North Fort Myers, FL | 3.0 | 2.0 | 1251 | $1,499 | $1.20 | 1d | 1 | 0.60mi |
| 4125 NE 15th Pl Cape Coral, FL | 3.0 | 2.0 | 1556 | $2,000 | $1.29 | 23d | 1 | 0.67mi |
| 10401 Circle Pine Rd North Fort Myers, FL | 2.0 | 2.0 | 1294 | $3,000 | $2.32 | 23d | 1 | 0.74mi |
| 19621 N Tamiami Trl North Fort Myers, FL | 3.0 | 2.0 | 1205 | $1,300 | $1.08 | 23d | 1 | 0.80mi |
| 2117 NE 40th St Cape Coral, FL | 3.0 | 3.0 | 1776 | $2,100 | $1.18 | 15d | 1 | 0.90mi |
| 4028 NE 10th Pl Cape Coral, FL | 3.0 | 2.0 | 1850 | $2,146 | $1.16 | 3d | 1 | 1.26mi |
| 4109 NE 9th Pl Cape Coral, FL | 3.0 | 2.0 | 1690 | $1,835 | $1.09 | 3d | 1 | 1.26mi |
| 4036 Avenue Del Tura North Fort Myers, FL | 2.0 | 2.0 | 1568 | $1,950 | $1.24 | 23d | 1 | 1.28mi |
| 3717 NE 13th Ave Cape Coral, FL | 3.0 | 2.0 | 1408 | $1,795 | $1.27 | 15d | 1 | 1.30mi |
| 3622 NE 19th Ave Cape Coral, FL | 3.0 | 2.0 | 1286 | $2,480 | $1.93 | 23d | 1 | 1.33mi |
| 3732 NE 12th Pl Cape Coral, FL | 3.0 | 2.0 | 1408 | $1,950 | $1.38 | 23d | 1 | 1.33mi |
| 20038 Fiddlewood Ave North Fort Myers, FL | 3.0 | 2.0 | 1519 | $1,999 | $1.32 | 19d | 1 | 1.34mi |
| 3603 NE 19th Ave Cape Coral, FL | 3.0 | 2.0 | 1147 | $1,750 | $1.53 | 3d | 1 | 1.40mi |
| 3527 NE 19th Pl Cape Coral, FL | 3.0 | 2.0 | 1574 | $2,000 | $1.27 | 23d | 1 | 1.42mi |
| 20056 Sweetbay Dr North Fort Myers, FL | 3.0 | 2.0 | 1672 | $4,000 | $2.39 | 23d | 1 | 1.50mi |
Listing history 5 events
-
2026-06-17days on market $49,000 Active 8 DOM
-
2026-06-16days on market $49,000 Active 7 DOM
-
2026-06-16days on market $49,000 Active 6 DOM
-
2026-06-13remarks 699-char remark
-
2026-06-13$49,000 Active 4 DOM
ⓘ Source: listings_history table (triggers on properties + properties_extension) + one-shot
backfill from property_details.listing_events for pre-trigger history.
Nearby sold comps map
Loading sold comps map…
Walkable amenities ~0.75 mi
Loading nearby amenities…
Taxation est. · year 1
- Rental income
- $22,470
- − Mortgage interest
- −$2,745
- − Property taxes
- −$735
- − Insurance
- −$245
- − Repairs & maintenance
- −$1,798
- − Management
- −$1,798
- − Depreciation
- −$1,425
- Taxable income
- $13,725
- Est. tax owed @ 24.0%
- −$3,294
- After-tax cash flow
- $10,394/yr
For passive investors: Depreciation is non-cash, so a rental often shows a tax loss while cash-flowing — sheltering income. Rental losses are passive: they offset passive income freely, and up to $25,000/yr can offset ordinary (W-2) income if you actively participate and your MAGI is under $100k (phasing out to $0 by $150k); unused losses carry forward. On sale, claimed depreciation is recaptured at up to 25%, and gains may owe capital-gains tax (a 1031 exchange can defer both). Figures are a year-1 estimate at your 24.0% rate — not tax advice; consult a CPA.
Condition & rehab AI · 2 photos
This 19333 Green Valley Ct is a well-maintained and recently remodeled manufactured home in a desirable community. It is in good condition with no visible repairs needed, making it a solid investment opportunity.
Value-add opportunities
- Both Painting the exterior — Fresh paint can enhance curb appeal and property value
- Both Landscaping improvements — Enhanced landscaping can increase both resale and rental value
Renovation cost estimate screening
Value-add ROI direction
- Both Painting the exterior — Fresh paint can enhance curb appeal and property value ↑
- Both Landscaping improvements — Enhanced landscaping can increase both resale and rental value ↑
ⓘ Cost ranges are severity-bucket heuristics (US national rule-of-thumb). Get contractor quotes + a written scope before underwriting a rehab budget.
Schools (NCES district)
- District
- Lee
- NCES district ID
- 1201080
- Math proficiency
- 47% ▼ -11.00%
- Reading proficiency
- 50% ▼ -4.00%
- Median HH income
- $49,518
- Composite
- 41.49/100
- National rank
- #3458
- State rank
- #42 of 73 in FL
Livability — North Fort Myers
- Score
- 74/100
- State rank
- #269
- US rank
- #4409
Category grades
Schools grade is shown separately in the Schools card above.
Census & demographics
- Census place
- North Fort Myers, FL
- County
- Lee County · 788,662 people
- City population
- 57,035
- Metro
- Cape Coral-Fort Myers, FL
- Population (ZIP)
- 23,655
- Household income
- $56,993
- Rent vs Own
- Severe rent burden
- 468.0
Population outlook (Lee County) Hauer SSP2
- Today (2025)
- 871,946 people
- By 2030
- 955,468 · +9.6%
- By 2040
- 1,113,587 · +27.7%
- By 2050
- 1,256,891 · +44.1%
- By 2075
- 1,560,270 · +78.9%
- By 2100
- 1,726,848 · +98.0%
Race, ethnicity, and origin ACS 2023
- Neighborhood character
- Predominantly White (81%)
- Race & ethnicity
- White 81% Hispanic / Latino 14% Two or more races 8% Black 2%
- Hispanic origin (detail)
- Mexican 3% Puerto Rican 3% Cuban 3%
- Common ancestry
- Lithuanian 4% Romanian 4% Italian 3%
- Foreign-born
- 11% · Canada
- Languages at home
- 88% English-only · Spanish 9% Other Indo-European 1%
Political lean MEDSL · Lee
- 2024 margin
- Strong R (+28.4) · D 35.5% · R 63.9%
- 2008→2024 swing
- -18.0pp toward R · 2008: -10.4pp · 2024: -28.4pp
- All cycles
- 2024: R+28.4 2020: R+19.2 2016: R+20.4 2012: R+16.6 2008: R+10.4
Not yet ingested
- Civics
- —
Market trends
- HPI YoY
- ▼ -172.26%
- Current HPI
- 256.773
- Rent YoY
- ▼ -1.94%
- Metro
- Cape Coral-Fort Myers, FL
- State GDP YoY
- ▲ 3.28%
- F500 in state
- 36
Industry mix (Fortune 500 HQ in FL)
| Industry | F500 HQs | Revenue |
|---|---|---|
| Industrial Technology | 2 | $29B |
|
||
| Insurance | 2 | $17B |
|
||
| Retail | 1 | $60B |
|
||
| Technology Distribution | 1 | $58B |
|
||
| Homebuilding | 1 | $35B |
|
||
| Technology Manufacturing | 1 | $35B |
|
||
Price history
1 event — show timeline
- 2026-06-09 Listed $49,000 FSBO.com
Cash-flow waterfall
monthlySold comps — $/sqft
last 12 mo · ≤1 miLoading sold comps…