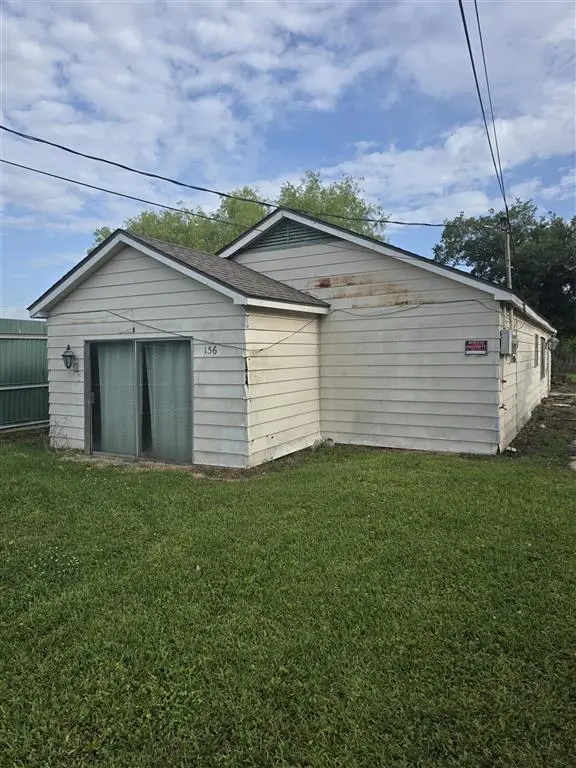
156 Starlin Dr · Sulphur, LA
Flood risk 6/10 · Moderate
- FEMA flood zone
- AE
- Chance of flooding over 30 yrs
- 0.71%
- Est. flood insurance / yr
- $1,737 – $8,500
Fire risk 3/10 · Minor
- Est. fire insurance / yr
- $1,269 – $2,357
Heat risk 9/10 · Severe
- Hot days now (above 109°F)
- 7 days/yr
- Hot days in 30 yrs
- 24 days/yr
Wind risk 9/10 · Severe
- Chance of severe wind over 30 yrs
- 99.0%
Air-quality risk 2/10 · Minimal
- Unhealthy air days now
- 1 days/yr
- Unhealthy air days in 30 yrs
- 1 days/yr
Risk factors via First Street. Map © Google.
Why this score? — see what drove the D+ grade
The composite is a weighted blend of 9 inputs, each scored 0–100. Each bar is that input's sub-score; the figure is the points it added to the 100-point composite (weight × sub-score).
- Cash flow +15.0/30.0
- ARV discount +7.5/15.0
- 1% rule +5.0/10.0
- DSCR +5.0/10.0
- Rent growth +4.4/5.0
- Livability +3.6/5.0
- Schools +3.1/10.0
- Condition / age +2.5/5.0
- Appreciation +0.0/10.0
$27,500
🖨 Deal sheet (PDF) 📄 Offer letter ✓ Due diligence
Listing remarks
Looking for a fixer upper? Flip this home and sell if for a profit or make it an investment property and start bringing in some income! Make an appointment & go check it out today! All measurements are more/less.
Key facts
- 0.25 acre lot
- Built 1976
- Listed 30 days
Property features AI
Finance
- Other: Directions: I-10 West to Sulphur, north on Ruth Street, right on Starlin Drive — house will be on the left; Listing broker: eXp Realty, LLC
Exterior
- Utilities: Public water; Public sewer; Electricity available; Natural gas available; Cable available; Phone available
- Home design: Single-family house; Single-story
- Exterior features: Front yard; Back yard; City lot; Lot dimensions approximately 54 x 204; Lot about 0.25 acres
Interior
- Bathrooms: 1 full bathroom
- Heating & cooling: No central heating; Wall/window air conditioning unit(s)
- Interior features: No fireplace; Ceiling fan(s)
Neighborhood map
What this means for you Summary
Snapshot
- This is a 2-bed/1.0-bath single-family listed at $28k.
Deal economics
- At list price, monthly cash flow is $689 ($8k/yr) — positive.
- The deal already cash-flows at list — no discount required.
- Meets the 1% rule at list price ($2k rent vs $28k).
- Recommended offer: $27k (3.0% below list) — sets the bar for market timing.
- Cap rate 55.0% vs local median 8.8% in Sulphur — top-decile yield for the area; either an underpriced asset or a hidden risk that comps aren't pricing in. Stress-test before assuming the spread holds.
Location & tenants
- Location reads 71/100 on livability (#48 in LA) — a middle-class / working-renter tenant base. Strengths: cost of living A+, housing A+, schools A; Watch: crime D-, amenities F, commute F.
- Calcasieu Parish (other): math 30% / reading 44% proficiency, ranked #29 of 98 in LA (top 30%) — families likely to look elsewhere, expect single-tenant / working-renter base with shorter leases.
- Market conditions: Rents rising fast (+7.7%/yr); 294 active listings in the ZIP; 2 comparable units currently listed for rent nearby; 1,298 units permitted in Calcasieu Parish in 2024 (526 in 5+ unit buildings).
- This rent runs 31% of the median local income ($65k/yr) — at the standard rent-burdened threshold; future hikes will face affordability resistance.
Forward outlook
- Local home prices are declining (-3.0%/yr); year-one equity from $190 of loan paydown is wiped out by about $825 of value loss. Plan a longer hold.
- Calcasieu County population projected at +11% by 2050 — modest demand growth; plan on rents tracking national, not racing it.
- At projected returns (-3.0% appreciation + 7.7% rent growth), your $8k cash investment doubles in ~2 years — after that, you're playing with house money.
Negotiation context
- It's been on market 31 days — a 3% lower offer ($27k) is reasonable based on typical stale-listing flexibility.
Risks & watch-outs
- Watch-outs: flood insurance adds $427/mo.
- Climate carrying-cost: in FEMA flood zone AE (mandatory federal flood insurance); severe wind risk, 99% chance of damaging wind over 30y; extreme-heat days projected 7→24/yr by 2055 (HVAC capex compounding) — expect insurance premiums to compound above CPI over the hold.
Questions for the listing agent
- It's been on market 31 days. Have you received any prior offers? Is the seller open to a 3% concession, seller financing, or rate buy-down credit?
- Built in 1976 — when were the roof, HVAC, electrical panel, plumbing, and water heater last replaced?
- What's the actual annual flood-insurance premium (NFIP or private), and is the property in a SFHA with mandatory coverage?
- Is there a deadline driving the sale (1031 exchange, divorce, estate, relocation)? That informs how much negotiation room exists.
- Schools are A-rated — typically a magnet for longer-tenancy family renters. What's the average tenant stay here, and is there a school-zone premium baked into asking?
- Crime grade is D in this area — have there been break-ins, vandalism, or insurance claims at this property in the last 3 years? What carrier currently insures it and at what premium?
- The area grade is low — what's the realistic commute time and amenity access for the typical tenant pool here? Any planned neighborhood developments (good or bad) we should know about?
- What's the average days-on-market for RENTAL listings here right now (not sales)? A rising rental-DOM trend means longer vacancies and softer asking-rent achievability than the comps imply.
- What's the recent tenant-quality profile in this submarket — average credit score on applications, eviction rate, late-payment / NSF rate, and stable-employment percentage? A property-management company in the area should have these aggregated.
- How much new for-sale + rental construction is in the pipeline within 1–3 miles? Heavy new supply typically softens prices + rents 12–24 months out; constrained supply supports both.
Investment metrics
- 1% rule
- 6.00% ✓
- Cap rate
- 54.97%
- Cash-on-cash
- 173.85%
- DSCR
- 8.74
- GRM
- 1.4
CMA / ARV
- ARV (on-the-fly)
- $148,200
- Comps found
- 12
Show comp detail 12 sales within ~0.75 mi
| Address | Dist | Beds/Ba | Sqft | Sold | Price | $/sf | Match |
|---|---|---|---|---|---|---|---|
| 701 Ginger St | 0.35mi | 3/1.0 (+1) | 1,300 (0%) | 10mo | $155,000 | $119 | 71 |
| 719 Landry St | 0.47mi | 3/1.0 (+1) | 1,253 (-4%) | 2mo | $104,000 | $83 | 65 |
| 740 Starlin Dr | 0.45mi | 3/1.0 (+1) | 1,340 (+3%) | 7mo | $155,000 | $116 | 63 |
| 1807 Drost St | 0.51mi | 3/2.0 (+1) | 1,338 (+3%) | 1mo | $129,900 | $97 | 62 |
| 405 Leland St | 0.32mi | 3/2.0 (+1) | 1,436 (+10%) | 2mo | $160,000 | $111 | 57 |
| 506 Hickok St | 0.66mi | 3/1.0 (+1) | 1,250 (-4%) | 5mo | $144,900 | $116 | 54 |
| 505 Custer St | 0.59mi | 3/1.0 (+1) | 1,406 (+8%) | 2mo | $85,000 | $60 | 52 |
| 2506 Thomason St St | 0.56mi | 3/1.5 (+1) | 1,201 (-8%) | 2mo | $124,900 | $104 | 52 |
| 620 Starlin Dr | 0.37mi | 3/2.0 (+1) | 1,453 (+12%) | 10mo | $165,000 | $114 | 46 |
| 544 Patton St | 0.68mi | 3/2.0 (+1) | 1,400 (+8%) | 1mo | $115,000 | $82 | 46 |
| 1318 Melanie Dr | 0.73mi | 3/2.0 (+1) | 1,365 (+5%) | 10mo | $170,000 | $125 | 40 |
| 1102 Bernadette Dr | 0.57mi | 3/2.0 (+1) | 1,479 (+14%) | 8mo | $180,000 | $122 | 35 |
Match score weights: distance 35% · size 25% · config 20% · recency 20%. Top-matched comps best support the ARV.
Projected returns pro-forma
-3.0% appreciation · 7.65% rent growth · sell at horizon
- IRR
- —
- Equity multiple
- 7.21×
- Total profit
- $47,794
- Equity at exit
- $4,100
- IRR
- —
- Equity multiple
- 18.64×
- Total profit
- $135,801
- Equity at exit
- $2,378
Cash invested: $7,700 (down + closing). Projections, not guarantees.
Landlord ↔ Tenant lean methodology
- Overall (STATE)
- 90 Strongly Landlord-Friendly
- State Louisiana
- 90 Strongly Landlord-Friendly · R+12
- County
- — inherits STATE
- City
- — inherits STATE
ZIP-level market 70663
- Rents YoY
- 7.7%
- Active inventory
- 294
- Price-to-rent
- 1.4×
Monthly cashflow live
- Estimated rent
- $1,650 medium interval (Pro) →
- Mortgage (P&I)
- −$144
- Tax from tax record
- −$32 /mo · $389/yr
- Insurance
- −$11
- Flood insurance flood zone
- −$427 /mo · $5,118/yr
- HOA
- −$0
- Vacancy / Maint / Mgmt
- −$347
- Net cashflow
- $689
Break-even live
Sensitivity live
| Price | -10% $705 | -5% $697 | +0% $689 | +5% $681 | +10% $673 |
|---|---|---|---|---|---|
| Rent | -10% $559 | -5% $624 | +0% $689 | +5% $754 | +10% $819 |
| Rate | -1.0pp $703 | -0.5pp $696 | base $689 | +0.5pp $682 | +1.0pp $675 |
UW: 25.0% down · 7.5% · 30yr · 1.5% tax · 5.0% vac · 8.0% maint · 8.0% mgmt
Financing live
Cash to close
- Down payment
- $6,875
- Closing costs
- $825
- Reserves months
- —
- Total cash needed
- —
Loan-product check · same deal, 3 products live
Conventional
25% down · 7.5% · 30yr
- Down + closing
- —
- Monthly P&I
- —
- Monthly cashflow
- —
- DSCR
- —
- Eligible?
- —
Personal DTI + credit; lowest rate.
DSCR
20% down · 8.5% · 30yr
- Down + closing
- —
- Monthly P&I
- —
- Monthly cashflow
- —
- DSCR
- —
- Eligible?
- —
No personal income docs; deal must DSCR.
Hard money
10% down · 12.0% · 12mo
- Down + closing
- —
- Monthly P&I
- —
- Monthly cashflow
- —
- DSCR
- —
- Eligible?
- —
Short-term bridge; refi at stabilization.
Rent comps 2 comps
| Address | Beds | Baths | Sqft | Rent | $/sqft | DOM | Units | Dist |
|---|---|---|---|---|---|---|---|---|
| 1917 Linda Ave Sulphur, LA | 3.0 | 2.0 | 1288 | $1,890 | $1.47 | 45d | 1 | 1.18mi |
| 2310 Timberlane Dr Sulphur, LA | 2.0 | 2.0 | 1350 | $2,450 | $1.81 | 45d | 1 | 1.49mi |
Listing history 18 events
-
2026-06-21days on market $27,500 Active 31 DOM
-
2026-06-19days on market $27,500 Active 29 DOM
-
2026-06-18days on market $27,500 Active 28 DOM
-
2026-06-17days on market $27,500 Active 27 DOM
-
2026-06-16days on market $27,500 Active 26 DOM
-
2026-06-15days on market $27,500 Active 25 DOM
-
2026-06-14days on market $27,500 Active 23 DOM
-
2026-06-13pricedays on market $27,500 Active 22 DOM
-
2026-06-10days on market $32,500 Active 20 DOM
-
2026-06-09days on market $32,500 Active 19 DOM
-
2026-06-08days on market $32,500 Active 18 DOM
-
2026-06-07days on market $32,500 Active 17 DOM
-
2026-06-05days on market $32,500 Active 14 DOM
-
2026-06-02days on market $32,500 Active 12 DOM
-
2026-06-01days on market $32,500 Active 11 DOM
-
2026-05-31days on market $32,500 Active 10 DOM
-
2026-05-30days on market $32,500 Active 9 DOM
-
2026-05-21$32,500 Active
ⓘ Source: listings_history table (triggers on properties + properties_extension) + one-shot
backfill from property_details.listing_events for pre-trigger history.
Tax reassessment forecast LA · Resets to sale price
- Current annual tax
- $389 · $32/mo
- Projected year-2 tax
- $389 · $32/mo
- Expected delta
- $0/yr ($0/mo · 0.0%)
ⓘ Screening estimate from a state-policy table — verify with the county assessor before closing.
Climate risk First Street
- Flood 6/10 Major FEMA zone AE · 71% chance over 30 yrs
- Wildfire 3/10 Moderate
- Heat 9/10 Extreme 7 d/yr ≥109°F today · 24 d/yr by 30 yrs out
- Wind 9/10 Extreme 99% chance of damaging wind over 30 yrs
- Air quality 2/10 Low 1 unhealthy d/yr today · 1 by 30 yrs out
Nearby sold comps map
Loading sold comps map…
Walkable amenities ~0.75 mi
Loading nearby amenities…
Taxation est. · year 1
- Rental income
- $19,802
- − Mortgage interest
- −$1,540
- − Property taxes
- −$389
- − Insurance
- −$5,256
- − Repairs & maintenance
- −$1,584
- − Management
- −$1,584
- − Depreciation
- −$800
- Taxable income
- $8,648
- Est. tax owed @ 24.0%
- −$2,076
- After-tax cash flow
- $6,192/yr
For passive investors: Depreciation is non-cash, so a rental often shows a tax loss while cash-flowing — sheltering income. Rental losses are passive: they offset passive income freely, and up to $25,000/yr can offset ordinary (W-2) income if you actively participate and your MAGI is under $100k (phasing out to $0 by $150k); unused losses carry forward. On sale, claimed depreciation is recaptured at up to 25%, and gains may owe capital-gains tax (a 1031 exchange can defer both). Figures are a year-1 estimate at your 24.0% rate — not tax advice; consult a CPA.
Schools (NCES district)
- District
- Calcasieu Parish
- NCES district ID
- 2200330
- Math proficiency
- 30% ▼ -39.00%
- Reading proficiency
- 44% ▼ -33.00%
- Median HH income
- $44,700
- Composite
- 31.45/100
- National rank
- #5979
- State rank
- #29 of 98 in LA
Livability — Sulphur
- Score
- 71/100
- State rank
- #48
- US rank
- #7164
Category grades
Schools grade is shown separately in the Schools card above.
Census & demographics
- Census place
- Sulphur, LA
- County
- Calcasieu Parish · 170,889 people
- City population
- 27,799
- Metro
- Lake Charles, LA
- Population (ZIP)
- 27,799
- Household income
- $64,707
- Rent vs Own
- Severe rent burden
- 197.0
Population outlook (Calcasieu County) Hauer SSP2
- Today (2025)
- 212,179 people
- By 2030
- 218,199 · +2.8%
- By 2040
- 228,486 · +7.7%
- By 2050
- 236,208 · +11.3%
- By 2075
- 251,696 · +18.6%
- By 2100
- 247,848 · +16.8%
Race, ethnicity, and origin ACS 2023
- Neighborhood character
- Predominantly White (82%)
- Race & ethnicity
- White 82% Black 8% Hispanic / Latino 5% Two or more races 4%
- Common ancestry
- Lithuanian 13% Slovak 2% Scandinavian 1%
- Foreign-born
- 3% · Canada, Vietnam
- Languages at home
- 94% English-only · Spanish 2% French/Haitian/Cajun 2% Other Indo-European 1%
Political lean MEDSL · Calcasieu
- 2024 margin
- Solid R (+39.6) · D 29.5% · R 69.0% · Other 1.5%
- 2008→2024 swing
- -15.0pp toward R · 2008: -24.6pp · 2024: -39.6pp
- All cycles
- 2024: R+39.6 2020: R+35.2 2016: R+33.3 2012: R+28.7 2008: R+24.6
Not yet ingested
- Civics
- —
Market trends
- HPI YoY
- ▼ -104.29%
- Current HPI
- 100.0895
- Rent YoY
- ▲ 7.65%
- Metro
- Lake Charles, LA
- State GDP YoY
- ▲ 3.29%
- F500 in state
- 10
Industry mix (Fortune 500 HQ in LA)
| Industry | F500 HQs | Revenue |
|---|---|---|
| Telecommunications | 2 | $23B |
|
||
| Utilities | 1 | $12B |
|
||
| Wholesale / Distribution | 1 | $5B |
|
||
| Advertising | 1 | $2B |
|
||
Price history
1 event — show timeline
- 2026-05-21 Listed $32,500 SWLAR
Property tax history
-0.6%/yrLatest (2025): $389 · +0.8% YoY. Source: county tax records.
Cash-flow waterfall
monthlySold comps — $/sqft
last 12 mo · ≤1 miLoading sold comps…