3701 Davis Rd · Moss Bluff, LA
Flood risk No data
- FEMA flood zone
- —
- Chance of flooding over 30 yrs
- —
- Est. flood insurance / yr
- —
Fire risk No data
- Est. fire insurance / yr
- —
Heat risk No data
- Hot days now (above threshold)
- —
- Hot days in 30 yrs
- —
Wind risk No data
- Chance of severe wind over 30 yrs
- —
Air-quality risk No data
- Unhealthy air days now
- —
- Unhealthy air days in 30 yrs
- —
Risk factors via First Street. Map © Google.
Why this score? — see what drove the D- grade
The composite is a weighted blend of 9 inputs, each scored 0–100. Each bar is that input's sub-score; the figure is the points it added to the 100-point composite (weight × sub-score).
- Cash flow +12.9/30.0
- DSCR +3.9/10.0
- ARV discount +3.6/15.0
- Livability +3.6/5.0
- 1% rule +3.2/10.0
- Schools +3.1/10.0
- Rent growth +2.5/5.0
- Condition / age +2.5/5.0
- Appreciation +0.0/10.0
$255,000
🖨 Deal sheet (PDF) 📄 Offer letter ✓ Due diligence
Listing remarks MLS
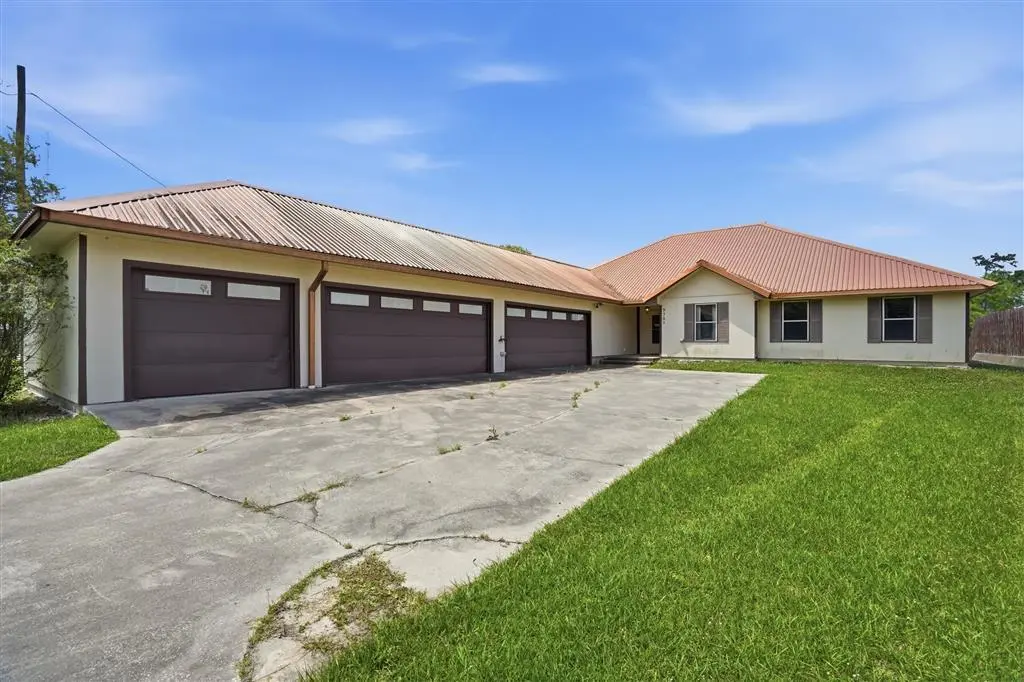
Waterfront living at its best! Situated on a canal with access to the West Fork of the Calcasieu River, this amazingly well kept 4-bedroom, 2-bath home offers the perfect blend of comfort and functionality. The open living area is filled with natural light and flows effortlessly to a large screened-in porch—ideal for relaxing or entertaining while enjoying peaceful water views. Outside, you’ll also find a fish cleaning station, making this home perfect for those who love life on the water. The kitchen features custom copper accents, while the spacious primary suite includes porch access, a soaking tub, separate shower, dual vanities, and two closets. Additional highlights include 36” doorways, gas connections inside and out, and a 5-car garage with a concrete ramp and hot/cold water hookups. Located in Flood Zone AE with transferable flood insurance currently around $1,120/year. Connected to community sewer ($160 quarterly). Enjoy everyday waterfront living and relaxing days on the porch. all measurements are more or less.
Key facts
- Soaking tub
- Waterfront living
- Canal access
Tags
Neighborhood map
What this means for you Summary
Snapshot
- This is a 4-bed/2.0-bath single-family listed at $255k.
Deal economics
- At list price, monthly cash flow is $-19 ($-226/yr) — negative.
- To cash-flow at today's rent, offer at most $252k (1.3% below list).
- To meet the 1% rule (rent ≥ 1% of price), the offer needs to be $210k (17.6% below list).
- Recommended offer: $210k (17.6% below list) — sets the bar for 1% rule.
- Cap rate 6.2% vs local median 3.5% in Moss Bluff — top-decile yield for the area; either an underpriced asset or a hidden risk that comps aren't pricing in. Stress-test before assuming the spread holds.
Location & tenants
- Location reads 72/100 on livability (#39 in LA) — a middle-class / working-renter tenant base. Strengths: cost of living A+, housing A+, employment A; Watch: amenities F, commute F.
- Calcasieu Parish (other): math 30% / reading 44% proficiency, ranked #29 of 98 in LA (top 30%) — families likely to look elsewhere, expect single-tenant / working-renter base with shorter leases.
- Zoned schools: Westwood Elementary School (411 students, 62% FRL); S. P. Arnett Middle School (math 25% / reading 51%, grade F, #73 of 218 statewide, top 34%, 370 students, 55% FRL); Westlake High School (math 37% / reading 42%, grade F, #80 of 265 statewide, top 32%, 529 students, 44% FRL) — zoned schools at 53% FRL track the district average.
- Market conditions: 148 active listings in the ZIP; 1 comparable units currently listed for rent nearby; 1,298 units permitted in Calcasieu Parish in 2024 (526 in 5+ unit buildings).
- This rent runs 36% of the median local income ($69k/yr) — at the standard rent-burdened threshold; future hikes will face affordability resistance.
Forward outlook
- Local home prices are declining (-3.0%/yr); year-one equity from $2k of loan paydown is wiped out by about $8k of value loss. Plan a longer hold.
- Calcasieu County population projected at +11% by 2050 — modest demand growth; plan on rents tracking national, not racing it.
Negotiation context
- It's been on market 68 days — a 6% lower offer ($240k) is reasonable based on typical stale-listing flexibility.
Questions for the listing agent
- What do current leases actually rent for vs. the listed asking? Can we see a recent rent roll and the last 12 months of T-12 income?
- It's been on market 68 days. Have you received any prior offers? Is the seller open to a 18% concession, seller financing, or rate buy-down credit?
- Why hasn't it sold? Are there any deal-killer items the seller is aware of (foundation, flood, title, zoning, code violations)?
- Is there a deadline driving the sale (1031 exchange, divorce, estate, relocation)? That informs how much negotiation room exists.
- Schools are D-rated, which usually means shorter tenancies and higher turnover. Who's the typical renter profile here, and what's been the actual vacancy rate?
- The area grade is low — what's the realistic commute time and amenity access for the typical tenant pool here? Any planned neighborhood developments (good or bad) we should know about?
- What's the average days-on-market for RENTAL listings here right now (not sales)? A rising rental-DOM trend means longer vacancies and softer asking-rent achievability than the comps imply.
- What's the recent tenant-quality profile in this submarket — average credit score on applications, eviction rate, late-payment / NSF rate, and stable-employment percentage? A property-management company in the area should have these aggregated.
- How much new for-sale + rental construction is in the pipeline within 1–3 miles? Heavy new supply typically softens prices + rents 12–24 months out; constrained supply supports both.
Investment metrics
- 1% rule
- 0.82% ✗
- Cap rate
- 6.20%
- Cash-on-cash
- -0.32%
- DSCR
- 0.99
- GRM
- 10.1
CMA / ARV
- ARV (median comp)
- $234,587
- List price
- $255,000
- Delta
- 8.70%
- Verdict
- FAIR
- Comps
- 19 within 1.0 mi
Show comp detail 6 sales within ~0.75 mi
| Address | Dist | Beds/Ba | Sqft | Sold | Price | $/sf | Match |
|---|---|---|---|---|---|---|---|
| 112 Villa Dr | 0.11mi | 3/3.0 (-1) | 2,303 (+10%) | 2mo | $430,000 | $187 | 67 |
| 570 Ann Terrace Ave | 0.60mi | 4/1.5 | 1,913 (-8%) | 5mo | $45,000 | $24 | 52 |
| 128 Villa Dr | 0.09mi | 4/3.5 | 2,350 (+12%) | 23mo | $405,000 | $172 | 50 |
| 3401 Davis Rd | 0.56mi | 3/2.0 (-1) | 1,988 (-5%) | 21mo | $185,000 | $93 | 43 |
| 358 Ann Terrace Ave | 0.70mi | 4/2.0 | 1,825 (-13%) | 13mo | $255,000 | $140 | 35 |
| 3148 Jerrie Ave | 0.69mi | 3/2.0 (-1) | 1,815 (-13%) | 13mo | $222,200 | $122 | 30 |
Match score weights: distance 35% · size 25% · config 20% · recency 20%. Top-matched comps best support the ARV.
Projected returns pro-forma
-3.0% appreciation · 3.0% rent growth · sell at horizon
- IRR
- -16.8%
- Equity multiple
- 0.40×
- Total profit
- $-42,538
- Equity at exit
- $38,021
- IRR
- -8.7%
- Equity multiple
- 0.46×
- Total profit
- $-38,665
- Equity at exit
- $22,048
Cash invested: $71,400 (down + closing). Projections, not guarantees.
Landlord ↔ Tenant lean methodology
- Overall (STATE)
- 90 Strongly Landlord-Friendly
- State Louisiana
- 90 Strongly Landlord-Friendly · R+12
- County
- — inherits STATE
- City
- — inherits STATE
ZIP-level market 70669
- Active inventory
- 148
- Price-to-rent
- 10.1×
Monthly cashflow live
- Estimated rent
- $2,100 medium interval (Pro) →
- Mortgage (P&I)
- −$1,337
- Tax from tax record
- −$234 /mo · $2,812/yr
- Insurance
- −$106
- HOA
- −$0
- Vacancy / Maint / Mgmt
- −$441
- Net cashflow
- $-19
Break-even live
Sensitivity live
| Price | -10% $126 | -5% $53 | +0% $-19 | +5% $-91 | +10% $-163 |
|---|---|---|---|---|---|
| Rent | -10% $-185 | -5% $-102 | +0% $-19 | +5% $64 | +10% $147 |
| Rate | -1.0pp $110 | -0.5pp $46 | base $-19 | +0.5pp $-85 | +1.0pp $-152 |
UW: 25.0% down · 7.5% · 30yr · 1.5% tax · 5.0% vac · 8.0% maint · 8.0% mgmt
Financing live
Cash to close
- Down payment
- $63,750
- Closing costs
- $7,650
- Reserves months
- —
- Total cash needed
- —
Loan-product check · same deal, 3 products live
Conventional
25% down · 7.5% · 30yr
- Down + closing
- —
- Monthly P&I
- —
- Monthly cashflow
- —
- DSCR
- —
- Eligible?
- —
Personal DTI + credit; lowest rate.
DSCR
20% down · 8.5% · 30yr
- Down + closing
- —
- Monthly P&I
- —
- Monthly cashflow
- —
- DSCR
- —
- Eligible?
- —
No personal income docs; deal must DSCR.
Hard money
10% down · 12.0% · 12mo
- Down + closing
- —
- Monthly P&I
- —
- Monthly cashflow
- —
- DSCR
- —
- Eligible?
- —
Short-term bridge; refi at stabilization.
Rent comps 1 comps
| Address | Beds | Baths | Sqft | Rent | $/sqft | DOM | Units | Dist |
|---|---|---|---|---|---|---|---|---|
| 3855 River Rd Westlake, LA | 3.0 | 2.0 | 1585 | $2,300 | $1.45 | 22d | 1 | 1.08mi |
Listing history 18 events
-
2026-06-21days on market $255,000 Active 68 DOM
-
2026-06-19days on market $255,000 Active 66 DOM
-
2026-06-18days on market $255,000 Active 65 DOM
-
2026-06-17days on market $255,000 Active 64 DOM
-
2026-06-16days on market $255,000 Active 63 DOM
-
2026-06-15days on market $255,000 Active 62 DOM
-
2026-06-14days on market $255,000 Active 60 DOM
-
2026-06-13days on market $255,000 Active 59 DOM
-
2026-06-10days on market $255,000 Active 57 DOM
-
2026-06-09days on market $255,000 Active 56 DOM
-
2026-06-08days on market $255,000 Active 55 DOM
-
2026-06-07days on market $255,000 Active 54 DOM
-
2026-06-05days on market $255,000 Active 51 DOM
-
2026-06-02days on market $255,000 Active 49 DOM
-
2026-06-01days on market $255,000 Active 48 DOM
-
2026-05-31days on market $255,000 Active 47 DOM
-
2026-05-30days on market $255,000 Active 46 DOM
-
2026-04-15$255,000 Active 1056-char remark
Show marketing remark (1056 chars)
Waterfront living at its best! Situated on a canal with access to the West Fork of the Calcasieu River, this amazingly well kept 4-bedroom, 2-bath home offers the perfect blend of comfort and functionality. The open living area is filled with natural light and flows effortlessly to a large screened-in porch—ideal for relaxing or entertaining while enjoying peaceful water views. Outside, you’ll also find a fish cleaning station, making this home perfect for those who love life on the water. The kitchen features custom copper accents, while the spacious primary suite includes porch access, a soaking tub, separate shower, dual vanities, and two closets. Additional highlights include 36” doorways, gas connections inside and out, and a 5-car garage with a concrete ramp and hot/cold water hookups. Located in Flood Zone AE with transferable flood insurance currently around $1,120/year. Connected to community sewer ($160 quarterly). Enjoy everyday waterfront living and relaxing days on the porch. all measurements are more or less.
ⓘ Source: listings_history table (triggers on properties + properties_extension) + one-shot
backfill from property_details.listing_events for pre-trigger history.
Tax reassessment forecast LA · Resets to sale price
- Current annual tax
- $2,812 · $234/mo
- Projected year-2 tax
- $2,812 · $234/mo
- Expected delta
- $0/yr ($0/mo · 0.0%)
ⓘ Screening estimate from a state-policy table — verify with the county assessor before closing.
Nearby sold comps map
Loading sold comps map…
Walkable amenities ~0.75 mi
Loading nearby amenities…
Taxation est. · year 1
- Rental income
- $25,200
- − Mortgage interest
- −$14,284
- − Property taxes
- −$2,812
- − Insurance
- −$1,275
- − Repairs & maintenance
- −$2,016
- − Management
- −$2,016
- − Depreciation
- −$7,418
- Taxable loss
- −$4,621
- Est. tax savings @ 24.0%
- +$1,109
- After-tax cash flow
- $883/yr
For passive investors: Depreciation is non-cash, so a rental often shows a tax loss while cash-flowing — sheltering income. Rental losses are passive: they offset passive income freely, and up to $25,000/yr can offset ordinary (W-2) income if you actively participate and your MAGI is under $100k (phasing out to $0 by $150k); unused losses carry forward. On sale, claimed depreciation is recaptured at up to 25%, and gains may owe capital-gains tax (a 1031 exchange can defer both). Figures are a year-1 estimate at your 24.0% rate — not tax advice; consult a CPA.
Schools (NCES district)
- District
- Calcasieu Parish
- NCES district ID
- 2200330
- Math proficiency
- 30% ▼ -39.00%
- Reading proficiency
- 44% ▼ -33.00%
- Median HH income
- $44,700
- Composite
- 31.45/100
- National rank
- #5979
- State rank
- #29 of 98 in LA
Livability — Moss Bluff
- Score
- 72/100
- State rank
- #39
- US rank
- #6117
Category grades
Schools grade is shown separately in the Schools card above.
Census & demographics
- County
- Calcasieu Parish · 170,889 people
- Metro
- Lake Charles, LA
- Population (ZIP)
- 9,552
- Household income
- $69,106
- Rent vs Own
- Severe rent burden
- 178.0
Population outlook (Calcasieu County) Hauer SSP2
- Today (2025)
- 212,179 people
- By 2030
- 218,199 · +2.8%
- By 2040
- 228,486 · +7.7%
- By 2050
- 236,208 · +11.3%
- By 2075
- 251,696 · +18.6%
- By 2100
- 247,848 · +16.8%
Race, ethnicity, and origin ACS 2023
- Neighborhood character
- Predominantly White (82%)
- Race & ethnicity
- White 82% Black 9% Two or more races 4% Hispanic / Latino 4% Asian 3%
- Common ancestry
- Lithuanian 7% Serbian 2% Italian 1%
- Foreign-born
- 3% · Canada, South Korea
- Languages at home
- 93% English-only · Other Asian/Pacific 3% Spanish 2% French/Haitian/Cajun 1%
Political lean MEDSL · Calcasieu
- 2024 margin
- Solid R (+39.6) · D 29.5% · R 69.0% · Other 1.5%
- 2008→2024 swing
- -15.0pp toward R · 2008: -24.6pp · 2024: -39.6pp
- All cycles
- 2024: R+39.6 2020: R+35.2 2016: R+33.3 2012: R+28.7 2008: R+24.6
Not yet ingested
- Civics
- —
Market trends
- HPI YoY
- ▼ -107.45%
- Current HPI
- 81.9801
- Rent YoY
- —
- Metro
- Lake Charles, LA
- State GDP YoY
- ▲ 3.29%
- F500 in state
- 10
Industry mix (Fortune 500 HQ in LA)
| Industry | F500 HQs | Revenue |
|---|---|---|
| Telecommunications | 2 | $23B |
|
||
| Utilities | 1 | $12B |
|
||
| Wholesale / Distribution | 1 | $5B |
|
||
| Advertising | 1 | $2B |
|
||
Price history
1 event — show timeline
- 2026-04-15 Listed $255,000 SWLAR
Property tax history
+0.3%/yrLatest (2025): $2,812 · +3.6% YoY. Source: county tax records.
Cash-flow waterfall
monthlySold comps — $/sqft
last 12 mo · ≤1 miLoading sold comps…