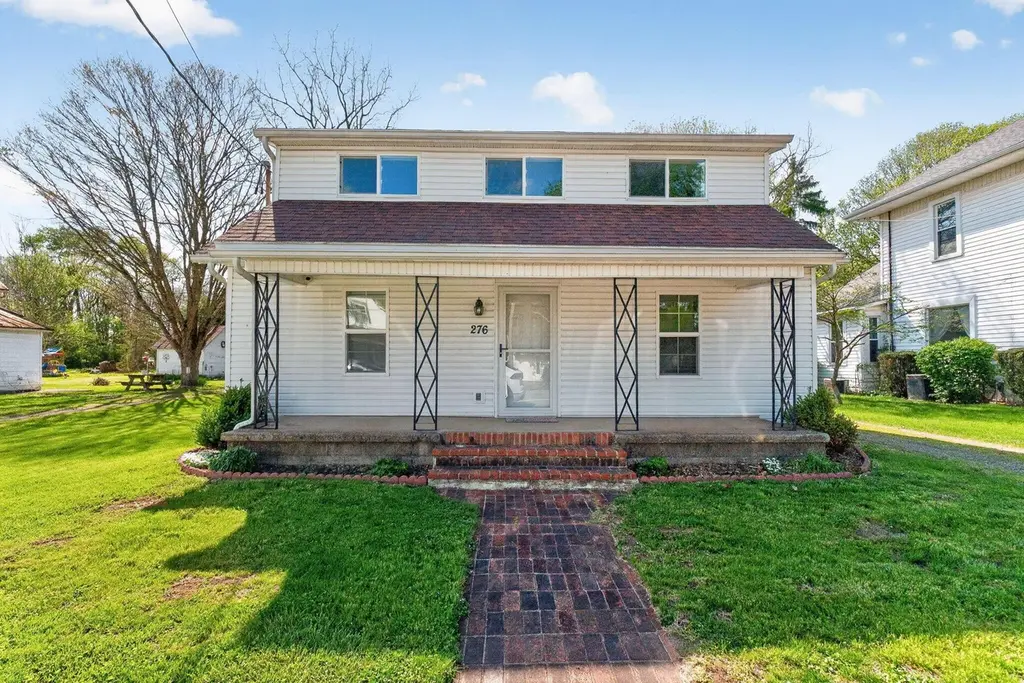
276 N Sycamore St · North Lewisburg, OH
Flood risk 1/10 · Minimal
- FEMA flood zone
- X (unshaded)
- Chance of flooding over 30 yrs
- 0.0%
- Est. flood insurance / yr
- $507 – $1,088
Fire risk 1/10 · Minimal
- Est. fire insurance / yr
- $713 – $1,323
Heat risk 3/10 · Minor
- Hot days now (above 100°F)
- 7 days/yr
- Hot days in 30 yrs
- 18 days/yr
Wind risk 2/10 · Minimal
- Chance of severe wind over 30 yrs
- 0.0%
Air-quality risk 2/10 · Minimal
- Unhealthy air days now
- 1 days/yr
- Unhealthy air days in 30 yrs
- 2 days/yr
Risk factors via First Street. Map © Google.
Why this score? — see what drove the C+ grade
The composite is a weighted blend of 9 inputs, each scored 0–100. Each bar is that input's sub-score; the figure is the points it added to the 100-point composite (weight × sub-score).
- Cash flow +29.1/30.0
- DSCR +10.0/10.0
- 1% rule +7.1/10.0
- Schools +5.3/10.0
- Livability +3.3/5.0
- Rent growth +2.5/5.0
- Condition / age +2.5/5.0
- ARV discount +0.9/15.0
- Appreciation +0.0/10.0
$265,000
🖨 Deal sheet 📄 Offer letter ✓ Due diligence
Key facts
- Updated finishes
- Fully renovated home
- Spacious dining room
Tags
Property features AI
Exterior
- Parking: Detached 2-car garage
- Utilities: Public water; Public sewer
- Home design: Single family residence; Two stories; Built in 1900; No shared/common walls
- Construction: Year built: 1900
- Exterior features: Patio; Slab foundation; Lot approximately 0.24 acre
Interior
- Bedrooms: Two main-level bedrooms
- Flooring: Stone flooring; Carpeted areas
- Bathrooms: One full bathroom; One half bathroom
- Heating & cooling: Central air conditioning; Forced air heating with propane
- Interior features: Insulated windows throughout; Decorative fireplace (one)
Neighborhood map
What this means for you Summary
Snapshot
- This is a 3-bed/1.0-bath single-family listed at $265k.
Deal economics
- At list price, monthly cash flow is $912 ($11k/yr) — positive.
- The deal already cash-flows at list — no discount required.
- Meets the 1% rule at list price ($3k rent vs $265k).
- Recommended offer: $257k (3.0% below list) — sets the bar for market timing.
Location & tenants
- Location reads 66/100 on livability (#672 in OH) — a middle-class / working-renter tenant base. Strengths: crime A+, cost of living A+, housing A+; Watch: employment D, amenities F, commute F.
- Triad Local (rural): math 61% / reading 61% proficiency, ranked #255 of 656 in OH (top 39%) — acceptable for families but not a draw, mixed tenant base, ~2y average lease.
- Market conditions: 7 active listings in the ZIP; 42 units permitted in Champaign County in 2024 (0 in 5+ unit buildings).
- At $3,218/mo this rent would consume 63% of the median local household income ($62k/yr) — very limited rent-growth headroom before tenants either downsize or default.
Forward outlook
- Local home prices are declining (-3.0%/yr); year-one equity from $2k of loan paydown is wiped out by about $8k of value loss. Plan a longer hold.
- Champaign County population projected at -25% by 2050 — secular population decline; favor cash flow + early exit over multi-decade hold.
- At projected returns (-3.0% appreciation + 3.0% rent growth), your $74k cash investment doubles in ~8 years — after that, you're playing with house money.
Negotiation context
- It's been on market 55 days — a 3% lower offer ($257k) is reasonable based on typical stale-listing flexibility.
- 6 sale attempts since 11y ago with the ask held roughly flat each time — persistent listings suggest the price (not the market) is what's stuck; bring a comps-based counter.
- Current owner paid $230k; 15% above their basis — modest negotiation headroom, anchor on the comps not their cost.
Risks & watch-outs
- Watch-outs: built in 1900 — expect roof / HVAC / electrical / plumbing capex.
Questions for the listing agent
- It's been on market 55 days. Have you received any prior offers? Is the seller open to a 3% concession, seller financing, or rate buy-down credit?
- Built in 1900 — when were the roof, HVAC, electrical panel, plumbing, and water heater last replaced?
- Is there a deadline driving the sale (1031 exchange, divorce, estate, relocation)? That informs how much negotiation room exists.
- Schools are B-rated — typically a magnet for longer-tenancy family renters. What's the average tenant stay here, and is there a school-zone premium baked into asking?
- What's the average days-on-market for RENTAL listings here right now (not sales)? A rising rental-DOM trend means longer vacancies and softer asking-rent achievability than the comps imply.
- What's the recent tenant-quality profile in this submarket — average credit score on applications, eviction rate, late-payment / NSF rate, and stable-employment percentage? A property-management company in the area should have these aggregated.
- How much new for-sale + rental construction is in the pipeline within 1–3 miles? Heavy new supply typically softens prices + rents 12–24 months out; constrained supply supports both.
Investment metrics
- 1% rule
- 1.21% ✓
- Cap rate
- 10.42%
- Cash-on-cash
- 14.75%
- DSCR
- 1.66
- GRM
- 6.9
CMA / ARV
- ARV (median comp)
- $231,160
- List price
- $265,000
- Delta
- 14.64%
- Verdict
- OVERPRICED
- Comps
- 20 within 1.0 mi
Show comp detail 7 sales within ~0.75 mi
| Address | Dist | Beds/Ba | Sqft | Sold | Price | $/sf | Match |
|---|---|---|---|---|---|---|---|
| 173 Lincoln Pl | 0.27mi | 3/2.0 | 1,760 (+1%) | 3mo | $335,000 | $190 | 80 |
| 72 North St | 0.17mi | 3/1.0 | 1,614 (-8%) | 9mo | $225,000 | $139 | 73 |
| 106 S Sycamore St | 0.36mi | 3/2.0 | 1,698 (-3%) | 14mo | $280,000 | $165 | 63 |
| 88 Tallman St | 0.37mi | 2/1.5 (-1) | 1,804 (+3%) | 11mo | $350,000 | $194 | 61 |
| 89 E Maple St | 0.29mi | 3/2.5 | 1,541 (-12%) | 3mo | $228,500 | $148 | 59 |
| 125 Lincoln Pl | 0.27mi | 3/2.0 | 1,500 (-14%) | 2mo | $276,900 | $185 | 59 |
| 234 Lincoln Pl | 0.24mi | 3/2.0 | 1,510 (-13%) | 20mo | $289,900 | $192 | 46 |
Match score weights: distance 35% · size 25% · config 20% · recency 20%. Top-matched comps best support the ARV.
Projected returns pro-forma
-3.0% appreciation · 3.0% rent growth · sell at horizon
- IRR
- 5.2%
- Equity multiple
- 1.20×
- Total profit
- $15,059
- Equity at exit
- $39,512
- IRR
- 14.6%
- Equity multiple
- 2.18×
- Total profit
- $87,591
- Equity at exit
- $22,912
Cash invested: $74,200 (down + closing). Projections, not guarantees.
Landlord ↔ Tenant lean methodology
- Overall (STATE)
- 73 Landlord-Friendly
- State Ohio
- 73 Landlord-Friendly · R+6
- County
- — inherits STATE
- City
- — inherits STATE
ZIP-level market 43060
- Home prices YoY
- -19.3%
- Active inventory
- 7
- Price-to-rent
- 6.9×
Monthly cashflow live
- Estimated rent
- $3,218 medium interval (Pro) →
- Mortgage (P&I)
- −$1,390
- Tax from tax record
- −$130 /mo · $1,564/yr
- Insurance
- −$110
- HOA
- −$0
- Vacancy / Maint / Mgmt
- −$676
- Net cashflow
- $912
Break-even live
UW: 25.0% down · 7.5% · 30yr · 1.5% tax · 5.0% vac · 8.0% maint · 8.0% mgmt
Financing live
Cash to close
- Down payment
- $66,250
- Closing costs
- $7,950
- Reserves months
- —
- Total cash needed
- —
Loan-product check · same deal, 3 products live
Conventional
25% down · 7.5% · 30yr
- Down + closing
- —
- Monthly P&I
- —
- Monthly cashflow
- —
- DSCR
- —
- Eligible?
- —
Personal DTI + credit; lowest rate.
DSCR
20% down · 8.5% · 30yr
- Down + closing
- —
- Monthly P&I
- —
- Monthly cashflow
- —
- DSCR
- —
- Eligible?
- —
No personal income docs; deal must DSCR.
Hard money
10% down · 12.0% · 12mo
- Down + closing
- —
- Monthly P&I
- —
- Monthly cashflow
- —
- DSCR
- —
- Eligible?
- —
Short-term bridge; refi at stabilization.
Listing history 27 events
-
2026-06-18days on market $265,000 Active 55 DOM
-
2026-06-17days on market $265,000 Active 54 DOM
-
2026-06-16days on market $265,000 Active 53 DOM
-
2026-06-15days on market $265,000 Active 52 DOM
-
2026-06-13days on market $265,000 Active 50 DOM
-
2026-06-13days on market $265,000 Active 49 DOM
-
2026-06-10price $265,000 Active 46 DOM
-
2026-06-09days on market $275,000 Active 46 DOM
-
2026-06-08days on market $275,000 Active 45 DOM
-
2026-06-07days on market $275,000 Active 44 DOM
-
2026-06-05days on market $275,000 Active 41 DOM
-
2026-06-03days on market $275,000 Active 40 DOM
-
2026-06-02days on market $275,000 Active 39 DOM
-
2026-06-01days on market $275,000 Active 38 DOM
-
2026-05-31days on market $275,000 Active 37 DOM
-
2026-05-18status Active 842-char remark
-
2026-05-11historical Contingent 842-char remark
-
2026-04-24$275,000 Active 842-char remark
-
2021-10-06soldstatus $230,000
-
2019-01-13historical
-
2019-01-12historical
-
2018-07-12$49,000
-
2018-07-12$49,000
-
2015-06-05soldstatus $13,000
-
2015-06-05soldstatus $13,000
-
2015-01-10$22,900
-
2015-01-10$22,900
ⓘ Source: listings_history table (triggers on properties + properties_extension) + one-shot
backfill from property_details.listing_events for pre-trigger history.
Tax reassessment forecast OH · Partial reset (capped growth)
- Current annual tax
- $1,564 · $130/mo
- Projected year-2 tax
- $2,849 · $237/mo
- Expected delta
- +$1,285/yr (+$107/mo · 82.1%)
ⓘ Screening estimate from a state-policy table — verify with the county assessor before closing.
Climate risk First Street
- Flood 1/10 Low FEMA zone X (unshaded) · 0% chance over 30 yrs
- Wildfire 1/10 Low
- Heat 3/10 Moderate 7 d/yr ≥100°F today · 18 d/yr by 30 yrs out
- Wind 2/10 Low 0% chance of damaging wind over 30 yrs
- Air quality 2/10 Low 1 unhealthy d/yr today · 2 by 30 yrs out
Nearby sold comps map
Loading sold comps map…
Walkable amenities ~0.75 mi
Loading nearby amenities…
Taxation est. · year 1
- Rental income
- $38,617
- − Mortgage interest
- −$14,844
- − Property taxes
- −$1,564
- − Insurance
- −$1,325
- − Repairs & maintenance
- −$3,089
- − Management
- −$3,089
- − Depreciation
- −$7,709
- Taxable income
- $6,996
- Est. tax owed @ 24.0%
- −$1,679
- After-tax cash flow
- $9,263/yr
For passive investors: Depreciation is non-cash, so a rental often shows a tax loss while cash-flowing — sheltering income. Rental losses are passive: they offset passive income freely, and up to $25,000/yr can offset ordinary (W-2) income if you actively participate and your MAGI is under $100k (phasing out to $0 by $150k); unused losses carry forward. On sale, claimed depreciation is recaptured at up to 25%, and gains may owe capital-gains tax (a 1031 exchange can defer both). Figures are a year-1 estimate at your 24.0% rate — not tax advice; consult a CPA.
Schools (NCES district)
- District
- Triad Local
- NCES district ID
- 3904620
- Math proficiency
- 61% ▼ -9.00%
- Reading proficiency
- 61% ▼ -5.00%
- Median HH income
- $60,419
- Composite
- 52.91/100
- National rank
- #1531
- State rank
- #255 of 656 in OH
Livability — North Lewisburg
- Score
- 66/100
- State rank
- #672
- US rank
- #11848
Category grades
Schools grade is shown separately in the Schools card above.
Census & demographics
- Census place
- North Lewisburg, OH
- County
- Champaign · 37,359 people
- Population (ZIP)
- 2,385
- Household income
- $61,776
- Rent vs Own
- Severe rent burden
- 5.0
Population outlook (Champaign County) Hauer SSP2
- Today (2025)
- 36,480 people
- By 2030
- 34,790 · -4.6%
- By 2040
- 31,082 · -14.8%
- By 2050
- 27,217 · -25.4%
- By 2075
- 19,156 · -47.5%
- By 2100
- 12,690 · -65.2%
Race, ethnicity, and origin ACS 2023
- Neighborhood character
- Predominantly White (96%)
- Race & ethnicity
- White 96% Two or more races 3%
- Common ancestry
- Lithuanian 4% Italian 4% Serbian 3%
- Foreign-born
- 1% · Canada
Political lean MEDSL · Champaign
- 2024 margin
- Solid R (+50.8) · D 24.1% · R 74.9%
- 2008→2024 swing
- -30.9pp toward R · 2008: -19.9pp · 2024: -50.8pp
- All cycles
- 2024: R+50.8 2020: R+47.7 2016: R+44.5 2012: R+20.1 2008: R+19.9
Not yet ingested
- Civics
- —
Market trends
- HPI YoY
- ▼ -63.71%
- Current HPI
- 266.8896
- Rent YoY
- —
- Metro
- —
- State GDP YoY
- ▲ 1.98%
- F500 in state
- 48
Industry mix (Fortune 500 HQ in OH)
| Industry | F500 HQs | Revenue |
|---|---|---|
| Insurance | 3 | $145B |
|
||
| Industrial Machinery | 3 | $49B |
|
||
| Financial Services | 3 | $24B |
|
||
| Consumer Goods | 2 | $93B |
|
||
| Aerospace / Defense | 2 | $47B |
|
||
| Utilities | 2 | $33B |
|
||
Price history
+1057.2% since first listed13 events — show timeline
- 2026-06-09 Price Changed $265,000 CBRMLS
- 2026-05-18 Relisted — CBRMLS
- 2026-05-11 Contingent — CBRMLS
- 2026-04-24 Listed $275,000 CBRMLS
- 2021-10-06 Sold (Public Records) $230,000 Public Records
- 2019-01-13 Listing Removed — CBRMLS
- 2019-01-12 Listing Removed — WRIST
- 2018-07-12 Listed $49,000 WRIST
- 2018-07-12 Listed $49,000 CBRMLS
- 2015-06-05 Sold (MLS) $13,000 WRIST
- 2015-06-05 Sold (MLS) $13,000 CBRMLS
- 2015-01-10 Listed $22,900 WRIST
- 2015-01-10 Listed $22,900 CBRMLS
Property tax history
+1.9%/yrLatest (2025): $1,564 · +0.0% YoY. Source: county tax records.
Cash-flow waterfall
monthlySold comps — $/sqft
last 12 mo · ≤1 miLoading sold comps…