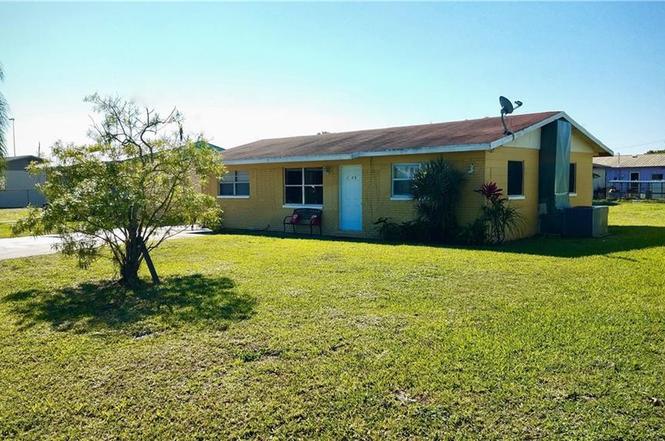
1126 Florida Ave · Harlem, FL
Flood risk 1/10 · Minimal
- FEMA flood zone
- X (unshaded)
- Chance of flooding over 30 yrs
- 0.0%
- Est. flood insurance / yr
- $507 – $1,088
Fire risk 1/10 · Minimal
- Est. fire insurance / yr
- $947 – $1,759
Heat risk 9/10 · Severe
- Hot days now (above 108°F)
- 7 days/yr
- Hot days in 30 yrs
- 26 days/yr
Wind risk 10/10 · Severe
- Chance of severe wind over 30 yrs
- 99.0%
Air-quality risk 2/10 · Minimal
- Unhealthy air days now
- 0 days/yr
- Unhealthy air days in 30 yrs
- 1 days/yr
Risk factors via First Street. Map © Google.
Why this score? — see what drove the D- grade
The composite is a weighted blend of 9 inputs, each scored 0–100. Each bar is that input's sub-score; the figure is the points it added to the 100-point composite (weight × sub-score).
- Cash flow +15.0/30.0
- DSCR +4.6/10.0
- ARV discount +4.3/15.0
- 1% rule +3.7/10.0
- Schools +3.1/10.0
- Livability +3.0/5.0
- Rent growth +2.5/5.0
- Condition / age +2.5/5.0
- Appreciation +0.5/10.0
$185,000
🖨 Deal sheet (PDF) 📄 Offer letter ✓ Due diligence
Listing remarks
Charming 3-Bedroom, 1-Bath Home – Fully Remodeled & Move-In Ready! Welcome to this beautifully updated 3/1 home featuring a brand-new roof and a complete remodel from top to bottom. Whether you’re a first-time homebuyer or an investor, this property checks all the right boxes. The home also includes a spacious indoor laundry room with plenty of room for a full-size washer and dryer—because hauling laundry outside is not easy! Perfectly centrally located just minutes from the City of Clewiston, schools, and shopping, with convenient access to Miami, West Palm Beach, Fort Myers, and Sebring—all about 1.5 hours away. This charming home is truly turnkey and r
Key facts
- Fully remodeled
- Brand new roof
- 7,840 sq ft lot
Tags
Property features AI
Finance
- Financial info: Pets allowed
- HOA & community: No association fee; Non-gated community
Exterior
- Parking: Detached carport; 2 covered carport spaces
- Utilities: Cable available; Sewer assessment paid; Water assessment paid
- Home design: Single-story; Entry level: 1; Faces north; South exposure
- Construction: Block, concrete, and stone construction; Shingle roof; Built as resale property
- Exterior features: Fruit trees; Outbuilding
Interior
- Kitchen: Electric cooktop; Freezer; Refrigerator
- Flooring: Laminate; Tile
- Bathrooms: 1 full bathroom
- Heating & cooling: Central heating (electric); Central air conditioning (electric)
- Interior features: Furnished; Living/dining room; Tub with shower; Split bedroom floorplan; Double-hung windows
- Laundry & utility: Washer hookup; Dryer hookup
Neighborhood map
What this means for you Summary
Snapshot
- This is a 2-bed/1.0-bath single-family listed at $185k.
Deal economics
- At list price, monthly cash flow is $59 ($703/yr) — positive.
- The deal already cash-flows at list — no discount required.
- To meet the 1% rule (rent ≥ 1% of price), the offer needs to be $161k (13.2% below list).
- Recommended offer: $161k (13.2% below list) — sets the bar for 1% rule.
Location & tenants
- Location reads 59/100 on livability (#822 in FL) — a working-class tenant base; expect higher turnover. Strengths: cost of living A+, crime A, housing A; Watch: schools F, amenities F, commute F.
- Hendry (town): math 35% / reading 40% proficiency, ranked #65 of 73 in FL (top 89%) — families likely to look elsewhere, expect single-tenant / working-renter base with shorter leases; 75% free/reduced lunch — lower-income household profile, screen leases tightly.
- Market conditions: 404 active listings in the ZIP; 557 units permitted in Hendry County in 2024 (45 in 5+ unit buildings).
Forward outlook
- Local home prices are declining (-3.0%/yr); year-one equity from $1k of loan paydown is wiped out by about $6k of value loss. Plan a longer hold.
- Hendry County population projected to shrink 7% by 2050 — rents likely to lag national; underwrite the cash flow, not the appreciation.
Negotiation context
- It's been on market 150 days — a 12% lower offer ($163k) is reasonable based on typical stale-listing flexibility.
- 4 sale attempts since 7y ago with the ask held roughly flat each time — persistent listings suggest the price (not the market) is what's stuck; bring a comps-based counter.
- Current owner paid $48k; list at $185k implies a 282% gain — meaningful room to come down on a strong offer.
Risks & watch-outs
- Climate carrying-cost: severe wind risk, 99% chance of damaging wind over 30y; extreme-heat days projected 7→26/yr by 2055 (HVAC capex compounding) — expect insurance premiums to compound above CPI over the hold.
Questions for the listing agent
- It's been on market 150 days. Have you received any prior offers? Is the seller open to a 13% concession, seller financing, or rate buy-down credit?
- Built in 1963 — when were the roof, HVAC, electrical panel, plumbing, and water heater last replaced?
- Why hasn't it sold? Are there any deal-killer items the seller is aware of (foundation, flood, title, zoning, code violations)?
- Is there a deadline driving the sale (1031 exchange, divorce, estate, relocation)? That informs how much negotiation room exists.
- Schools are F-rated, which usually means shorter tenancies and higher turnover. Who's the typical renter profile here, and what's been the actual vacancy rate?
- The area grade is low — what's the realistic commute time and amenity access for the typical tenant pool here? Any planned neighborhood developments (good or bad) we should know about?
- What's the average days-on-market for RENTAL listings here right now (not sales)? A rising rental-DOM trend means longer vacancies and softer asking-rent achievability than the comps imply.
- What's the recent tenant-quality profile in this submarket — average credit score on applications, eviction rate, late-payment / NSF rate, and stable-employment percentage? A property-management company in the area should have these aggregated.
- How much new for-sale + rental construction is in the pipeline within 1–3 miles? Heavy new supply typically softens prices + rents 12–24 months out; constrained supply supports both.
Investment metrics
- 1% rule
- 0.87% ✗
- Cap rate
- 6.67%
- Cash-on-cash
- 1.36%
- DSCR
- 1.06
- GRM
- 9.6
CMA / ARV
- ARV (on-the-fly)
- $172,800
- Comps found
- 5
Show comp detail 5 sales within ~0.75 mi
| Address | Dist | Beds/Ba | Sqft | Sold | Price | $/sf | Match |
|---|---|---|---|---|---|---|---|
| 1006 Virginia Ave | 0.36mi | 3/1.0 (+1) | 916 (-5%) | 4mo | $165,000 | $180 | 67 |
| 2305 13th St | 0.29mi | 3/1.0 (+1) | 952 (-1%) | 16mo | $150,000 | $158 | 66 |
| 1032 Arkansas Ave | 0.50mi | 3/1.0 (+1) | 1,000 (+4%) | 3mo | $185,000 | $185 | 62 |
| 910 Harlem Academy Ave | 0.38mi | 3/2.0 (+1) | 1,000 (+4%) | 8mo | $190,000 | $190 | 60 |
| 1053 Arkansas Ave | 0.45mi | 3/1.0 (+1) | 1,000 (+4%) | 8mo | $155,000 | $155 | 60 |
Match score weights: distance 35% · size 25% · config 20% · recency 20%. Top-matched comps best support the ARV.
Projected returns pro-forma
-3.0% appreciation · 3.0% rent growth · sell at horizon
- IRR
- -14.2%
- Equity multiple
- 0.49×
- Total profit
- $-26,265
- Equity at exit
- $27,584
- IRR
- -5.4%
- Equity multiple
- 0.65×
- Total profit
- $-18,139
- Equity at exit
- $15,995
Cash invested: $51,800 (down + closing). Projections, not guarantees.
Landlord ↔ Tenant lean methodology
- Overall (STATE)
- 87 Strongly Landlord-Friendly
- State Florida
- 87 Strongly Landlord-Friendly · R+3
- County
- — inherits STATE
- City
- — inherits STATE
ZIP-level market 33440
- Home prices YoY
- -2.1%
- Active inventory
- 404
- Price-to-rent
- 9.6×
Monthly cashflow live
- Estimated rent
- $1,606 medium interval (Pro) →
- Mortgage (P&I)
- −$970
- Tax from tax record
- −$163 /mo · $1,957/yr
- Insurance
- −$77
- HOA
- −$0
- Vacancy / Maint / Mgmt
- −$337
- Net cashflow
- $59
Break-even live
Sensitivity live
| Price | -10% $163 | -5% $111 | +0% $59 | +5% $6 | +10% $-46 |
|---|---|---|---|---|---|
| Rent | -10% $-68 | -5% $-5 | +0% $59 | +5% $122 | +10% $185 |
| Rate | -1.0pp $152 | -0.5pp $106 | base $59 | +0.5pp $11 | +1.0pp $-38 |
UW: 25.0% down · 7.5% · 30yr · 1.5% tax · 5.0% vac · 8.0% maint · 8.0% mgmt
Financing live
Cash to close
- Down payment
- $46,250
- Closing costs
- $5,550
- Reserves months
- —
- Total cash needed
- —
Loan-product check · same deal, 3 products live
Conventional
25% down · 7.5% · 30yr
- Down + closing
- —
- Monthly P&I
- —
- Monthly cashflow
- —
- DSCR
- —
- Eligible?
- —
Personal DTI + credit; lowest rate.
DSCR
20% down · 8.5% · 30yr
- Down + closing
- —
- Monthly P&I
- —
- Monthly cashflow
- —
- DSCR
- —
- Eligible?
- —
No personal income docs; deal must DSCR.
Hard money
10% down · 12.0% · 12mo
- Down + closing
- —
- Monthly P&I
- —
- Monthly cashflow
- —
- DSCR
- —
- Eligible?
- —
Short-term bridge; refi at stabilization.
Listing history 20 events
-
2026-06-13days on market $185,000 Active 150 DOM
-
2026-06-13days on market $185,000 Active 149 DOM
-
2026-06-10days on market $185,000 Active 147 DOM
-
2026-06-09days on market $185,000 Active 146 DOM
-
2026-06-08days on market $185,000 Active 145 DOM
-
2026-06-07days on market $185,000 Active 144 DOM
-
2026-06-03days on market $185,000 Active 140 DOM
-
2026-06-02days on market $185,000 Active 139 DOM
-
2026-06-01days on market $185,000 Active 138 DOM
-
2026-05-31days on market $185,000 Active 137 DOM
-
2026-02-17price $185,000
-
2026-01-14$189,000 Active
-
2024-06-23historical
-
2024-05-21$175,000 Active
-
2024-05-21$175,000 Active
-
2019-04-29soldstatus $48,400
-
2019-04-15soldstatus $48,350 Sold
-
2019-03-28status Pending With Contingencies
-
2019-03-23price $49,900
-
2019-03-22$49,999 Active
ⓘ Source: listings_history table (triggers on properties + properties_extension) + one-shot
backfill from property_details.listing_events for pre-trigger history.
Tax reassessment forecast FL · Resets to sale price
- Current annual tax
- $1,957 · $163/mo
- Projected year-2 tax
- $1,957 · $163/mo
- Expected delta
- $0/yr ($0/mo · 0.0%)
ⓘ Screening estimate from a state-policy table — verify with the county assessor before closing.
Climate risk First Street
- Flood 1/10 Low FEMA zone X (unshaded) · 0% chance over 30 yrs
- Wildfire 1/10 Low
- Heat 9/10 Extreme 7 d/yr ≥108°F today · 26 d/yr by 30 yrs out
- Wind 10/10 Extreme 99% chance of damaging wind over 30 yrs
- Air quality 2/10 Low 0 unhealthy d/yr today · 1 by 30 yrs out
Nearby sold comps map
Loading sold comps map…
Walkable amenities ~0.75 mi
Loading nearby amenities…
Taxation est. · year 1
- Rental income
- $19,275
- − Mortgage interest
- −$10,363
- − Property taxes
- −$1,957
- − Insurance
- −$925
- − Repairs & maintenance
- −$1,542
- − Management
- −$1,542
- − Depreciation
- −$5,382
- Taxable loss
- −$2,436
- Est. tax savings @ 24.0%
- +$585
- After-tax cash flow
- $1,288/yr
For passive investors: Depreciation is non-cash, so a rental often shows a tax loss while cash-flowing — sheltering income. Rental losses are passive: they offset passive income freely, and up to $25,000/yr can offset ordinary (W-2) income if you actively participate and your MAGI is under $100k (phasing out to $0 by $150k); unused losses carry forward. On sale, claimed depreciation is recaptured at up to 25%, and gains may owe capital-gains tax (a 1031 exchange can defer both). Figures are a year-1 estimate at your 24.0% rate — not tax advice; consult a CPA.
Schools (NCES district)
- District
- Hendry
- NCES district ID
- 1200780
- Math proficiency
- 35% ▼ -11.00%
- Reading proficiency
- 40% ▼ -4.00%
- Median HH income
- $37,043
- Composite
- 31.16/100
- National rank
- #6054
- State rank
- #65 of 73 in FL
Livability — Harlem
- Score
- 59/100
- State rank
- #822
- US rank
- #20089
Category grades
Schools grade is shown separately in the Schools card above.
Census & demographics
- Census place
- Harlem, FL
- Population (ZIP)
- 21,119
Population outlook (Hendry County) Hauer SSP2
- Today (2025)
- 38,866 people
- By 2030
- 38,558 · -0.8%
- By 2040
- 37,743 · -2.9%
- By 2050
- 36,117 · -7.1%
- By 2075
- 30,070 · -22.6%
- By 2100
- 21,966 · -43.5%
Race, ethnicity, and origin ACS 2023
- Neighborhood character
- Diverse neighborhood (Simpson 0.62)
- Race & ethnicity
- Hispanic / Latino 55% Two or more races 26% White 23% Black 18% Native American 3% Asian 2%
- Hispanic origin (detail)
- Mexican 18% Puerto Rican 5% Cuban 18%
- Common ancestry
- Lithuanian 2% Italian 1% Serbian 1%
- Foreign-born
- 30% · Canada, Jamaica, China
- Languages at home
- 48% English-only · Spanish 48% Other Indo-European 1% French/Haitian/Cajun 1%
Political lean MEDSL · Hendry
- 2024 margin
- Solid R (+38.3) · D 30.4% · R 68.7%
- 2008→2024 swing
- -31.1pp toward R · 2008: -7.2pp · 2024: -38.3pp
- All cycles
- 2024: R+38.3 2020: R+23.0 2016: R+14.2 2012: R+5.9 2008: R+7.2
Not yet ingested
- Civics
- —
Market trends
- HPI YoY
- ▼ -9.08%
- Current HPI
- 414.9243
- Rent YoY
- —
- Metro
- —
- State GDP YoY
- ▲ 3.28%
- F500 in state
- 36
Industry mix (Fortune 500 HQ in FL)
| Industry | F500 HQs | Revenue |
|---|---|---|
| Industrial Technology | 2 | $29B |
|
||
| Insurance | 2 | $17B |
|
||
| Retail | 1 | $60B |
|
||
| Technology Distribution | 1 | $58B |
|
||
| Homebuilding | 1 | $35B |
|
||
| Technology Manufacturing | 1 | $35B |
|
||
Price history
+270.0% since first listed10 events — show timeline
- 2026-02-17 Price Changed $185,000 FORTMLS
- 2026-01-14 Listed $189,000 FORTMLS
- 2024-06-23 Listing Removed — Stellar MLS as Distributed by MLS Grid
- 2024-05-21 Listed $175,000 HAOR as distributed by MLS GRID
- 2024-05-21 Listed $175,000 Stellar MLS as Distributed by MLS Grid
- 2019-04-29 Sold (Public Records) $48,400 Public Records
- 2019-04-15 Sold (MLS) $48,350 FORTMLS
- 2019-03-28 Pending — FORTMLS
- 2019-03-23 Price Changed $49,900 FORTMLS
- 2019-03-22 Listed $49,999 FORTMLS
Property tax history
+7.2%/yrLatest (2025): $1,957 · +6.0% YoY. Source: county tax records.
Cash-flow waterfall
monthlySold comps — $/sqft
last 12 mo · ≤1 miLoading sold comps…