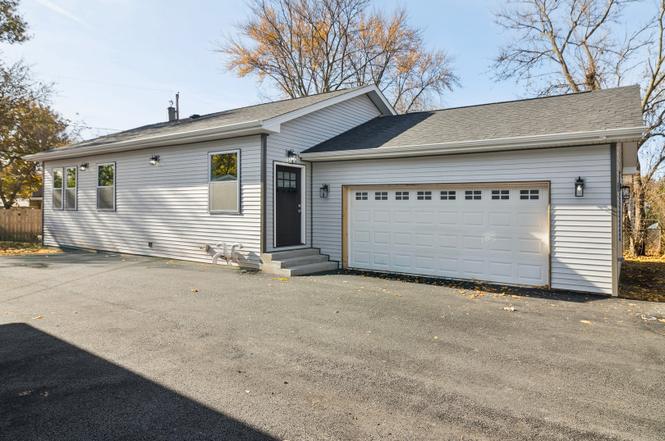
302 Hughes Ave · Fairmont, IL
Flood risk 1/10 · Minimal
- FEMA flood zone
- X (unshaded)
- Chance of flooding over 30 yrs
- 0.0%
- Est. flood insurance / yr
- $507 – $1,088
Fire risk 1/10 · Minimal
- Est. fire insurance / yr
- $804 – $1,492
Heat risk 3/10 · Minor
- Hot days now (above 102°F)
- 7 days/yr
- Hot days in 30 yrs
- 15 days/yr
Wind risk 2/10 · Minimal
- Chance of severe wind over 30 yrs
- —
Air-quality risk 2/10 · Minimal
- Unhealthy air days now
- 1 days/yr
- Unhealthy air days in 30 yrs
- 2 days/yr
Risk factors via First Street. Map © Google.
Why this score? — see what drove the D+ grade
The composite is a weighted blend of 9 inputs, each scored 0–100. Each bar is that input's sub-score; the figure is the points it added to the 100-point composite (weight × sub-score).
- Cash flow +18.5/30.0
- ARV discount +7.5/15.0
- DSCR +5.8/10.0
- 1% rule +3.7/10.0
- Rent growth +3.5/5.0
- Schools +3.4/10.0
- Livability +3.4/5.0
- Condition / age +2.5/5.0
- Appreciation +0.0/10.0
$399,000
🖨 Deal sheet 📄 Offer letter ✓ Due diligence
Listing remarks
Welcome to your dream home in the heart of Lockport! This stunning new construction offers 4 spacious bedrooms and 2 beautiful bathrooms, perfectly located near downtown Lockport, schools, local shops, the train station, and Dellwood Disc Golf Course. Step inside and fall in love with the open layout featuring hardwood floors throughout and elegant porcelain tile bathrooms. The kitchen steals the show with light oak-stained cabinets, quartz countertops, and sleek stainless steel appliances, ideal for cooking and entertaining. The finished basement includes two bedrooms and a stylish bar area, perfect for hosting guests or relaxing after a long day. Outside, enjoy a spacious attached 2-car g
Key facts
- Quartz countertops
- New construction
- Open layout
Tags
Property features AI
Finance
- Other: Ownership is fee simple; Property is not currently leased; Approximately 2,310 total finished square feet (plans source)
- HOA & community: No master association fee required
Exterior
- Parking: Attached garage (garage owned) with 2 garage spaces; Shared driveway; total parking for 2 vehicles
- Utilities: Public water; Public sewer
- Home design: Detached single-family home; One-story design; New construction — ready for occupancy; Asphalt roof; Vinyl siding exterior
- Construction: New construction (ready for occupancy); Vinyl siding construction materials; Asphalt roof
- Exterior features: 40 x 120 lot dimensions; Lot under 0.25 acre; Interstate access nearby
Interior
- Kitchen: Kitchen on main level (11 x 16) with hardwood floors
- Bedrooms: Main-level master bedroom (11 x 10) with hardwood floors; Main-level bedroom (9 x 12) with hardwood floors; Two additional basement bedrooms (each 9 x 9) with hardwood floors — listed as below-grade possible bedrooms
- Flooring: Hardwood flooring throughout main and listed rooms
- Bathrooms: Two full bathrooms; Basement includes a bathroom
- Heating & cooling: Forced-air heating; Central air conditioning
- Interior features: First-floor bedroom and full bathroom; Finished full basement with walk-out access; Seven total rooms; Double-pane windows
- Laundry & utility: Laundry closet
Neighborhood map
What this means for you Summary
Snapshot
- This is a 4-bed/2.0-bath other listed at $399k.
Deal economics
- At list price, monthly cash flow is $382 ($5k/yr) — positive.
- The deal already cash-flows at list — no discount required.
- To meet the 1% rule (rent ≥ 1% of price), the offer needs to be $346k (13.2% below list).
- Recommended offer: $346k (13.2% below list) — sets the bar for 1% rule.
Location & tenants
- Location reads 68/100 on livability (#455 in IL) — a middle-class / working-renter tenant base. Strengths: commute A+, cost of living A+, housing A+; Watch: amenities F, health & safety F.
- Lockport Twp Hsd 205 (suburban): math 35% / reading 38% proficiency, ranked #153 of 620 in IL (top 25%) — families likely to look elsewhere, expect single-tenant / working-renter base with shorter leases.
- Zoned schools: Lockport Township High Sch East (math 35% / reading 38%, grade F, #117 of 693 statewide, top 17%, 3,872 students, 0% FRL).
- Market conditions: Rents rising (+3.9%/yr); 131 active listings in the ZIP; 2 comparable units currently listed for rent nearby; solid renter incomes; 2,028 units permitted in Will County in 2024 (530 in 5+ unit buildings).
- This rent runs 40% of the median local income ($103k/yr) — at the standard rent-burdened threshold; future hikes will face affordability resistance.
Forward outlook
- Local home prices are declining (-3.0%/yr); year-one equity from $3k of loan paydown is wiped out by about $12k of value loss. Plan a longer hold.
- Will County population projected to shrink 4% by 2050 — rents likely to lag national; underwrite the cash flow, not the appreciation.
Negotiation context
- It's been on market 164 days — a 12% lower offer ($351k) is reasonable based on typical stale-listing flexibility.
- 3 sale attempts; this cycle's ask has dropped $30k (7%) from the opening price — seller is motivated, your offer sets the floor, not the list.
- Current owner paid $135k; list at $399k implies a 196% gain — meaningful room to come down on a strong offer.
Questions for the listing agent
- It's been on market 164 days. Have you received any prior offers? Is the seller open to a 13% concession, seller financing, or rate buy-down credit?
- Why hasn't it sold? Are there any deal-killer items the seller is aware of (foundation, flood, title, zoning, code violations)?
- Is there a deadline driving the sale (1031 exchange, divorce, estate, relocation)? That informs how much negotiation room exists.
- Schools are F-rated, which usually means shorter tenancies and higher turnover. Who's the typical renter profile here, and what's been the actual vacancy rate?
- The area grade is low — what's the realistic commute time and amenity access for the typical tenant pool here? Any planned neighborhood developments (good or bad) we should know about?
- What's the average days-on-market for RENTAL listings here right now (not sales)? A rising rental-DOM trend means longer vacancies and softer asking-rent achievability than the comps imply.
- What's the recent tenant-quality profile in this submarket — average credit score on applications, eviction rate, late-payment / NSF rate, and stable-employment percentage? A property-management company in the area should have these aggregated.
- How much new for-sale + rental construction is in the pipeline within 1–3 miles? Heavy new supply typically softens prices + rents 12–24 months out; constrained supply supports both.
Investment metrics
- 1% rule
- 0.87% ✗
- Cap rate
- 7.44%
- Cash-on-cash
- 4.11%
- DSCR
- 1.18
- GRM
- 9.6
CMA / ARV
No comps found within radius.
Projected returns pro-forma
-3.0% appreciation · 3.91% rent growth · sell at horizon
- IRR
- -9.0%
- Equity multiple
- 0.67×
- Total profit
- $-37,310
- Equity at exit
- $59,492
- IRR
- 1.4%
- Equity multiple
- 1.10×
- Total profit
- $11,427
- Equity at exit
- $34,498
Cash invested: $111,720 (down + closing). Projections, not guarantees.
Landlord ↔ Tenant lean methodology
- Overall (STATE)
- 43 Moderately Tenant-Leaning
- State Illinois
- 43 Moderately Tenant-Leaning · D+7
- County
- — inherits STATE
- City
- — inherits STATE
ZIP-level market 60441
- Home prices YoY
- -33.0%
- Rents YoY
- 3.9%
- Active inventory
- 131
- Price-to-rent
- 9.6×
Monthly cashflow live
- Estimated rent
- $3,461 medium interval (Pro) →
- Mortgage (P&I)
- −$2,092
- Tax from tax record
- −$94 /mo · $1,123/yr
- Insurance
- −$166
- HOA
- −$0
- Vacancy / Maint / Mgmt
- −$727
- Net cashflow
- $382
Break-even live
UW: 25.0% down · 7.5% · 30yr · 1.5% tax · 5.0% vac · 8.0% maint · 8.0% mgmt
Financing live
Cash to close
- Down payment
- $99,750
- Closing costs
- $11,970
- Reserves months
- —
- Total cash needed
- —
Loan-product check · same deal, 3 products live
Conventional
25% down · 7.5% · 30yr
- Down + closing
- —
- Monthly P&I
- —
- Monthly cashflow
- —
- DSCR
- —
- Eligible?
- —
Personal DTI + credit; lowest rate.
DSCR
20% down · 8.5% · 30yr
- Down + closing
- —
- Monthly P&I
- —
- Monthly cashflow
- —
- DSCR
- —
- Eligible?
- —
No personal income docs; deal must DSCR.
Hard money
10% down · 12.0% · 12mo
- Down + closing
- —
- Monthly P&I
- —
- Monthly cashflow
- —
- DSCR
- —
- Eligible?
- —
Short-term bridge; refi at stabilization.
Rent comps 2 comps
| Address | Beds | Baths | Sqft | Rent | $/sqft | DOM | Units | Dist |
|---|---|---|---|---|---|---|---|---|
| 752 Rosanne St Lockport, IL | 3.0 | 2.0 | 1890 | $3,500 | $1.85 | 1d | 1 | 1.06mi |
| 752 Rosanne St Lockport, IL | 3.0 | 2.0 | 1890 | $3,700 | $1.96 | 7d | 1 | 1.06mi |
Listing history 26 events
-
2026-06-18days on market $399,000 Active 164 DOM
-
2026-06-17days on market $399,000 Active 163 DOM
-
2026-06-16days on market $399,000 Active 162 DOM
-
2026-06-15days on market $399,000 Active 161 DOM
-
2026-06-13days on market $399,000 Active 159 DOM
-
2026-06-09days on market $399,000 Active 155 DOM
-
2026-06-08days on market $399,000 Active 154 DOM
-
2026-06-08price $399,000 Active 153 DOM
-
2026-06-07days on market $409,999 Active 153 DOM
-
2026-06-04days on market $409,999 Active 150 DOM
-
2026-06-03days on market $409,999 Active 149 DOM
-
2026-06-02days on market $409,999 Active 148 DOM
-
2026-06-01days on market $409,999 Active 147 DOM
-
2026-05-31days on market $409,999 Active 146 DOM
-
2026-05-08price $409,999
-
2026-04-10price $414,999
-
2026-01-30price $419,000
-
2026-01-05$429,000 Active
-
2025-12-22historical
-
2025-12-05Active
-
2025-12-05historical
-
2025-12-05price
-
2025-11-14Active
-
2021-12-01soldstatus $135,000
-
2004-10-05soldstatus $135,000
-
2002-05-10soldstatus $120,000
ⓘ Source: listings_history table (triggers on properties + properties_extension) + one-shot
backfill from property_details.listing_events for pre-trigger history.
Tax reassessment forecast IL · Partial reset (capped growth)
- Current annual tax
- $1,123 · $94/mo
- Projected year-2 tax
- $5,090 · $424/mo
- Expected delta
- +$3,967/yr (+$331/mo · 353.1%)
ⓘ Screening estimate from a state-policy table — verify with the county assessor before closing.
Climate risk First Street
- Flood 1/10 Low FEMA zone X (unshaded) · 0% chance over 30 yrs
- Wildfire 1/10 Low
- Heat 3/10 Moderate 7 d/yr ≥102°F today · 15 d/yr by 30 yrs out
- Wind 2/10 Low
- Air quality 2/10 Low 1 unhealthy d/yr today · 2 by 30 yrs out
Nearby sold comps map
Loading sold comps map…
Walkable amenities ~0.75 mi
Loading nearby amenities…
Taxation est. · year 1
- Rental income
- $41,537
- − Mortgage interest
- −$22,350
- − Property taxes
- −$1,123
- − Insurance
- −$1,995
- − Repairs & maintenance
- −$3,323
- − Management
- −$3,323
- − Depreciation
- −$11,607
- Taxable loss
- −$2,185
- Est. tax savings @ 24.0%
- +$524
- After-tax cash flow
- $5,111/yr
For passive investors: Depreciation is non-cash, so a rental often shows a tax loss while cash-flowing — sheltering income. Rental losses are passive: they offset passive income freely, and up to $25,000/yr can offset ordinary (W-2) income if you actively participate and your MAGI is under $100k (phasing out to $0 by $150k); unused losses carry forward. On sale, claimed depreciation is recaptured at up to 25%, and gains may owe capital-gains tax (a 1031 exchange can defer both). Figures are a year-1 estimate at your 24.0% rate — not tax advice; consult a CPA.
Schools (NCES district)
- District
- Lockport Twp Hsd 205
- NCES district ID
- 1723350
- Math proficiency
- 35% ▼ -5.00%
- Reading proficiency
- 38% ▼ -4.00%
- Median HH income
- $69,994
- Composite
- 33.5/100
- National rank
- #5440
- State rank
- #153 of 620 in IL
Livability — Fairmont
- Score
- 68/100
- State rank
- #455
- US rank
- #9333
Category grades
Schools grade is shown separately in the Schools card above.
Census & demographics
- Census place
- Fairmont, IL
- County
- Will County · 412,448 people
- Metro
- Chicago-Naperville-Elgin, IL-IN-WI
- Population (ZIP)
- 36,844
- Household income
- $103,374
- Rent vs Own
- Severe rent burden
- 519.0
Population outlook (Will County) Hauer SSP2
- Today (2025)
- 705,368 people
- By 2030
- 708,154 · +0.4%
- By 2040
- 702,692 · -0.4%
- By 2050
- 680,249 · -3.6%
- By 2075
- 611,990 · -13.2%
- By 2100
- 516,215 · -26.8%
Race, ethnicity, and origin ACS 2023
- Neighborhood character
- Predominantly White (76%)
- Race & ethnicity
- White 76% Hispanic / Latino 12% Two or more races 9% Black 7%
- Hispanic origin (detail)
- Mexican 9% Puerto Rican 1%
- Common ancestry
- Romanian 18% Iranian 2% Lithuanian 2%
- Foreign-born
- 7% · Canada
- Languages at home
- 86% English-only · Spanish 7% Russian/Polish/Slavic 4% Other Indo-European 2%
Political lean MEDSL · Will
- 2024 margin
- Toss-up / Even · D 50.1% · R 48.5% · Other 1.4%
- 2008→2024 swing
- -11.6pp toward R · 2008: 13.2pp · 2024: 1.6pp
- All cycles
- 2024: D+1.6 2020: D+8.3 2016: D+5.7 2012: D+3.7 2008: D+13.2
Not yet ingested
- Civics
- —
Market trends
- HPI YoY
- ▼ -99.43%
- Current HPI
- 201.5857
- Rent YoY
- ▲ 3.91%
- Metro
- Chicago-Naperville-Elgin, IL-IN-WI
- State GDP YoY
- ▲ 1.59%
- F500 in state
- 60
Industry mix (Fortune 500 HQ in IL)
| Industry | F500 HQs | Revenue |
|---|---|---|
| Insurance | 4 | $201B |
|
||
| Consumer Goods | 4 | $87B |
|
||
| Industrial Machinery | 3 | $64B |
|
||
| Healthcare | 2 | $55B |
|
||
| Retail / Pharmacy | 1 | $148B |
|
||
| Agriculture / Food | 1 | $86B |
|
||
Price history
+241.7% since first listed12 events — show timeline
- 2026-05-08 Price Changed $409,999 MRED as Distributed by MLS Grid
- 2026-04-10 Price Changed $414,999 MRED as Distributed by MLS Grid
- 2026-01-30 Price Changed $419,000 MRED as Distributed by MLS Grid
- 2026-01-05 Listed $429,000 MRED as Distributed by MLS Grid
- 2025-12-22 Listing Removed — MRED as Distributed by MLS Grid
- 2025-12-05 Listing Removed — MRED as Distributed by MLS Grid
- 2025-12-05 Listed — MRED as Distributed by MLS Grid
- 2025-12-05 Price Changed — MRED as Distributed by MLS Grid
- 2025-11-14 Listed — MRED as Distributed by MLS Grid
- 2021-12-01 Sold (Public Records) $135,000 Public Records
- 2004-10-05 Sold (Public Records) $135,000 Public Records
- 2002-05-10 Sold (Public Records) $120,000 Public Records
Property tax history
+2.5%/yrLatest (2024): $1,123 · +1.1% YoY. Source: county tax records.
Cash-flow waterfall
monthlySold comps — $/sqft
last 12 mo · ≤1 miLoading sold comps…