 Multi-family
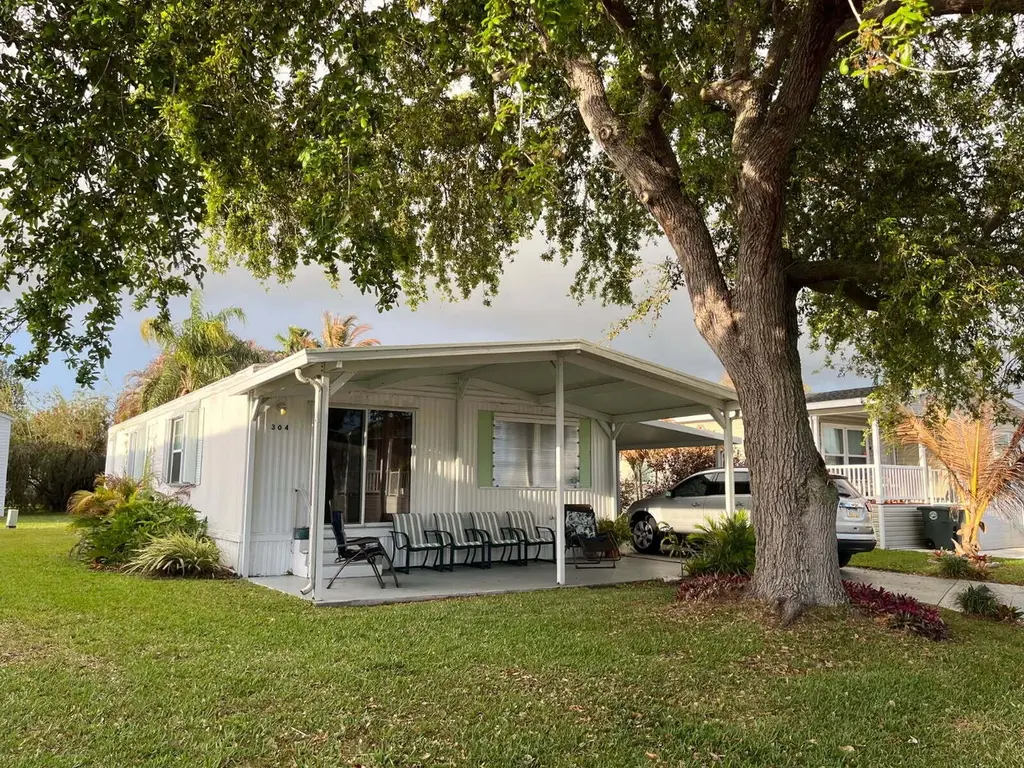
304 Mockingbird Ave · Fort Pierce, FL
Flood risk 1/10 · Minimal
- FEMA flood zone
- X (unshaded)
- Chance of flooding over 30 yrs
- 0.0%
- Est. flood insurance / yr
- $507 – $1,088
Fire risk 3/10 · Minor
- Est. fire insurance / yr
- $947 – $1,759
Heat risk 10/10 · Severe
- Hot days now (above 106°F)
- 7 days/yr
- Hot days in 30 yrs
- 25 days/yr
Wind risk 10/10 · Severe
- Chance of severe wind over 30 yrs
- 99.0%
Air-quality risk 2/10 · Minimal
- Unhealthy air days now
- 1 days/yr
- Unhealthy air days in 30 yrs
- 1 days/yr
Risk factors via First Street. Map © Google.
Why this score? — see what drove the D+ grade
The composite is a weighted blend of 9 inputs, each scored 0–100. Each bar is that input's sub-score; the figure is the points it added to the 100-point composite (weight × sub-score).
- Cash flow +15.0/30.0
- ARV discount +7.5/15.0
- 1% rule +5.0/10.0
- DSCR +5.0/10.0
- Rent growth +4.4/5.0
- Livability +3.8/5.0
- Condition / age +3.8/5.0
- Schools +3.7/10.0
- Appreciation +0.0/10.0
$49,900
🖨 Deal sheet (PDF) 📄 Offer letter ✓ Due diligence
Multi-family units
County records classify this as Multi-Family (5+ Unit). Listing-text estimate: 1 unit. estimate disagrees with records
5+ unit building — per-unit beds/baths from public records are typically unavailable; the breakdown below (if shown) is an estimate from the listing text.
Listing remarks
Manufacturer home that as ben remodeled and well taken care of. Painted, insulated, new carpet and 16' toliets. New washer that stays with the property. It has been powerwashed and a vapor barrier underneath. Ready to move in! Beautiful home! You won't be disappointed.
Key facts
- 2 parking spots
- Community pool
- Built 1977
Property features AI
Finance
- Financial info: Pets allowed with number and size limits
- HOA & community: Has association; Monthly HOA dues; Community amenities: clubhouse, fitness center, laundry, community room, heated pool
Exterior
- Parking: Attached carport; Carport with 2 covered spaces
- Security: Gated community
- Utilities: Public water; Public sewer; Cable available; Electricity available; Phone available; Sewer connected; Water connected
- Home design: Manufactured home; One story; Resale property; Faces east
- Construction: Vinyl siding; Flat metal roof; Built as a single-story structure
- Exterior features: Not waterfront
Interior
- Kitchen: Dishwasher; Electric range; Microwave; Refrigerator
- Bedrooms: 2 main level bedrooms
- Flooring: Carpet; Laminate
- Bathrooms: 2 full bathrooms
- Heating & cooling: Central heating; Central air; Ceiling fan(s)
- Interior features: Electric water heater; Dishwasher; Electric range; Microwave; Refrigerator
- Laundry & utility: Laundry located in carport
Neighborhood map
What this means for you Summary
Snapshot
- This is a 2-bed/2.0-bath multifamily listed at $50k. Condition is rated good.
Deal economics
- At list price, monthly cash flow is $1k ($15k/yr) — positive.
- The deal already cash-flows at list — no discount required.
- Meets the 1% rule at list price ($3k rent vs $50k).
- Recommended offer: $47k (6.0% below list) — sets the bar for market timing.
- Cap rate 35.5% vs local median 3.7% in Fort Pierce — top-decile yield for the area; either an underpriced asset or a hidden risk that comps aren't pricing in. Stress-test before assuming the spread holds.
Location & tenants
- Location reads 76/100 on livability (#226 in FL, #3,360 nationally) — a middle-class / working-renter tenant base. Strengths: commute A+, cost of living A+, housing A+; Watch: crime D+, schools D, amenities F.
- St. Lucie (urban): math 40% / reading 48% proficiency, ranked #51 of 73 in FL (top 70%) — families likely to look elsewhere, expect single-tenant / working-renter base with shorter leases.
- Market conditions: Rents rising fast (+7.4%/yr); 336 active listings in the ZIP; 30 comparable units currently listed for rent nearby; rentals at typical pace (median 25d on market — plan ~3-4 weeks tenant-placement turnaround); 4,868 units permitted in St. Lucie County in 2024 (268 in 5+ unit buildings).
- At $2,953/mo this rent would consume 66% of the median local household income ($54k/yr) (locally 1086% of renters already pay >50% of income on rent) — very limited rent-growth headroom before tenants either downsize or default.
Forward outlook
- Local home prices are declining (-3.0%/yr); year-one equity from $345 of loan paydown is wiped out by about $1k of value loss. Plan a longer hold.
- St. Lucie County population projected at +20% by 2050 — long-run rental-demand tailwind backs the buy-and-hold thesis.
- At projected returns (-3.0% appreciation + 7.4% rent growth), your $14k cash investment doubles in ~2 years — after that, you're playing with house money.
Negotiation context
- It's been on market 77 days — a 6% lower offer ($47k) is reasonable based on typical stale-listing flexibility.
- 3 sale attempts; this cycle's ask has dropped $5k (9%) from the opening price — seller is motivated, your offer sets the floor, not the list.
Risks & watch-outs
- Watch-outs: HOA is 26% of rent.
- Climate carrying-cost: severe wind risk, 99% chance of damaging wind over 30y; extreme-heat days projected 7→25/yr by 2055 (HVAC capex compounding) — expect insurance premiums to compound above CPI over the hold.
Questions for the listing agent
- It's been on market 77 days. Have you received any prior offers? Is the seller open to a 6% concession, seller financing, or rate buy-down credit?
- Built in 1977 — when were the roof, HVAC, electrical panel, plumbing, and water heater last replaced?
- What does the HOA fee cover, when was the last increase, and are there any pending special assessments or reserve-fund shortfalls?
- Why hasn't it sold? Are there any deal-killer items the seller is aware of (foundation, flood, title, zoning, code violations)?
- Is there a deadline driving the sale (1031 exchange, divorce, estate, relocation)? That informs how much negotiation room exists.
- Schools are D-rated, which usually means shorter tenancies and higher turnover. Who's the typical renter profile here, and what's been the actual vacancy rate?
- Crime grade is D in this area — have there been break-ins, vandalism, or insurance claims at this property in the last 3 years? What carrier currently insures it and at what premium?
- The area grade is low — what's the realistic commute time and amenity access for the typical tenant pool here? Any planned neighborhood developments (good or bad) we should know about?
- What's the average days-on-market for RENTAL listings here right now (not sales)? A rising rental-DOM trend means longer vacancies and softer asking-rent achievability than the comps imply.
- What's the recent tenant-quality profile in this submarket — average credit score on applications, eviction rate, late-payment / NSF rate, and stable-employment percentage? A property-management company in the area should have these aggregated.
- How much new apartment / multifamily construction is in the pipeline within 1–3 miles? Heavy new supply (>2% of stock underway) typically softens rents 12–24 months out; light construction supports rent growth.
Investment metrics
- 1% rule
- 5.92% ✓
- Cap rate
- 35.46%
- Cash-on-cash
- 104.18%
- DSCR
- 5.64
- GRM
- 1.4
CMA / ARV
No comps found within radius.
Projected returns pro-forma
-3.0% appreciation · 7.42% rent growth · sell at horizon
- IRR
- —
- Equity multiple
- 6.97×
- Total profit
- $83,410
- Equity at exit
- $7,440
- IRR
- —
- Equity multiple
- 17.88×
- Total profit
- $235,903
- Equity at exit
- $4,314
Cash invested: $13,972 (down + closing). Projections, not guarantees.
Landlord ↔ Tenant lean methodology
- Overall (STATE)
- 87 Strongly Landlord-Friendly
- State Florida
- 87 Strongly Landlord-Friendly · R+3
- County
- — inherits STATE
- City
- — inherits STATE
ZIP-level market 34982
- Home prices YoY
- -33.4%
- Rents YoY
- 7.4%
- Active inventory
- 336
- Price-to-rent
- 2.8×
Monthly cashflow live
- Estimated rent
- $2,953 high interval (Pro) →
- Mortgage (P&I)
- −$262
- Tax est. 1.5%
- −$62 /mo · $748/yr
- Insurance
- −$21
- HOA
- −$775
- Vacancy / Maint / Mgmt
- −$620
- Net cashflow
- $1,213
Break-even live
Sensitivity live
| Price | -10% $1,248 | -5% $1,230 | +0% $1,213 | +5% $1,196 | +10% $1,179 |
|---|---|---|---|---|---|
| Rent | -10% $980 | -5% $1,096 | +0% $1,213 | +5% $1,330 | +10% $1,446 |
| Rate | -1.0pp $1,238 | -0.5pp $1,226 | base $1,213 | +0.5pp $1,200 | +1.0pp $1,187 |
2-unit breakdown (identical units grouped — click to expand)
| Units | Beds | Baths | Est. rent |
|---|---|---|---|
| 2× units | 2 | 1 | $2,954 |
| #1 | 2 | 1 | $1,477 |
| #2 | 2 | 1 | $1,477 |
| Total (2 units) | $2,953 | ||
UW: 25.0% down · 7.5% · 30yr · 1.5% tax · 5.0% vac · 8.0% maint · 8.0% mgmt
Financing live
Cash to close
- Down payment
- $12,475
- Closing costs
- $1,497
- Reserves months
- —
- Total cash needed
- —
Loan-product check · same deal, 3 products live
Conventional
25% down · 7.5% · 30yr
- Down + closing
- —
- Monthly P&I
- —
- Monthly cashflow
- —
- DSCR
- —
- Eligible?
- —
Personal DTI + credit; lowest rate.
DSCR
20% down · 8.5% · 30yr
- Down + closing
- —
- Monthly P&I
- —
- Monthly cashflow
- —
- DSCR
- —
- Eligible?
- —
No personal income docs; deal must DSCR.
Hard money
10% down · 12.0% · 12mo
- Down + closing
- —
- Monthly P&I
- —
- Monthly cashflow
- —
- DSCR
- —
- Eligible?
- —
Short-term bridge; refi at stabilization.
Rent comps 30 comps
| Address | Beds | Baths | Sqft | Rent | $/sqft | DOM | Units | Dist |
|---|---|---|---|---|---|---|---|---|
| 3200 S US Highway 1 Fort Pierce, FL | 2.0–3.0 | 1.0–2.0 | 1144 | $1,509 | $1.32 | 15d | 1 | 0.12mi |
| 1772 N Dovetail Dr Unit C Fort Pierce, FL | 2.0 | 2.0 | 1230 | $2,100 | $1.71 | 24d | 1 | 0.17mi |
| 1804 Blue Heron Ln Unit C Fort Pierce, FL | 2.0 | 2.0 | 1286 | $1,900 | $1.48 | 24d | 1 | 0.20mi |
| 1747 N Dovetail Dr Unit A Fort Pierce, FL | 2.0 | 2.0 | 1286 | $2,100 | $1.63 | 24d | 1 | 0.21mi |
| 1739 N Dovetail Dr Fort Pierce, FL | 2.0 | 2.0 | 1230 | $1,750 | $1.42 | 24d | 1 | 0.24mi |
| 1829 Sandhill Crane Dr Unit B2 Fort Pierce, FL | 2.0 | 2.0 | 1334 | $2,000 | $1.50 | 24d | 1 | 0.36mi |
| 3030 S US Highway 1 Fort Pierce, FL | 3.0 | 2.0 | 1184 | $1,774 | $1.50 | 15d | 1 | 0.39mi |
| 916 Savannas Point Dr Fort Pierce, FL | 2.0 | 2.0 | 1120 | $2,100 | $1.88 | 15d | 1 | 0.54mi |
| 605 Ixoria Ave Fort Pierce, FL | 2.0 | 2.0 | 744 | $1,450 | $1.95 | 15d | 2 | 0.61mi |
| 605 Ixoria Ave #15 Fort Pierce, FL | 2.0 | 2.0 | 744 | $1,500 | $2.02 | 24d | 1 | 0.64mi |
| 410 Palm Ave Apt B Fort Pierce, FL | 2.0 | 1.0 | 800 | $1,400 | $1.75 | 15d | 1 | 0.66mi |
| 617 Ixoria Ave Unit 2A Fort Pierce, FL | 2.0 | 2.5 | 764 | $1,500 | $1.96 | 24d | 1 | 0.69mi |
| 115 Maple Ave Fort Pierce, FL | 3.0 | 1.0 | 1008 | $1,999 | $1.98 | 24d | 1 | 0.72mi |
| 2625 Heathcote Dr Unit 2631 Fort Pierce, FL | 2.0 | 2.0 | 1000 | $1,700 | $1.70 | 15d | 1 | 0.74mi |
| 2625 Heathcote Dr Unit 2623 Fort Pierce, FL | 2.0 | 2.0 | 1000 | $1,700 | $1.70 | 24d | 1 | 0.74mi |
| 2625 Heathcote Dr Unit 2647 Fort Pierce, FL | 2.0 | 2.0 | 1000 | $1,700 | $1.70 | 22d | 1 | 0.74mi |
| 322 Colony Ln Unit C Fort Pierce, FL | 1.0 | 1.5 | 816 | $1,375 | $1.69 | 24d | 1 | 0.74mi |
| 800 Kanner Dr Unit B Fort Pierce, FL | 2.0 | 1.0 | 900 | $1,550 | $1.72 | 15d | 1 | 0.79mi |
| 802 N Lake Dr Unit B Fort Pierce, FL | 2.0 | 1.0 | 1000 | $1,550 | $1.55 | 24d | 1 | 0.85mi |
| 1219 S Lakes End Dr Unit 2 Fort Pierce, FL | 2.0 | 2.0 | 1186 | $1,500 | $1.26 | 15d | 1 | 0.85mi |
| 3300 S 7th St Unit B Fort Pierce, FL | 2.0 | 1.0 | 800 | $1,595 | $1.99 | 24d | 1 | 0.87mi |
| 2902 Oleander Blvd Fort Pierce, FL | 3.0 | 2.0 | 1276 | $2,700 | $2.12 | 24d | 1 | 0.87mi |
| 928 Fra Mar Pl Fort Pierce, FL | 3.0 | 1.0 | 1440 | $2,000 | $1.39 | 24d | 1 | 1.07mi |
| 947 Fra Mar Pl Fort Pierce, FL | 2.0 | 1.0 | 768 | $1,700 | $2.21 | 24d | 1 | 1.13mi |
| 2050 Oleander Blvd Unit 703 Fort Pierce, FL | 2.0 | 2.0 | 1014 | $1,800 | $1.78 | 24d | 1 | 1.27mi |
| 2016 Golfview Ct Fort Pierce, FL | 2.0 | 1.0 | 1055 | $1,750 | $1.66 | 24d | 1 | 1.27mi |
| 2302 Sunrise Blvd #201 Fort Pierce, FL | 2.0 | 1.0 | 966 | $1,500 | $1.55 | 24d | 1 | 1.38mi |
| 4166 Gator Trace Villas Cir Unit B Fort Pierce, FL | 3.0 | 2.0 | 1336 | $2,200 | $1.65 | 24d | 1 | 1.40mi |
| 2050 Oleander Blvd Fort Pierce, FL | 1.0–2.0 | 1.0–2.0 | 833 | $2,350 | $2.82 | 24d | 4 | 1.42mi |
| 2016 S 10th St Unit A Fort Pierce, FL | 2.0 | 2.5 | 1120 | $1,595 | $1.42 | 24d | 1 | 1.43mi |
HOA detail
- Monthly dues
- $775 · $9,300/yr
Listing history 20 events
-
2026-06-15status $49,900 Pending 77 DOM
-
2026-06-15days on market $49,900 Active 77 DOM
-
2026-06-14days on market $49,900 Active 75 DOM
-
2026-06-13days on market $49,900 Active 74 DOM
-
2026-06-10days on market $49,900 Active 72 DOM
-
2026-06-09days on market $49,900 Active 71 DOM
-
2026-06-08days on market $49,900 Active 70 DOM
-
2026-06-07days on market $49,900 Active 69 DOM
-
2026-06-05days on market $49,900 Active 66 DOM
-
2026-06-03days on market $49,900 Active 65 DOM
-
2026-06-02days on market $49,900 Active 64 DOM
-
2026-06-01days on market $49,900 Active 63 DOM
-
2026-05-31days on market $49,900 Active 62 DOM
-
2026-05-30days on market $49,900 Active 61 DOM
-
2026-04-18price $49,900
-
2026-03-30historical
-
2026-03-27$55,000 Active
-
2026-03-20historical $55,000
-
2026-03-20$55,000
-
2026-03-20$55,000 Active
ⓘ Source: listings_history table (triggers on properties + properties_extension) + one-shot
backfill from property_details.listing_events for pre-trigger history.
Climate risk First Street
- Flood 1/10 Low FEMA zone X (unshaded) · 0% chance over 30 yrs
- Wildfire 3/10 Moderate
- Heat 10/10 Extreme 7 d/yr ≥106°F today · 25 d/yr by 30 yrs out
- Wind 10/10 Extreme 99% chance of damaging wind over 30 yrs
- Air quality 2/10 Low 1 unhealthy d/yr today · 1 by 30 yrs out
Nearby sold comps map
Loading sold comps map…
Walkable amenities ~0.75 mi
Loading nearby amenities…
Taxation est. · year 1
- Rental income
- $35,436
- − Mortgage interest
- −$2,795
- − Property taxes
- −$748
- − Insurance
- −$250
- − Repairs & maintenance
- −$2,835
- − Management
- −$2,835
- − HOA
- −$9,300
- − Depreciation
- −$1,452
- Taxable income
- $15,221
- Est. tax owed @ 24.0%
- −$3,653
- After-tax cash flow
- $10,903/yr
For passive investors: Depreciation is non-cash, so a rental often shows a tax loss while cash-flowing — sheltering income. Rental losses are passive: they offset passive income freely, and up to $25,000/yr can offset ordinary (W-2) income if you actively participate and your MAGI is under $100k (phasing out to $0 by $150k); unused losses carry forward. On sale, claimed depreciation is recaptured at up to 25%, and gains may owe capital-gains tax (a 1031 exchange can defer both). Figures are a year-1 estimate at your 24.0% rate — not tax advice; consult a CPA.
Condition & rehab AI · 13 photos
This multi-family home is in good condition with cosmetic updates, ready for move-in. It offers a good balance of curb appeal and interior updates, making it an attractive investment.
Value-add opportunities
- Both paint exterior — enhances curb appeal and resale value
- Both replace carpet — improves comfort and rental appeal
- Both update kitchen appliances — enhances functionality and resale value
Renovation cost estimate screening
Value-add ROI direction
- Both paint exterior — enhances curb appeal and resale value ↑
- Both replace carpet — improves comfort and rental appeal ↑
- Both update kitchen appliances — enhances functionality and resale value ↑
ⓘ Cost ranges are severity-bucket heuristics (US national rule-of-thumb). Get contractor quotes + a written scope before underwriting a rehab budget.
Schools (NCES district)
- District
- St. Lucie
- NCES district ID
- 1201770
- Math proficiency
- 40% ▼ -11.00%
- Reading proficiency
- 48% ▼ -4.00%
- Median HH income
- $44,737
- Composite
- 37.28/100
- National rank
- #4449
- State rank
- #51 of 73 in FL
Livability — Fort Pierce
- Score
- 76/100
- State rank
- #226
- US rank
- #3360
Category grades
Schools grade is shown separately in the Schools card above.
Census & demographics
- Census place
- Fort Pierce, FL
- County
- Saint Lucie County · 337,150 people
- City population
- 78,556
- Metro
- Port St. Lucie, FL
- Population (ZIP)
- 31,143
- Household income
- $54,082
- Rent vs Own
- Severe rent burden
- 1086.0
Population outlook (St. Lucie County) Hauer SSP2
- Today (2025)
- 338,016 people
- By 2030
- 355,687 · +5.2%
- By 2040
- 385,521 · +14.1%
- By 2050
- 406,106 · +20.1%
- By 2075
- 441,054 · +30.5%
- By 2100
- 436,885 · +29.2%
Race, ethnicity, and origin ACS 2023
- Neighborhood character
- Majority White (62%)
- Race & ethnicity
- White 62% Hispanic / Latino 22% Two or more races 12% Black 12%
- Hispanic origin (detail)
- Mexican 10% Puerto Rican 3% Cuban 3%
- Common ancestry
- Italian 7% Hispanic 2% Lithuanian 1%
- Foreign-born
- 12% · Canada
- Languages at home
- 80% English-only · Spanish 16% French/Haitian/Cajun 3%
Political lean MEDSL · St. Lucie
- 2024 margin
- Lean R (+9.1) · D 45.1% · R 54.2%
- 2008→2024 swing
- -21.2pp toward R · 2008: 12.1pp · 2024: -9.1pp
- All cycles
- 2024: R+9.1 2020: R+1.6 2016: R+2.5 2012: D+7.9 2008: D+12.1
Not yet ingested
- Civics
- —
Market trends
- HPI YoY
- ▼ -199.47%
- Current HPI
- 397.2649
- Rent YoY
- ▲ 7.42%
- Metro
- Port St. Lucie, FL
- State GDP YoY
- ▲ 3.28%
- F500 in state
- 36
Industry mix (Fortune 500 HQ in FL)
| Industry | F500 HQs | Revenue |
|---|---|---|
| Industrial Technology | 2 | $29B |
|
||
| Insurance | 2 | $17B |
|
||
| Retail | 1 | $60B |
|
||
| Technology Distribution | 1 | $58B |
|
||
| Homebuilding | 1 | $35B |
|
||
| Technology Manufacturing | 1 | $35B |
|
||
Price history
-9.3% since first listed6 events — show timeline
- 2026-04-18 Price Changed $49,900 Beaches MLS
- 2026-03-30 Listing Removed — Beaches MLS
- 2026-03-27 Listed $55,000 Beaches MLS
- 2026-03-20 Rental Removed $55,000 GFLMLS
- 2026-03-20 Listed for Rent $55,000 GFLMLS
- 2026-03-20 Listed $55,000 Beaches MLS
Cash-flow waterfall
monthlySold comps — $/sqft
last 12 mo · ≤1 miLoading sold comps…