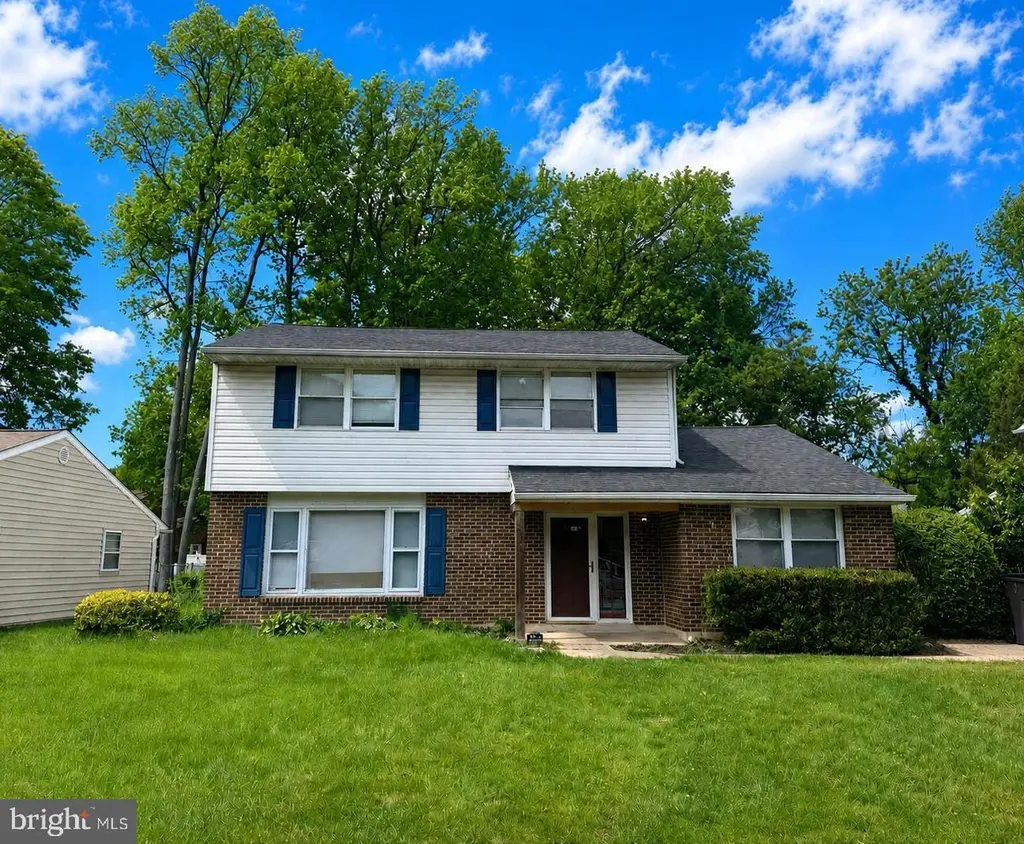
93 S Skyward Dr · Brookside, DE
Flood risk 1/10 · Minimal
- FEMA flood zone
- X (unshaded)
- Chance of flooding over 30 yrs
- 0.0%
- Est. flood insurance / yr
- $507 – $1,088
Fire risk 1/10 · Minimal
- Est. fire insurance / yr
- $476 – $884
Heat risk 7/10 · Major
- Hot days now (above 104°F)
- 7 days/yr
- Hot days in 30 yrs
- 15 days/yr
Wind risk 6/10 · Moderate
- Chance of severe wind over 30 yrs
- 27.0%
Air-quality risk 3/10 · Minor
- Unhealthy air days now
- 2 days/yr
- Unhealthy air days in 30 yrs
- 3 days/yr
Risk factors via First Street. Map © Google.
Why this score? — see what drove the C grade
The composite is a weighted blend of 9 inputs, each scored 0–100. Each bar is that input's sub-score; the figure is the points it added to the 100-point composite (weight × sub-score).
- Cash flow +20.0/30.0
- ARV discount +15.0/15.0
- DSCR +6.3/10.0
- 1% rule +4.0/10.0
- Livability +3.5/5.0
- Rent growth +2.5/5.0
- Schools +2.5/10.0
- Condition / age +2.5/5.0
- Appreciation +0.0/10.0
$290,000
🖨 Deal sheet 📄 Offer letter ✓ Due diligence
Listing remarks MLS
:House is being offered for sale under the Freddie Mac first look initiative through 02/06/2012. Owner occupants, non profits, nsp grantees and community development organizations are eligible at this time. Investors and second home purchasers may submit offers at any time, however, the offers will not be considered for negotiation until after the 15 day period. House SHOWS VERY WELL. * * * * CONTRACT PENDING * * * * *
Key facts
- 9,148 sq ft lot
- Built 1974
- Listed 10 days
Property features AI
Exterior
- Parking: Driveway parking
- Utilities: Public water; Public sewer; Natural gas hot water; Electric heating and cooling; Municipal trash service
- Home design: Detached property; Very good condition; Fee simple ownership
- Construction: Brick and vinyl siding exterior; Shingle roof; Slab foundation; Building not winterized; Pets allowed with no restrictions; Year built per assessor
- Exterior features: Paved driveway; Lot dimensions approximately 71.5 x 140.3
Interior
- Kitchen: Oven (single); Microwave; Refrigerator; Dishwasher
- Bedrooms: Three bedrooms on the upper level
- Bathrooms: One full bathroom (upper level); One half bathroom (main level)
- Heating & cooling: Forced air heating (electric); Central air conditioning (electric)
- Interior features: Ceiling fan(s); Accessible doors 32+ inches wide
- Laundry & utility: Washer and dryer; Has laundry
Neighborhood map
What this means for you Summary
Snapshot
- This is a 4-bed/1.5-bath single-family listed at $290k.
Deal economics
- At list price, monthly cash flow is $356 ($4k/yr) — positive.
- The deal already cash-flows at list — no discount required.
- To meet the 1% rule (rent ≥ 1% of price), the offer needs to be $261k (10.0% below list).
- Recommended offer: $261k (10.0% below list) — sets the bar for 1% rule.
- Cap rate 7.8% vs local median 5.0% in Brookside — top-decile yield for the area; either an underpriced asset or a hidden risk that comps aren't pricing in. Stress-test before assuming the spread holds.
Location & tenants
- Location reads 69/100 on livability (#28 in DE) — a middle-class / working-renter tenant base. Strengths: cost of living A+, housing A+, health & safety B; Watch: crime C-, amenities F, commute F.
- Christina School District (suburban): math 22% / reading 33% proficiency, ranked #18 of 26 in DE (top 69%) — low school quality limits family demand, transient renter base, plan for 1-2y turnover.
- Zoned schools: Smith (Jennie E.) Elementary School (math 17% / reading 27%, grade F, #70 of 105 statewide, top 70%, 456 students, 0% FRL); Gauger-Cobbs Middle School (math 11% / reading 26%, grade F, #30 of 36 statewide, top 86%, 779 students, 0% FRL); Newark High School (math 27% / reading 42%, grade F, #18 of 40 statewide, top 49%, 1,105 students, 0% FRL) — zoned schools average 0% FRL vs 50% district-wide (50 pts lower); this property's tenant base skews higher-income than the district average.
- Market conditions: 74 active listings in the ZIP; 13 comparable units currently listed for rent nearby; rentals at typical pace (median 24d on market — plan ~3-4 weeks tenant-placement turnaround); solid renter incomes; 1,367 units permitted in New Castle County in 2024 (201 in 5+ unit buildings).
- This rent runs 41% of the median local income ($76k/yr) — at the standard rent-burdened threshold; future hikes will face affordability resistance.
Forward outlook
- Local home prices are declining (-3.0%/yr); year-one equity from $2k of loan paydown is wiped out by about $9k of value loss. Plan a longer hold.
- New Castle County population projected at +9% by 2050 — modest demand growth; plan on rents tracking national, not racing it.
Negotiation context
- Only 10 days on market — expect competitive offers; lowballing is unlikely to land.
- 5 sale attempts since 32y ago; this cycle's ask has dropped $20k (6%) from the opening price — seller is motivated, your offer sets the floor, not the list.
Risks & watch-outs
- Climate carrying-cost: major wind risk, 27% chance of damaging wind over 30y; extreme-heat days projected 7→15/yr by 2055 (HVAC capex compounding) — expect insurance premiums to compound above CPI over the hold.
Questions for the listing agent
- Built in 1974 — when were the roof, HVAC, electrical panel, plumbing, and water heater last replaced?
- Is there a deadline driving the sale (1031 exchange, divorce, estate, relocation)? That informs how much negotiation room exists.
- Schools are A-rated — typically a magnet for longer-tenancy family renters. What's the average tenant stay here, and is there a school-zone premium baked into asking?
- What's the average days-on-market for RENTAL listings here right now (not sales)? A rising rental-DOM trend means longer vacancies and softer asking-rent achievability than the comps imply.
- What's the recent tenant-quality profile in this submarket — average credit score on applications, eviction rate, late-payment / NSF rate, and stable-employment percentage? A property-management company in the area should have these aggregated.
- How much new for-sale + rental construction is in the pipeline within 1–3 miles? Heavy new supply typically softens prices + rents 12–24 months out; constrained supply supports both.
Investment metrics
- 1% rule
- 0.90% ✗
- Cap rate
- 7.77%
- Cash-on-cash
- 5.26%
- DSCR
- 1.23
- GRM
- 9.3
CMA / ARV
- ARV (median comp)
- $363,471
- List price
- $290,000
- Delta
- -20.21%
- Verdict
- UNDERPRICED
- Comps
- 20 within 1.0 mi
Show comp detail 12 sales within ~0.75 mi
| Address | Dist | Beds/Ba | Sqft | Sold | Price | $/sf | Match |
|---|---|---|---|---|---|---|---|
| 93 S Skyward Dr | 0.00mi | 3/1.5 (-1) | 1,775 (0%) | 0mo | $275,000 | $155 | 95 |
| 46 Upland Ct | 0.11mi | 4/2.0 | 1,775 (0%) | 6mo | $395,000 | $223 | 88 |
| 11 N Skyward Dr | 0.11mi | 4/2.0 | 1,692 (-5%) | 1mo | $417,000 | $246 | 84 |
| 29 N Skyward Dr | 0.18mi | 3/1.5 (-1) | 1,700 (-4%) | 7mo | $375,000 | $221 | 74 |
| 884 Broadfield Dr | 0.36mi | 3/1.0 (-1) | 1,600 (-10%) | 1mo | $380,000 | $238 | 59 |
| 871 Broadfield Dr | 0.41mi | 3/1.0 (-1) | 1,600 (-10%) | 3mo | $350,000 | $219 | 55 |
| 59 E Shady Dr | 0.42mi | 4/2.0 | 1,550 (-13%) | 6mo | $420,000 | $271 | 53 |
| 209 Warfield Rd | 0.43mi | 3/2.0 (-1) | 1,600 (-10%) | 7mo | $405,000 | $253 | 51 |
| 10 Monterry Dr | 0.69mi | 3/3.0 (-1) | 1,700 (-4%) | 1mo | $235,000 | $138 | 49 |
| 183 Brookside Blvd | 0.73mi | 3/2.0 (-1) | 1,700 (-4%) | 5mo | $380,000 | $224 | 48 |
| 17 Pearson Dr | 0.60mi | 4/3.0 | 2,040 (+15%) | 1mo | $410,000 | $201 | 40 |
| 107 Anderson Rd | 0.64mi | 3/2.0 (-1) | 1,975 (+11%) | 5mo | $374,500 | $190 | 40 |
Match score weights: distance 35% · size 25% · config 20% · recency 20%. Top-matched comps best support the ARV.
Projected returns pro-forma
-3.0% appreciation · 3.0% rent growth · sell at horizon
- IRR
- -8.2%
- Equity multiple
- 0.70×
- Total profit
- $-24,448
- Equity at exit
- $43,240
- IRR
- 1.3%
- Equity multiple
- 1.09×
- Total profit
- $7,344
- Equity at exit
- $25,074
Cash invested: $81,200 (down + closing). Projections, not guarantees.
Landlord ↔ Tenant lean methodology
- Overall (STATE)
- 70 Landlord-Friendly
- State Delaware
- 70 Landlord-Friendly · D+7
- County
- — inherits STATE
- City
- — inherits STATE
ZIP-level market 19713
- Active inventory
- 74
- Price-to-rent
- 9.3×
Monthly cashflow live
- Estimated rent
- $2,611 high interval (Pro) →
- Mortgage (P&I)
- −$1,521
- Tax from tax record
- −$65 /mo · $781/yr
- Insurance
- −$121
- HOA
- −$0
- Vacancy / Maint / Mgmt
- −$548
- Net cashflow
- $356
Break-even live
UW: 25.0% down · 7.5% · 30yr · 1.5% tax · 5.0% vac · 8.0% maint · 8.0% mgmt
Financing live
Cash to close
- Down payment
- $72,500
- Closing costs
- $8,700
- Reserves months
- —
- Total cash needed
- —
Loan-product check · same deal, 3 products live
Conventional
25% down · 7.5% · 30yr
- Down + closing
- —
- Monthly P&I
- —
- Monthly cashflow
- —
- DSCR
- —
- Eligible?
- —
Personal DTI + credit; lowest rate.
DSCR
20% down · 8.5% · 30yr
- Down + closing
- —
- Monthly P&I
- —
- Monthly cashflow
- —
- DSCR
- —
- Eligible?
- —
No personal income docs; deal must DSCR.
Hard money
10% down · 12.0% · 12mo
- Down + closing
- —
- Monthly P&I
- —
- Monthly cashflow
- —
- DSCR
- —
- Eligible?
- —
Short-term bridge; refi at stabilization.
Rent comps 13 comps
| Address | Beds | Baths | Sqft | Rent | $/sqft | DOM | Units | Dist |
|---|---|---|---|---|---|---|---|---|
| 31 N Skyward Dr Newark, DE | 3.0 | 1.5 | 1700 | $2,400 | $1.41 | 5d | 1 | 0.17mi |
| 600 Judy Way Newark, DE | 3.0 | 2.5 | 2025 | $2,900 | $1.43 | 43d | 1 | 0.33mi |
| 329 Theodora Way Newark, DE | 3.0 | 2.5 | 2325 | $3,100 | $1.33 | 18d | 1 | 0.35mi |
| 18 Montrose Dr Newark, DE | 4.0 | 3.0 | 1500 | $5,000 | $3.33 | 43d | 1 | 0.63mi |
| 1021 Richfield Rd Newark, DE | 4.0 | 2.0 | 2470 | $2,800 | $1.13 | 4d | 1 | 1.06mi |
| 225 Brennen Dr Newark, DE | 3.0 | 1.0 | 1325 | $2,200 | $1.66 | 43d | 1 | 1.08mi |
| 28 Keith St Newark, DE | 4.0 | 1.5 | 1375 | $1,750 | $1.27 | 43d | 1 | 1.22mi |
| 1 Waltham St Newark, DE | 4.0 | 1.5 | 1452 | $2,250 | $1.55 | 4d | 1 | 1.32mi |
| 8 Midland Dr Newark, DE | 3.0 | 2.0 | 1500 | $2,895 | $1.93 | 17d | 1 | 1.35mi |
| 5 Farnsworth Rd Newark, DE | 4.0 | 2.0 | 1700 | $2,500 | $1.47 | 24d | 1 | 1.35mi |
| 71 Alexis Dr Newark, DE | 3.0 | 4.0 | 1700 | $2,400 | $1.41 | 5d | 1 | 1.47mi |
| 68 Alexis Dr Newark, DE | 3.0 | 2.5 | 2325 | $2,500 | $1.08 | 24d | 1 | 1.48mi |
| 1020 S Gerald Dr Newark, DE | 5.0 | 1.0 | 1550 | $2,650 | $1.71 | 24d | 1 | 1.50mi |
Listing history 15 events
-
2026-05-18price $290,000 1112-char remark
-
2026-05-13$310,000 Active 1112-char remark
-
2026-05-11historical $310,000 1112-char remark
-
2012-06-18soldstatus $160,000 413-char remark
Show marketing remark (413 chars)
:House is being offered for sale under the Freddie Mac first look initiative through 02/06/2012. Owner occupants, non profits, nsp grantees and community development organizations are eligible at this time. Investors and second home purchasers may submit offers at any time, however, the offers will not be considered for negotiation until after the 15 day period. House SHOWS VERY WELL. ****CONTRACT PENDING*****
-
2012-06-18soldstatus $160,000
Show marketing remark (413 chars)
:House is being offered for sale under the Freddie Mac first look initiative through 02/06/2012. Owner occupants, non profits, nsp grantees and community development organizations are eligible at this time. Investors and second home purchasers may submit offers at any time, however, the offers will not be considered for negotiation until after the 15 day period. House SHOWS VERY WELL. ****CONTRACT PENDING*****
-
2012-03-07historical
Show marketing remark (429 chars)
:House is being offered for sale under the Freddie Mac first look initiative through 02/06/2012. Owner occupants, non profits, nsp grantees and community development organizations are eligible at this time. Investors and second home purchasers may submit offers at any time, however, the offers will not be considered for negotiation until after the 15 day period. House SHOWS VERY WELL. * * * * CONTRACT PENDING * * * * *
-
2012-01-26$157,500 413-char remark
Show marketing remark (413 chars)
:House is being offered for sale under the Freddie Mac first look initiative through 02/06/2012. Owner occupants, non profits, nsp grantees and community development organizations are eligible at this time. Investors and second home purchasers may submit offers at any time, however, the offers will not be considered for negotiation until after the 15 day period. House SHOWS VERY WELL. ****CONTRACT PENDING*****
-
2012-01-26$157,500
Show marketing remark (413 chars)
:House is being offered for sale under the Freddie Mac first look initiative through 02/06/2012. Owner occupants, non profits, nsp grantees and community development organizations are eligible at this time. Investors and second home purchasers may submit offers at any time, however, the offers will not be considered for negotiation until after the 15 day period. House SHOWS VERY WELL. ****CONTRACT PENDING*****
-
2011-03-23historical
-
2010-09-27$189,900
-
1994-12-14soldstatus $107,850
-
1994-12-01soldstatus $107,850
-
1994-09-15$107,850
-
1989-05-01soldstatus $94,000
-
1984-10-01soldstatus $64,900
ⓘ Source: listings_history table (triggers on properties + properties_extension) + one-shot
backfill from property_details.listing_events for pre-trigger history.
Tax reassessment forecast DE · Partial reset (capped growth)
- Current annual tax
- $781 · $65/mo
- Projected year-2 tax
- $1,232 · $103/mo
- Expected delta
- +$450/yr (+$38/mo · 57.7%)
ⓘ Screening estimate from a state-policy table — verify with the county assessor before closing.
Climate risk First Street
- Flood 1/10 Low FEMA zone X (unshaded) · 0% chance over 30 yrs
- Wildfire 1/10 Low
- Heat 7/10 Severe 7 d/yr ≥104°F today · 15 d/yr by 30 yrs out
- Wind 6/10 Major 27% chance of damaging wind over 30 yrs
- Air quality 3/10 Moderate 2 unhealthy d/yr today · 3 by 30 yrs out
Nearby sold comps map
Loading sold comps map…
Walkable amenities ~0.75 mi
Loading nearby amenities…
Taxation est. · year 1
- Rental income
- $31,336
- − Mortgage interest
- −$16,245
- − Property taxes
- −$781
- − Insurance
- −$1,450
- − Repairs & maintenance
- −$2,507
- − Management
- −$2,507
- − Depreciation
- −$8,436
- Taxable loss
- −$590
- Est. tax savings @ 24.0%
- +$142
- After-tax cash flow
- $4,416/yr
For passive investors: Depreciation is non-cash, so a rental often shows a tax loss while cash-flowing — sheltering income. Rental losses are passive: they offset passive income freely, and up to $25,000/yr can offset ordinary (W-2) income if you actively participate and your MAGI is under $100k (phasing out to $0 by $150k); unused losses carry forward. On sale, claimed depreciation is recaptured at up to 25%, and gains may owe capital-gains tax (a 1031 exchange can defer both). Figures are a year-1 estimate at your 24.0% rate — not tax advice; consult a CPA.
Schools (NCES district)
- District
- Christina School District
- NCES district ID
- 1000200
- Math proficiency
- 22% ▼ -12.00%
- Reading proficiency
- 33% ▼ -5.00%
- Median HH income
- $58,838
- Composite
- 24.93/100
- National rank
- #7567
- State rank
- #18 of 26 in DE
Livability — Brookside
- Score
- 69/100
- State rank
- #28
- US rank
- #8635
Category grades
Schools grade is shown separately in the Schools card above.
Census & demographics
- Census place
- Brookside, DE
- County
- New Castle County · 483,412 people
- City population
- 30,549
- Metro
- Philadelphia-Camden-Wilmington, PA-NJ-DE-MD
- Population (ZIP)
- 30,747
- Household income
- $76,493
- Rent vs Own
- Severe rent burden
- 926.0
Population outlook (New Castle County) Hauer SSP2
- Today (2025)
- 594,686 people
- By 2030
- 609,164 · +2.4%
- By 2040
- 632,154 · +6.3%
- By 2050
- 649,068 · +9.1%
- By 2075
- 687,771 · +15.7%
- By 2100
- 694,961 · +16.9%
Race, ethnicity, and origin ACS 2023
- Neighborhood character
- Diverse neighborhood (Simpson 0.67)
- Race & ethnicity
- White 50% Black 21% Hispanic / Latino 19% Two or more races 12% Asian 6%
- Hispanic origin (detail)
- Mexican 8% Puerto Rican 3% Dominican 2%
- Common ancestry
- Romanian 4% Slovak 1% Lithuanian 1%
- Foreign-born
- 17% · Canada, China, Jamaica
- Languages at home
- 76% English-only · Spanish 15% Chinese 2% Arabic 2%
Political lean MEDSL · New Castle
- 2024 margin
- Solid D (+32.6) · D 65.5% · R 32.9% · Other 1.6%
- 2008→2024 swing
- -8.1pp toward R · 2008: 40.6pp · 2024: 32.6pp
- All cycles
- 2024: D+32.6 2020: D+37.1 2016: D+29.6 2012: D+34.1 2008: D+40.6
Not yet ingested
- Civics
- —
Market trends
- HPI YoY
- ▼ -255.28%
- Current HPI
- 269.969
- Rent YoY
- —
- Metro
- Philadelphia-Camden-Wilmington, PA-NJ-DE-MD
- State GDP YoY
- —
- F500 in state
- 0
Price history
+323.7% since first listed17 events — show timeline
- 2026-06-05 Sold (MLS) $275,000 BRIGHT MLS
- 2026-05-22 Pending — BRIGHT MLS
- 2026-05-18 Price Changed $290,000 BRIGHT MLS
- 2026-05-13 Listed $310,000 BRIGHT MLS
- 2026-05-11 Coming Soon $310,000 BRIGHT MLS
- 2012-06-18 Sold (MLS) $160,000 TREND
- 2012-06-18 Sold (MLS) $160,000 BRIGHT MLS
- 2012-03-07 Listing Removed — BRIGHT MLS
- 2012-01-26 Listed $157,500 TREND
- 2012-01-26 Listed $157,500 BRIGHT MLS
- 2011-03-23 Listing Removed — BRIGHT MLS
- 2010-09-27 Listed $189,900 BRIGHT MLS
- 1994-12-14 Sold (MLS) $107,850 BRIGHT MLS
- 1994-12-01 Sold (Public Records) $107,850 Public Records
- 1994-09-15 Listed $107,850 BRIGHT MLS
- 1989-05-01 Sold (Public Records) $94,000 Public Records
- 1984-10-01 Sold (Public Records) $64,900 Public Records
Property tax history
-6.3%/yrLatest (2024): $781 · +3.2% YoY. Source: county tax records.
Cash-flow waterfall
monthlySold comps — $/sqft
last 12 mo · ≤1 miLoading sold comps…