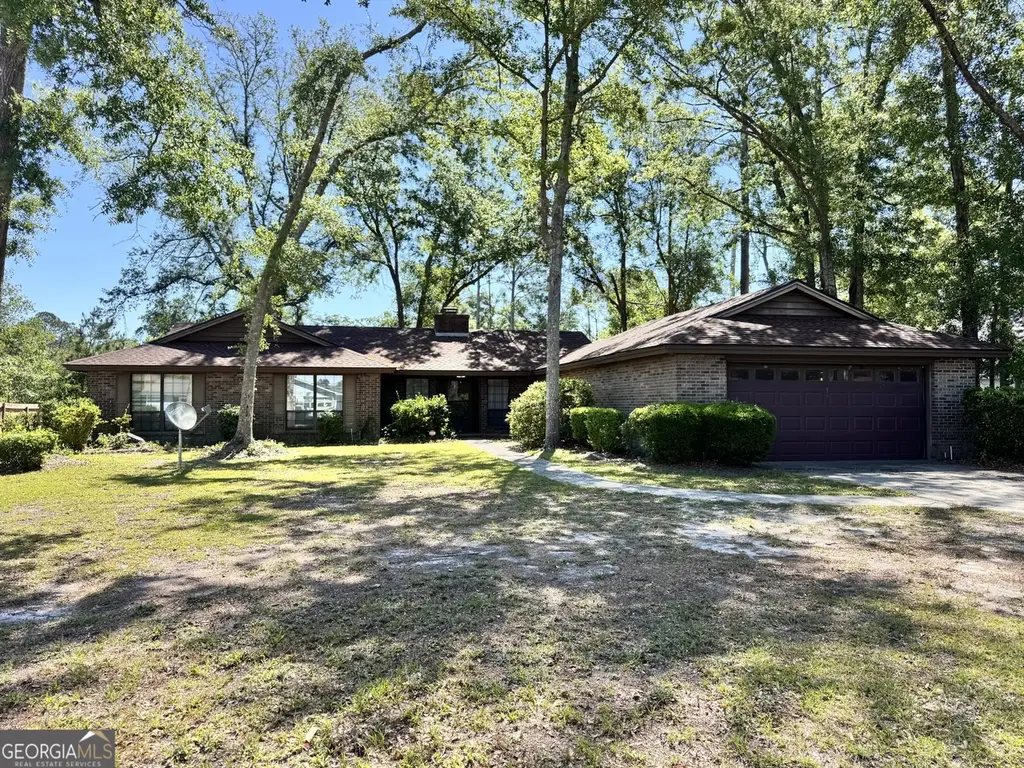
4521 Timberbrook Trl · Valdosta, GA
Flood risk 1/10 · Minimal
- FEMA flood zone
- X (unshaded)
- Chance of flooding over 30 yrs
- 0.0%
- Est. flood insurance / yr
- $507 – $1,088
Fire risk 6/10 · Moderate
- Est. fire insurance / yr
- $963 – $1,789
Heat risk 7/10 · Major
- Hot days now (above 108°F)
- 7 days/yr
- Hot days in 30 yrs
- 19 days/yr
Wind risk 8/10 · Major
- Chance of severe wind over 30 yrs
- 99.0%
Air-quality risk 6/10 · Moderate
- Unhealthy air days now
- 10 days/yr
- Unhealthy air days in 30 yrs
- 11 days/yr
Risk factors via First Street. Map © Google.
Why this score? — see what drove the D grade
The composite is a weighted blend of 9 inputs, each scored 0–100. Each bar is that input's sub-score; the figure is the points it added to the 100-point composite (weight × sub-score).
- ARV discount +15.0/15.0
- Cash flow +8.3/30.0
- Schools +4.7/10.0
- Rent growth +3.5/5.0
- Livability +3.0/5.0
- Condition / age +2.5/5.0
- DSCR +2.3/10.0
- 1% rule +1.8/10.0
- Appreciation +0.0/10.0
$228,000
🖨 Deal sheet 📄 Offer letter ✓ Due diligence
Listing remarks MLS
Welcome to 4521 Timberbrook Trail in Valdosta, GA. This well-kept home offers a comfortable layout, inviting living spaces, and a spacious yard perfect for kids, pets, and gatherings. Tucked in a quiet, established neighborhood with convenient access to town, it's a great place to settle in and feel at home. Don't miss your chance to see it!
Key facts
- Spacious yard
- 0.44 acre lot
- Garage
Tags
Property features AI
Finance
- Other: Estate-owned listing
- HOA & community: No HOA
Exterior
- Parking: Garage
- Utilities: Public water; Public sewer; Cable available; Sewer connected; Insulation (energy efficiency)
- Home design: Single-family house; Single story; Resale property
- Construction: Brick construction; Composition roof; Built in 1983
- Exterior features: Fenced yard; Screened patio/porch
Interior
- Kitchen: Cooktop; Dishwasher; Refrigerator
- Bedrooms: 3 bedrooms, all on the main level
- Flooring: Carpet; Tile
- Bathrooms: 2 full bathrooms, both on the main level
- Heating & cooling: Central heating; Electric heating; Heat pump; Central air conditioning; Electric cooling; Heat pump cooling; Ceiling fans
- Interior features: One-level living; Fireplace; Screened patio/porch
- Laundry & utility: Laundry room (main level)
Neighborhood map
What this means for you Summary
Snapshot
- This is a 3-bed/2.0-bath single-family listed at $228k.
Deal economics
- At list price, monthly cash flow is $-208 ($-2k/yr) — negative.
- To cash-flow at today's rent, offer at most $191k (16.1% below list).
- To meet the 1% rule (rent ≥ 1% of price), the offer needs to be $156k (31.8% below list).
- Recommended offer: $156k (31.8% below list) — sets the bar for 1% rule.
- Cap rate 5.2% vs local median 4.3% in Valdosta — meaningfully above typical; check what's discounted (condition, days-on-market, listing class) to confirm the premium yield is real.
Location & tenants
- Location reads 60/100 on livability (#392 in GA) — a middle-class / working-renter tenant base. Strengths: cost of living A+, health & safety A+, housing A-; Watch: crime F, amenities F, commute F.
- Lowndes County (rural): math 59% / reading 52% proficiency, ranked #8 of 174 in GA (top 5%) — acceptable for families but not a draw, mixed tenant base, ~2y average lease.
- Zoned schools: Westside Elementary School (math 62% / reading 53%, grade C+, #150 of 1,228 statewide, top 12%, 937 students, 41% FRL); Pine Grove Middle School (math 56% / reading 57%, grade B, #48 of 470 statewide, top 10%, 742 students, 50% FRL); Lowndes High School (math 69% / reading 51%, grade C+, #14 of 424 statewide, top 3%, 3,201 students, 39% FRL) — zoned schools at 43% FRL track the district average.
- Market conditions: Rents rising fast (+4.2%/yr); 267 active listings in the ZIP; 1 comparable units currently listed for rent nearby; 896 units permitted in Lowndes County in 2024 (0 in 5+ unit buildings).
- This rent runs 33% of the median local income ($57k/yr) — at the standard rent-burdened threshold; future hikes will face affordability resistance.
Forward outlook
- Local home prices are declining (-3.0%/yr); year-one equity from $2k of loan paydown is wiped out by about $7k of value loss. Plan a longer hold.
- Lowndes County population projected at +10% by 2050 — modest demand growth; plan on rents tracking national, not racing it.
Negotiation context
- It's been on market 35 days — a 3% lower offer ($221k) is reasonable based on typical stale-listing flexibility.
- 2 sale attempts with the ask held roughly flat each time — persistent listings suggest the price (not the market) is what's stuck; bring a comps-based counter.
- Current owner paid $85k; list at $228k implies a 168% gain — meaningful room to come down on a strong offer.
Risks & watch-outs
- Climate carrying-cost: severe wind risk, 99% chance of damaging wind over 30y; major wildfire risk; extreme-heat days projected 7→19/yr by 2055 (HVAC capex compounding) — expect insurance premiums to compound above CPI over the hold.
Questions for the listing agent
- What do current leases actually rent for vs. the listed asking? Can we see a recent rent roll and the last 12 months of T-12 income?
- It's been on market 35 days. Have you received any prior offers? Is the seller open to a 32% concession, seller financing, or rate buy-down credit?
- Is there a deadline driving the sale (1031 exchange, divorce, estate, relocation)? That informs how much negotiation room exists.
- Schools are F-rated, which usually means shorter tenancies and higher turnover. Who's the typical renter profile here, and what's been the actual vacancy rate?
- Crime grade is F in this area — have there been break-ins, vandalism, or insurance claims at this property in the last 3 years? What carrier currently insures it and at what premium?
- The area grade is low — what's the realistic commute time and amenity access for the typical tenant pool here? Any planned neighborhood developments (good or bad) we should know about?
- What's the average days-on-market for RENTAL listings here right now (not sales)? A rising rental-DOM trend means longer vacancies and softer asking-rent achievability than the comps imply.
- What's the recent tenant-quality profile in this submarket — average credit score on applications, eviction rate, late-payment / NSF rate, and stable-employment percentage? A property-management company in the area should have these aggregated.
- How much new for-sale + rental construction is in the pipeline within 1–3 miles? Heavy new supply typically softens prices + rents 12–24 months out; constrained supply supports both.
Investment metrics
- 1% rule
- 0.68% ✗
- Cap rate
- 5.20%
- Cash-on-cash
- -3.90%
- DSCR
- 0.83
- GRM
- 12.2
CMA / ARV
- ARV (median comp)
- $290,657
- List price
- $228,000
- Delta
- -21.56%
- Verdict
- UNDERPRICED
- Comps
- 20 within 1.0 mi
Show comp detail 12 sales within ~0.75 mi
| Address | Dist | Beds/Ba | Sqft | Sold | Price | $/sf | Match |
|---|---|---|---|---|---|---|---|
| 4736 Hummingbird Ln | 0.11mi | 4/2.0 (+1) | 1,989 (+1%) | 1mo | $340,000 | $171 | 87 |
| 4302 Oak Ridge Bnd | 0.22mi | 3/2.0 | 1,917 (-2%) | 1mo | $275,000 | $143 | 85 |
| 4216 Thornwood Way | 0.16mi | 3/2.0 | 1,928 (-2%) | 5mo | $245,000 | $127 | 85 |
| 4202 Springbrook Cir | 0.07mi | 3/2.0 | 1,854 (-6%) | 4mo | $265,000 | $143 | 84 |
| 4116 Lantern Ln | 0.22mi | 3/2.0 | 1,952 (-1%) | 8mo | $254,400 | $130 | 82 |
| 4616 Foxborough Ave | 0.18mi | 4/2.0 (+1) | 2,031 (+3%) | 1mo | $295,000 | $145 | 80 |
| 4505 Timberbrook Trl | 0.18mi | 4/2.5 (+1) | 2,018 (+3%) | 1mo | $205,000 | $102 | 79 |
| 4054 Foxborough Blvd | 0.15mi | 4/2.0 (+1) | 1,848 (-6%) | 4mo | $215,000 | $116 | 74 |
| 4026 Foxborough Blvd | 0.28mi | 3/2.0 | 1,772 (-10%) | 4mo | $223,900 | $126 | 67 |
| 4626 Briarberry Dr | 0.21mi | 4/2.5 (+1) | 2,137 (+9%) | 7mo | $345,000 | $161 | 63 |
| 4134 Amberly Trl | 0.26mi | 4/2.5 (+1) | 2,198 (+12%) | 6mo | $299,900 | $136 | 57 |
| 4614 Briarberry Dr | 0.21mi | 4/3.0 (+1) | 2,222 (+13%) | 9mo | $329,000 | $148 | 52 |
Match score weights: distance 35% · size 25% · config 20% · recency 20%. Top-matched comps best support the ARV.
Projected returns pro-forma
-3.0% appreciation · 4.19% rent growth · sell at horizon
- IRR
- -21.7%
- Equity multiple
- 0.24×
- Total profit
- $-48,349
- Equity at exit
- $33,996
- IRR
- -13.2%
- Equity multiple
- 0.19×
- Total profit
- $-51,459
- Equity at exit
- $19,713
Cash invested: $63,840 (down + closing). Projections, not guarantees.
Landlord ↔ Tenant lean methodology
- Overall (STATE)
- 90 Strongly Landlord-Friendly
- State Georgia
- 90 Strongly Landlord-Friendly · R+3
- County
- — inherits STATE
- City
- — inherits STATE
ZIP-level market 31602
- Rents YoY
- 4.2%
- Active inventory
- 267
- Price-to-rent
- 12.2×
Monthly cashflow live
- Estimated rent
- $1,556 medium interval (Pro) →
- Mortgage (P&I)
- −$1,196
- Tax from tax record
- −$146 /mo · $1,755/yr
- Insurance
- −$95
- HOA
- −$0
- Vacancy / Maint / Mgmt
- −$327
- Net cashflow
- $-208
Break-even live
UW: 25.0% down · 7.5% · 30yr · 1.5% tax · 5.0% vac · 8.0% maint · 8.0% mgmt
Financing live
Cash to close
- Down payment
- $57,000
- Closing costs
- $6,840
- Reserves months
- —
- Total cash needed
- —
Loan-product check · same deal, 3 products live
Conventional
25% down · 7.5% · 30yr
- Down + closing
- —
- Monthly P&I
- —
- Monthly cashflow
- —
- DSCR
- —
- Eligible?
- —
Personal DTI + credit; lowest rate.
DSCR
20% down · 8.5% · 30yr
- Down + closing
- —
- Monthly P&I
- —
- Monthly cashflow
- —
- DSCR
- —
- Eligible?
- —
No personal income docs; deal must DSCR.
Hard money
10% down · 12.0% · 12mo
- Down + closing
- —
- Monthly P&I
- —
- Monthly cashflow
- —
- DSCR
- —
- Eligible?
- —
Short-term bridge; refi at stabilization.
Rent comps 1 comps
| Address | Beds | Baths | Sqft | Rent | $/sqft | DOM | Units | Dist |
|---|---|---|---|---|---|---|---|---|
| 4182 Waterberry Cir Valdosta, GA | 3.0 | 2.0 | 1350 | $1,600 | $1.19 | 43d | 1 | 1.41mi |
Listing history 15 events
-
2026-06-14statusdays on market $228,000 Under Contract 35 DOM
-
2026-06-13days on market $228,000 Active 34 DOM
Show marketing remark (343 chars)
Welcome to 4521 Timberbrook Trail in Valdosta, GA. This well-kept home offers a comfortable layout, inviting living spaces, and a spacious yard perfect for kids, pets, and gatherings. Tucked in a quiet, established neighborhood with convenient access to town, it's a great place to settle in and feel at home. Don't miss your chance to see it!
-
2026-06-10days on market $228,000 Active 32 DOM
-
2026-06-09days on market $228,000 Active 31 DOM
-
2026-06-08days on market $228,000 Active 30 DOM
-
2026-06-07days on market $228,000 Active 29 DOM
-
2026-06-05days on market $228,000 Active 26 DOM
-
2026-06-03days on market $228,000 Active 25 DOM
-
2026-06-02days on market $228,000 Active 24 DOM
-
2026-06-01days on market $228,000 Active 23 DOM
-
2026-05-31days on market $228,000 Active 22 DOM
-
2026-05-30days on market $228,000 Active 21 DOM
-
2026-05-04$228,000 Active 343-char remark
Show marketing remark (343 chars)
Welcome to 4521 Timberbrook Trail in Valdosta, GA. This well-kept home offers a comfortable layout, inviting living spaces, and a spacious yard perfect for kids, pets, and gatherings. Tucked in a quiet, established neighborhood with convenient access to town, it's a great place to settle in and feel at home. Don't miss your chance to see it!
-
2026-05-04$228,000 New 344-char remark
Show marketing remark (343 chars)
Welcome to 4521 Timberbrook Trail in Valdosta, GA. This well-kept home offers a comfortable layout, inviting living spaces, and a spacious yard perfect for kids, pets, and gatherings. Tucked in a quiet, established neighborhood with convenient access to town, it's a great place to settle in and feel at home. Don't miss your chance to see it!
-
1988-03-18soldstatus $85,000
ⓘ Source: listings_history table (triggers on properties + properties_extension) + one-shot
backfill from property_details.listing_events for pre-trigger history.
Tax reassessment forecast GA · Resets to sale price
- Current annual tax
- $1,755 · $146/mo
- Projected year-2 tax
- $2,098 · $175/mo
- Expected delta
- +$343/yr (+$29/mo · 19.5%)
ⓘ Screening estimate from a state-policy table — verify with the county assessor before closing.
Climate risk First Street
- Flood 1/10 Low FEMA zone X (unshaded) · 0% chance over 30 yrs
- Wildfire 6/10 Major
- Heat 7/10 Severe 7 d/yr ≥108°F today · 19 d/yr by 30 yrs out
- Wind 8/10 Severe 99% chance of damaging wind over 30 yrs
- Air quality 6/10 Major 10 unhealthy d/yr today · 11 by 30 yrs out
Nearby sold comps map
Loading sold comps map…
Walkable amenities ~0.75 mi
Loading nearby amenities…
Taxation est. · year 1
- Rental income
- $18,672
- − Mortgage interest
- −$12,772
- − Property taxes
- −$1,755
- − Insurance
- −$1,140
- − Repairs & maintenance
- −$1,494
- − Management
- −$1,494
- − Depreciation
- −$6,633
- Taxable loss
- −$6,615
- Est. tax savings @ 24.0%
- +$1,588
- After-tax cash flow
- $-905/yr
For passive investors: Depreciation is non-cash, so a rental often shows a tax loss while cash-flowing — sheltering income. Rental losses are passive: they offset passive income freely, and up to $25,000/yr can offset ordinary (W-2) income if you actively participate and your MAGI is under $100k (phasing out to $0 by $150k); unused losses carry forward. On sale, claimed depreciation is recaptured at up to 25%, and gains may owe capital-gains tax (a 1031 exchange can defer both). Figures are a year-1 estimate at your 24.0% rate — not tax advice; consult a CPA.
Schools (NCES district)
- District
- Lowndes County
- NCES district ID
- 1303390
- Math proficiency
- 59% ▼ -1.00%
- Reading proficiency
- 52% ▼ -2.00%
- Median HH income
- $48,221
- Composite
- 47.21/100
- National rank
- #2317
- State rank
- #8 of 174 in GA
Livability — Valdosta
- Score
- 60/100
- State rank
- #392
- US rank
- #19544
Category grades
Schools grade is shown separately in the Schools card above.
Census & demographics
- County
- Lowndes County · 107,801 people
- City population
- 91,859
- Metro
- Valdosta, GA
- Population (ZIP)
- 35,728
- Household income
- $56,939
- Rent vs Own
- Severe rent burden
- 2034.0
Population outlook (Lowndes County) Hauer SSP2
- Today (2025)
- 120,348 people
- By 2030
- 123,469 · +2.6%
- By 2040
- 128,482 · +6.8%
- By 2050
- 131,907 · +9.6%
- By 2075
- 139,080 · +15.6%
- By 2100
- 133,649 · +11.1%
Race, ethnicity, and origin ACS 2023
- Neighborhood character
- Diverse neighborhood (Simpson 0.61)
- Race & ethnicity
- White 45% Black 42% Hispanic / Latino 7% Two or more races 5% Asian 2%
- Hispanic origin (detail)
- Mexican 3% Puerto Rican 1%
- Common ancestry
- Italian 1% Slovak 1% Lithuanian 1%
- Foreign-born
- 4% · Canada
- Languages at home
- 94% English-only · Spanish 3% Other Indo-European 1% French/Haitian/Cajun 1%
Political lean MEDSL · Lowndes
- 2024 margin
- R (+18.0) · D 40.8% · R 58.8%
- 2008→2024 swing
- -8.6pp toward R · 2008: -9.4pp · 2024: -18.0pp
- All cycles
- 2024: R+18.0 2020: R+12.0 2016: R+18.2 2012: R+10.5 2008: R+9.4
Not yet ingested
- Civics
- —
Market trends
- HPI YoY
- ▼ -150.60%
- Current HPI
- 188.2012
- Rent YoY
- ▲ 4.19%
- Metro
- Valdosta, GA
- State GDP YoY
- ▲ 2.66%
- F500 in state
- 28
Industry mix (Fortune 500 HQ in GA)
| Industry | F500 HQs | Revenue |
|---|---|---|
| Paper / Packaging | 2 | $29B |
|
||
| Retail | 1 | $160B |
|
||
| Transportation / Logistics | 1 | $91B |
|
||
| Airlines | 1 | $62B |
|
||
| Consumer Goods | 1 | $47B |
|
||
| Utilities | 1 | $25B |
|
||
Price history
+168.2% since first listed5 events — show timeline
- 2026-06-13 Pending — GAMLS
- 2026-06-13 Pending — SGMLS
- 2026-05-04 Listed $228,000 SGMLS
- 2026-05-04 Listed $228,000 GAMLS
- 1988-03-18 Sold (Public Records) $85,000 Public Records
Property tax history
+5.9%/yrLatest (2025): $1,755 · +0.4% YoY. Source: county tax records.
Cash-flow waterfall
monthlySold comps — $/sqft
last 12 mo · ≤1 miLoading sold comps…