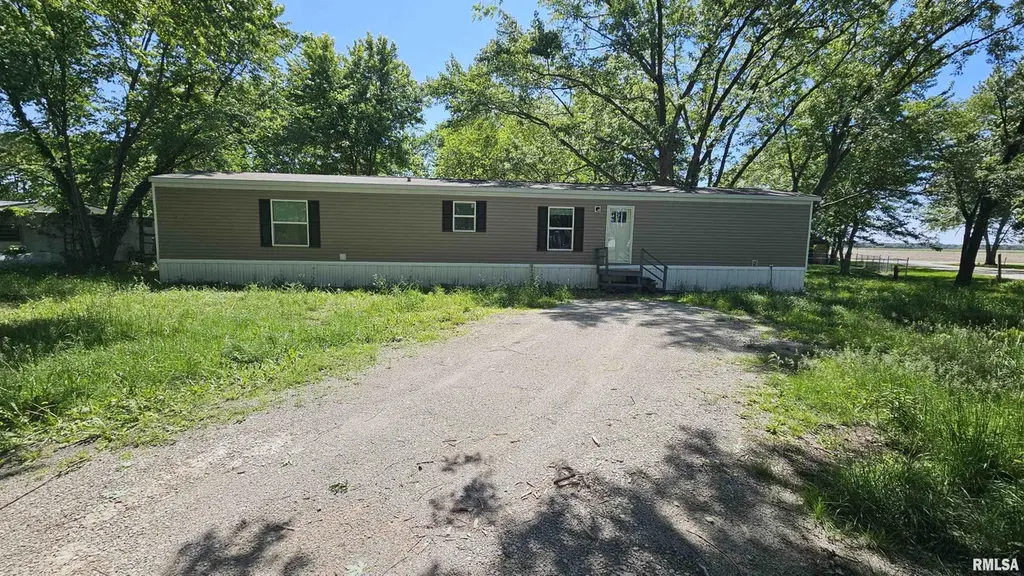
24 N Austin Ave · Herrick, IL
Flood risk 1/10 · Minimal
- FEMA flood zone
- —
- Chance of flooding over 30 yrs
- 0.0%
- Est. flood insurance / yr
- —
Fire risk 1/10 · Minimal
- Est. fire insurance / yr
- $804 – $1,492
Heat risk 4/10 · Minor
- Hot days now (above 105°F)
- 7 days/yr
- Hot days in 30 yrs
- 19 days/yr
Wind risk 2/10 · Minimal
- Chance of severe wind over 30 yrs
- 2.0%
Air-quality risk 3/10 · Minor
- Unhealthy air days now
- 1 days/yr
- Unhealthy air days in 30 yrs
- 3 days/yr
Risk factors via First Street. Map © Google.
Why this score? — see what drove the B grade
The composite is a weighted blend of 9 inputs, each scored 0–100. Each bar is that input's sub-score; the figure is the points it added to the 100-point composite (weight × sub-score).
- Cash flow +30.0/30.0
- DSCR +10.0/10.0
- 1% rule +9.4/10.0
- ARV discount +7.5/15.0
- Appreciation +5.8/10.0
- Livability +2.9/5.0
- Rent growth +2.5/5.0
- Condition / age +2.5/5.0
- Schools +1.8/10.0
$72,500
🖨 Deal sheet 📄 Offer letter ✓ Due diligence
Listing remarks
Enjoy small town living in this beautifully designed manufactured home sitting on a large corner lot in Herrick. Inside, you will find a nice built-in tv stand in the living room, and a large, modern kitchen with an eat-in island. Stainless steel appliances come with the home as well. There are 3 bedrooms and 2 bathrooms. Schedule a private showing today!
Key facts
- Built-in tv stand
- Eat-in island
- Large corner lot
Tags
Property features AI
Exterior
- Parking: Gravel parking; No garage
- Utilities: Public water; Public sewer
- Home design: Single-family residence; Manufactured home: Clayton Blazer; Built in 2024
- Construction: Shingle roof; Built 2024
- Exterior features: Level lot; Lot dimensions approximately 116 x 50
Interior
- Kitchen: Kitchen present (appliances include refrigerator)
- Bedrooms: 3 bedrooms; Primary bedroom on main level; Additional bedrooms on upper, lower, basement, and other levels
- Flooring: Laminate flooring in multiple rooms
- Bathrooms: 2 full bathrooms
- Heating & cooling: Electric forced-air heating
- Interior features: Refrigerator included; No basement; No fireplaces
Neighborhood map
What this means for you Summary
Snapshot
- This is a 3-bed/2.0-bath manufactured listed at $72k.
Deal economics
- At list price, monthly cash flow is $401 ($5k/yr) — positive.
- The deal already cash-flows at list — no discount required.
- Meets the 1% rule at list price ($1k rent vs $72k).
- Recommended offer: $71k (1.5% below list) — sets the bar for market timing.
Location & tenants
- Location reads 58/100 on livability (#1,092 in IL) — a working-class tenant base; expect higher turnover. Strengths: cost of living A+, housing A+; Watch: crime D-, amenities F, commute F.
- Cowden-Herrick CUSD 3A (rural): math 15% / reading 20% proficiency, ranked #748 of 919 in IL (top 81%) — low school quality limits family demand, transient renter base, plan for 1-2y turnover.
- Zoned schools: Cowden-Herrick Jr/Sr High School (math 17% / reading 17%, grade F, #430 of 693 statewide, top 66%, 165 students, 0% FRL) — zoned schools average 0% FRL vs 50% district-wide (50 pts lower); this property's tenant base skews higher-income than the district average.
- Market conditions: 8 active listings in the ZIP; 41 units permitted in Shelby County in 2024 (0 in 5+ unit buildings).
Forward outlook
- In year one you build about $2k of equity ($501 loan paydown + $1k appreciation (1.5% local appreciation)).
- Shelby County population projected at -22% by 2050 — secular population decline; favor cash flow + early exit over multi-decade hold.
- At projected returns (1.5% appreciation + 3.0% rent growth), your $20k cash investment doubles in ~4 years — after that, you're playing with house money.
Negotiation context
- It's been on market 24 days — a 2% lower offer ($71k) is reasonable based on typical stale-listing flexibility.
Questions for the listing agent
- Is there a deadline driving the sale (1031 exchange, divorce, estate, relocation)? That informs how much negotiation room exists.
- Schools are F-rated, which usually means shorter tenancies and higher turnover. Who's the typical renter profile here, and what's been the actual vacancy rate?
- Crime grade is D in this area — have there been break-ins, vandalism, or insurance claims at this property in the last 3 years? What carrier currently insures it and at what premium?
- What's the average days-on-market for RENTAL listings here right now (not sales)? A rising rental-DOM trend means longer vacancies and softer asking-rent achievability than the comps imply.
- What's the recent tenant-quality profile in this submarket — average credit score on applications, eviction rate, late-payment / NSF rate, and stable-employment percentage? A property-management company in the area should have these aggregated.
- How much new for-sale + rental construction is in the pipeline within 1–3 miles? Heavy new supply typically softens prices + rents 12–24 months out; constrained supply supports both.
Investment metrics
- 1% rule
- 1.44% ✓
- Cap rate
- 12.93%
- Cash-on-cash
- 23.70%
- DSCR
- 2.05
- GRM
- 5.8
CMA / ARV
No comps found within radius.
Projected returns pro-forma
1.51% appreciation · 3.0% rent growth · sell at horizon
- IRR
- 26.9%
- Equity multiple
- 2.41×
- Total profit
- $28,695
- Equity at exit
- $26,704
- IRR
- 29.0%
- Equity multiple
- 4.63×
- Total profit
- $73,667
- Equity at exit
- $37,050
Cash invested: $20,300 (down + closing). Projections, not guarantees.
Landlord ↔ Tenant lean methodology
- Overall (STATE)
- 43 Moderately Tenant-Leaning
- State Illinois
- 43 Moderately Tenant-Leaning · D+7
- County
- — inherits STATE
- City
- — inherits STATE
ZIP-level market 62431
- Home prices YoY
- 1.1%
- Active inventory
- 8
- Price-to-rent
- 5.8×
Monthly cashflow live
- Estimated rent
- $1,048 medium interval (Pro) →
- Mortgage (P&I)
- −$380
- Tax from tax record
- −$16 /mo · $195/yr
- Insurance
- −$30
- HOA
- −$0
- Vacancy / Maint / Mgmt
- −$220
- Net cashflow
- $401
Break-even live
UW: 25.0% down · 7.5% · 30yr · 1.5% tax · 5.0% vac · 8.0% maint · 8.0% mgmt
Financing live
Cash to close
- Down payment
- $18,125
- Closing costs
- $2,175
- Reserves months
- —
- Total cash needed
- —
Loan-product check · same deal, 3 products live
Conventional
25% down · 7.5% · 30yr
- Down + closing
- —
- Monthly P&I
- —
- Monthly cashflow
- —
- DSCR
- —
- Eligible?
- —
Personal DTI + credit; lowest rate.
DSCR
20% down · 8.5% · 30yr
- Down + closing
- —
- Monthly P&I
- —
- Monthly cashflow
- —
- DSCR
- —
- Eligible?
- —
No personal income docs; deal must DSCR.
Hard money
10% down · 12.0% · 12mo
- Down + closing
- —
- Monthly P&I
- —
- Monthly cashflow
- —
- DSCR
- —
- Eligible?
- —
Short-term bridge; refi at stabilization.
Listing history 14 events
-
2026-06-16status $72,500 Pending 24 DOM
-
2026-06-15days on market $72,500 Active 24 DOM
-
2026-06-13days on market $72,500 Active 22 DOM
-
2026-06-12pricedays on market $72,500 Active 21 DOM
-
2026-06-09days on market $74,900 Active 18 DOM
-
2026-06-08days on market $74,900 Active 17 DOM
-
2026-06-07days on market $74,900 Active 16 DOM
-
2026-06-05days on market $74,900 Active 14 DOM
-
2026-06-04days on market $74,900 Active 12 DOM
-
2026-06-02days on market $74,900 Active 11 DOM
-
2026-06-01days on market $74,900 Active 10 DOM
-
2026-05-31days on market $74,900 Active 9 DOM
-
2026-05-31days on market $74,900 Active 8 DOM
-
2026-05-22$74,900 Active
ⓘ Source: listings_history table (triggers on properties + properties_extension) + one-shot
backfill from property_details.listing_events for pre-trigger history.
Tax reassessment forecast IL · Partial reset (capped growth)
- Current annual tax
- $195 · $16/mo
- Projected year-2 tax
- $920 · $77/mo
- Expected delta
- +$725/yr (+$60/mo · 372.4%)
ⓘ Screening estimate from a state-policy table — verify with the county assessor before closing.
Climate risk First Street
- Flood 1/10 Low 0% chance over 30 yrs
- Wildfire 1/10 Low
- Heat 4/10 Moderate 7 d/yr ≥105°F today · 19 d/yr by 30 yrs out
- Wind 2/10 Low 2% chance of damaging wind over 30 yrs
- Air quality 3/10 Moderate 1 unhealthy d/yr today · 3 by 30 yrs out
Nearby sold comps map
Loading sold comps map…
Walkable amenities ~0.75 mi
Loading nearby amenities…
Taxation est. · year 1
- Rental income
- $12,570
- − Mortgage interest
- −$4,061
- − Property taxes
- −$195
- − Insurance
- −$362
- − Repairs & maintenance
- −$1,006
- − Management
- −$1,006
- − Depreciation
- −$2,109
- Taxable income
- $3,831
- Est. tax owed @ 24.0%
- −$920
- After-tax cash flow
- $3,891/yr
For passive investors: Depreciation is non-cash, so a rental often shows a tax loss while cash-flowing — sheltering income. Rental losses are passive: they offset passive income freely, and up to $25,000/yr can offset ordinary (W-2) income if you actively participate and your MAGI is under $100k (phasing out to $0 by $150k); unused losses carry forward. On sale, claimed depreciation is recaptured at up to 25%, and gains may owe capital-gains tax (a 1031 exchange can defer both). Figures are a year-1 estimate at your 24.0% rate — not tax advice; consult a CPA.
Schools (NCES district)
- District
- Cowden-Herrick CUSD 3A
- NCES district ID
- 1700176
- Math proficiency
- 15% ▼ -13.00%
- Reading proficiency
- 20% ▼ -8.00%
- Median HH income
- $38,977
- Composite
- 18.13/100
- National rank
- #14073
- State rank
- #748 of 919 in IL
Livability — Herrick
- Score
- 58/100
- State rank
- #1092
- US rank
- #20769
Category grades
Schools grade is shown separately in the Schools card above.
Census & demographics
- Census place
- Herrick, IL
- Population (ZIP)
- 777
Population outlook (Shelby County) Hauer SSP2
- Today (2025)
- 20,512 people
- By 2030
- 19,675 · -4.1%
- By 2040
- 17,851 · -13.0%
- By 2050
- 15,973 · -22.1%
- By 2075
- 11,799 · -42.5%
- By 2100
- 8,030 · -60.9%
Race, ethnicity, and origin ACS 2023
- Neighborhood character
- Predominantly White (95%)
- Race & ethnicity
- White 95% Hispanic / Latino 4%
- Common ancestry
- Iranian 1% Slovak 1%
Political lean MEDSL · Shelby
- 2024 margin
- Solid R (+60.2) · D 19.2% · R 79.5% · Other 1.4%
- 2008→2024 swing
- -40.5pp toward R · 2008: -19.8pp · 2024: -60.2pp
- All cycles
- 2024: R+60.2 2020: R+57.2 2016: R+54.3 2012: R+33.7 2008: R+19.8
Not yet ingested
- Civics
- —
Market trends
- HPI YoY
- ▲ 1.51%
- Current HPI
- 140.1175
- Rent YoY
- —
- Metro
- —
- State GDP YoY
- ▲ 1.59%
- F500 in state
- 60
Industry mix (Fortune 500 HQ in IL)
| Industry | F500 HQs | Revenue |
|---|---|---|
| Insurance | 4 | $201B |
|
||
| Consumer Goods | 4 | $87B |
|
||
| Industrial Machinery | 3 | $64B |
|
||
| Healthcare | 2 | $55B |
|
||
| Retail / Pharmacy | 1 | $148B |
|
||
| Agriculture / Food | 1 | $86B |
|
||
Price history
1 event — show timeline
- 2026-05-22 Listed $74,900 RMLSA as Distributed by MLS Grid
Property tax history
+7.6%/yrLatest (2024): $195 · -2.9% YoY. Source: county tax records.
Cash-flow waterfall
monthlySold comps — $/sqft
last 12 mo · ≤1 miLoading sold comps…