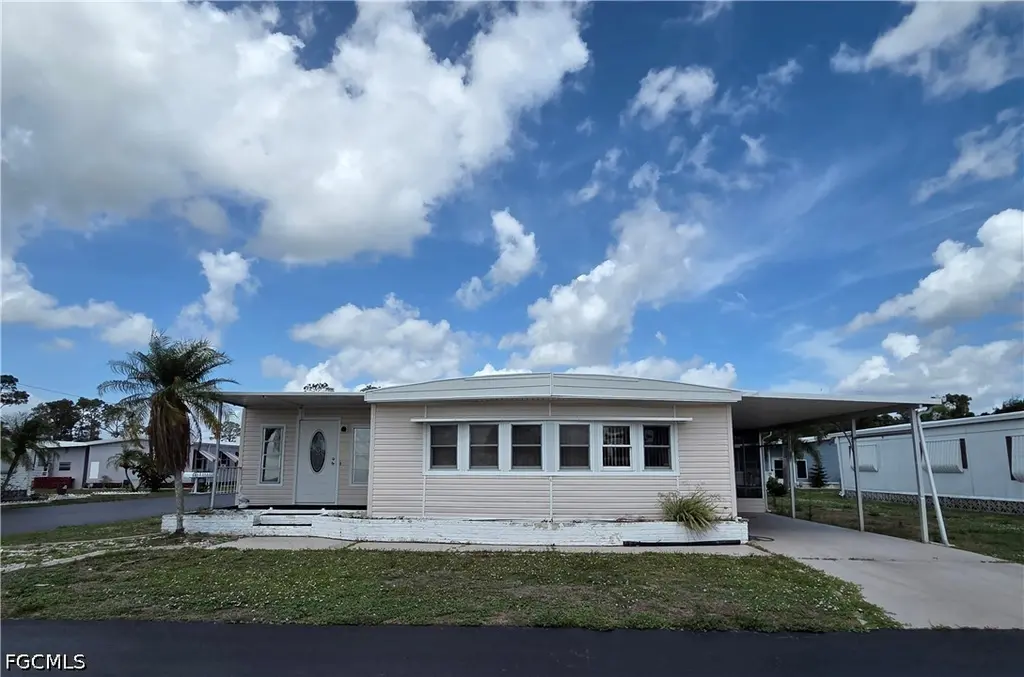
694 Dream Ln · North Fort Myers, FL
Flood risk 3/10 · Minor
- FEMA flood zone
- AE
- Chance of flooding over 30 yrs
- 0.2%
- Est. flood insurance / yr
- $1,737 – $8,500
Fire risk 3/10 · Minor
- Est. fire insurance / yr
- $947 – $1,759
Heat risk 10/10 · Severe
- Hot days now (above 107°F)
- 7 days/yr
- Hot days in 30 yrs
- 29 days/yr
Wind risk 10/10 · Severe
- Chance of severe wind over 30 yrs
- 99.0%
Air-quality risk 2/10 · Minimal
- Unhealthy air days now
- 1 days/yr
- Unhealthy air days in 30 yrs
- 1 days/yr
Risk factors via First Street. Map © Google.
Why this score? — see what drove the B grade
The composite is a weighted blend of 9 inputs, each scored 0–100. Each bar is that input's sub-score; the figure is the points it added to the 100-point composite (weight × sub-score).
- Cash flow +30.0/30.0
- 1% rule +10.0/10.0
- DSCR +10.0/10.0
- ARV discount +7.5/15.0
- Schools +4.1/10.0
- Livability +3.7/5.0
- Rent growth +3.2/5.0
- Condition / age +2.5/5.0
- Appreciation +0.0/10.0
$99,500
🖨 Deal sheet 📄 Offer letter ✓ Due diligence
Listing remarks MLS
PROPERTY SUSTAINED HURRICANE STORM DAMAGE. SELLERS ARE ASSESSING THE SITUATION. Remodeled Immaculate THREE-Bedroom TRIPLE-WIDE on a large corner lot offered TURNKEY & READY to Move in! Own your land AND this METICULOUSLY MAINTAINED home when you buy in Lazy Days Mobile Village! Screened breezeway & air-conditioned Florida Room offer SO MUCH space for relaxing & entertaining family & friends! Ideally located on a quiet street w/ no thru-traffic. 2 Full Baths, 2 walk-in closets + ample storage. Lustrous wood flooring & solid subfloors. Brand new central AC system. All appliances including DW, Washer, Dryer, laundry tub conveniently located in the breezeway shed. Sound roof. Awnings for weather protection & energy savings. Enjoy maintenance-free affordable living in the Sunshine State~no state income tax; LOW monthly fee $155 includes recreation facilities, grounds maintenance, trash pick-up. Low cost RV & boat storage onsite. Walk to the pool & enjoy a friendly 55+ community w/ 2 clubhouses, community swimming pool, shuffleboard, ponds, parks, nice landscaping, streetlights. A great place to live year-round or as a 2nd home for warm weather enjoyment!
Key facts
- Large corner lot
- Rv and boat storage
- 5,793 sq ft lot
Tags
Property features AI
Finance
- Other: Community pool
- Financial info: Pets allowed conditionally (call); max 2 pets, max ~25 lb; no vicious breeds
- HOA & community: Homeowners association with a $185 monthly fee; Fee covers legal/accounting, recreation facilities, reserve fund, and street lights; Community amenities include clubhouse, pool, bocce, pickleball, shuffleboard, picnic & barbecue areas, RV/boat storage, storage, laundry, and management; Street lights; Senior community
Exterior
- Parking: Attached carport (1 covered space); Driveway (paved)
- Security: Smoke detector(s)
- Utilities: Public water; Public sewer; Cable available
- Home design: Manufactured home with vinyl siding; Single-story; Entry level: 1; Faces east; Known damage reported
- Construction: Metal roof
- Exterior features: Storage; Lanai; Porch (screened); Corner lot; Paved public road access; West exposure
Interior
- Kitchen: Range; Dishwasher; Refrigerator
- Bedrooms: Guest quarters; Split-bedroom layout
- Flooring: Carpet; Laminate; Vinyl
- Bathrooms: 2 full bathrooms
- Heating & cooling: Central electric heating; Central air conditioning; Ceiling fans
- Interior features: Built-in features; Bathtub; Separate shower; Walk-in closet(s); Pantry; Living/dining room; Window treatments; High-speed internet; Split bedrooms; Partially furnished; Single hung and sliding windows with shutters
- Laundry & utility: Washer; Dryer; Laundry tub; Common area laundry and in-garage laundry access
Neighborhood map
What this means for you Summary
Snapshot
- This is a 2-bed/2.0-bath manufactured listed at $100k.
Deal economics
- At list price, monthly cash flow is $178 ($2k/yr) — positive.
- The deal already cash-flows at list — no discount required.
- Meets the 1% rule at list price ($2k rent vs $100k).
- Recommended offer: $98k (1.5% below list) — sets the bar for market timing.
- Cap rate 13.6% vs local median 3.6% in North Fort Myers — top-decile yield for the area; either an underpriced asset or a hidden risk that comps aren't pricing in. Stress-test before assuming the spread holds.
Location & tenants
- Location reads 74/100 on livability (#269 in FL, #4,409 nationally) — a middle-class / working-renter tenant base. Strengths: cost of living A+, housing A+, health & safety A+; Watch: employment C-, amenities F, commute F.
- Lee (suburban): math 47% / reading 50% proficiency, ranked #42 of 73 in FL (top 58%) — families likely to look elsewhere, expect single-tenant / working-renter base with shorter leases.
- Market conditions: Rents rising (+2.6%/yr); 841 active listings in the ZIP; 25 comparable units currently listed for rent nearby; rentals at typical pace (median 14d on market — plan ~3-4 weeks tenant-placement turnaround); 15,411 units permitted in Lee County in 2024 (4,686 in 5+ unit buildings).
- This rent runs 41% of the median local income ($55k/yr) — at the standard rent-burdened threshold; future hikes will face affordability resistance.
Forward outlook
- Local home prices are declining (-3.0%/yr); year-one equity from $688 of loan paydown is wiped out by about $3k of value loss. Plan a longer hold.
- Lee County population projected at +44% by 2050 — long-run rental-demand tailwind backs the buy-and-hold thesis.
Negotiation context
- It's been on market 20 days — a 2% lower offer ($98k) is reasonable based on typical stale-listing flexibility.
- 8 sale attempts since 5y ago with the ask held roughly flat each time — persistent listings suggest the price (not the market) is what's stuck; bring a comps-based counter.
Risks & watch-outs
- Watch-outs: flood insurance adds $427/mo.
- Climate carrying-cost: in FEMA flood zone AE (mandatory federal flood insurance); severe wind risk, 99% chance of damaging wind over 30y; extreme-heat days projected 7→29/yr by 2055 (HVAC capex compounding) — expect insurance premiums to compound above CPI over the hold.
Questions for the listing agent
- Built in 1978 — when were the roof, HVAC, electrical panel, plumbing, and water heater last replaced?
- What's the actual annual flood-insurance premium (NFIP or private), and is the property in a SFHA with mandatory coverage?
- What does the HOA fee cover, when was the last increase, and are there any pending special assessments or reserve-fund shortfalls?
- Is there a deadline driving the sale (1031 exchange, divorce, estate, relocation)? That informs how much negotiation room exists.
- What's the average days-on-market for RENTAL listings here right now (not sales)? A rising rental-DOM trend means longer vacancies and softer asking-rent achievability than the comps imply.
- What's the recent tenant-quality profile in this submarket — average credit score on applications, eviction rate, late-payment / NSF rate, and stable-employment percentage? A property-management company in the area should have these aggregated.
- How much new for-sale + rental construction is in the pipeline within 1–3 miles? Heavy new supply typically softens prices + rents 12–24 months out; constrained supply supports both.
Investment metrics
- 1% rule
- 1.88% ✓
- Cap rate
- 13.58%
- Cash-on-cash
- 26.04%
- DSCR
- 2.16
- GRM
- 4.4
CMA / ARV
No comps found within radius.
Projected returns pro-forma
-3.0% appreciation · 2.63% rent growth · sell at horizon
- IRR
- -4.9%
- Equity multiple
- 0.82×
- Total profit
- $-5,082
- Equity at exit
- $14,836
- IRR
- 4.5%
- Equity multiple
- 1.32×
- Total profit
- $8,983
- Equity at exit
- $8,603
Cash invested: $27,860 (down + closing). Projections, not guarantees.
Landlord ↔ Tenant lean methodology
- Overall (STATE)
- 87 Strongly Landlord-Friendly
- State Florida
- 87 Strongly Landlord-Friendly · R+3
- County
- — inherits STATE
- City
- — inherits STATE
ZIP-level market 33917
- Home prices YoY
- -30.2%
- Rents YoY
- 2.6%
- Active inventory
- 841
- Price-to-rent
- 4.4×
Monthly cashflow live
- Estimated rent
- $1,871 high interval (Pro) →
- Mortgage (P&I)
- −$522
- Tax from tax record
- −$126 /mo · $1,507/yr
- Insurance
- −$41
- Flood insurance flood zone
- −$427 /mo · $5,118/yr
- HOA
- −$185
- Vacancy / Maint / Mgmt
- −$393
- Net cashflow
- $178
Break-even live
UW: 25.0% down · 7.5% · 30yr · 1.5% tax · 5.0% vac · 8.0% maint · 8.0% mgmt
Financing live
Cash to close
- Down payment
- $24,875
- Closing costs
- $2,985
- Reserves months
- —
- Total cash needed
- —
Loan-product check · same deal, 3 products live
Conventional
25% down · 7.5% · 30yr
- Down + closing
- —
- Monthly P&I
- —
- Monthly cashflow
- —
- DSCR
- —
- Eligible?
- —
Personal DTI + credit; lowest rate.
DSCR
20% down · 8.5% · 30yr
- Down + closing
- —
- Monthly P&I
- —
- Monthly cashflow
- —
- DSCR
- —
- Eligible?
- —
No personal income docs; deal must DSCR.
Hard money
10% down · 12.0% · 12mo
- Down + closing
- —
- Monthly P&I
- —
- Monthly cashflow
- —
- DSCR
- —
- Eligible?
- —
Short-term bridge; refi at stabilization.
Rent comps 25 comps
| Address | Beds | Baths | Sqft | Rent | $/sqft | DOM | Units | Dist |
|---|---|---|---|---|---|---|---|---|
| 4234 Pine Drop Ln North Fort Myers, FL | 3.0 | 2.0 | 1914 | $1,495 | $0.78 | 3d | 1 | 0.33mi |
| 4232 Pine Drop Ln North Fort Myers, FL | 3.0 | 2.0 | 1914 | $1,495 | $0.78 | 3d | 1 | 0.33mi |
| 2861 N 2nd St North Fort Myers, FL | 3.0 | 2.0 | 1951 | $2,500 | $1.28 | 21d | 1 | 0.51mi |
| 2861 N 2nd St North Fort Myers, FL | 3.0 | 2.0 | 1951 | $2,500 | $1.28 | 23d | 1 | 0.51mi |
| 17499 Monte Isola Way Unit 17499 North Fort Myers, FL | 3.0 | 2.5 | 1405 | $1,800 | $1.28 | 13d | 1 | 0.93mi |
| 17489 Monte Isola Way North Fort Myers, FL | 3.0 | 2.5 | 1347 | $1,800 | $1.34 | 14d | 1 | 0.95mi |
| 266 Mongoose Ln #266 North Fort Myers, FL | 3.0 | 2.0 | 1372 | $1,499 | $1.09 | 3d | 1 | 1.01mi |
| 4208 Caterina Ct North Fort Myers, FL | 3.0 | 2.5 | 1347 | $1,800 | $1.34 | 14d | 1 | 1.07mi |
| 4228 Caterina Ct North Fort Myers, FL | 3.0 | 2.5 | 1700 | $1,850 | $1.09 | 11d | 1 | 1.08mi |
| 17669 Paradiso Way North Fort Myers, FL | 3.0 | 2.0 | 1551 | $1,999 | $1.29 | 3d | 1 | 1.11mi |
| 17669 Paradiso Way North Fort Myers, FL | 3.0 | 2.0 | 1551 | $1,999 | $1.29 | 23d | 1 | 1.11mi |
| 4241 Caterina Ct North Fort Myers, FL | 3.0 | 2.5 | 1529 | $1,900 | $1.24 | 15d | 1 | 1.12mi |
| 17400 Monte Isola Way North Fort Myers, FL | 3.0 | 2.0 | 1448 | $1,875 | $1.29 | 23d | 1 | 1.16mi |
| 4276 Cirella Ct North Fort Myers, FL | 3.0 | 2.5 | 1378 | $1,800 | $1.31 | 23d | 1 | 1.16mi |
| 4264 Cirella Ct North Fort Myers, FL | 3.0 | 2.5 | 1442 | $2,000 | $1.39 | 11d | 1 | 1.16mi |
| 535 Zebra Dr #535 North Fort Myers, FL | 3.0 | 2.0 | 1352 | $1,499 | $1.11 | 14d | 1 | 1.19mi |
| 3404 Rainbow Ln North Fort Myers, FL | 2.0 | 2.0 | 1056 | $1,800 | $1.70 | 3d | 1 | 1.23mi |
| 4275 Cirella Ct North Fort Myers, FL | 3.0 | 2.5 | 1378 | $1,800 | $1.31 | 23d | 1 | 1.25mi |
| 8791 Littleton Rd North Fort Myers, FL | 2.0 | 2.0 | 1074 | $1,549 | $1.44 | 23d | 1 | 1.29mi |
| 3358 Sabal Springs Blvd North Fort Myers, FL | 3.0 | 2.0 | 1621 | $2,200 | $1.36 | 23d | 1 | 1.39mi |
| 3260 Stockton St North Fort Myers, FL | 3.0 | 1.0–2.0 | 976 | $2,371 | $2.43 | 1d | 27 | 1.42mi |
| 446 San Bernardino St North Fort Myers, FL | 2.0 | 1.0 | 1104 | $1,590 | $1.44 | 10d | 1 | 1.42mi |
| 1439 Glick Dr North Fort Myers, FL | 3.0 | 1.0 | 1134 | $1,500 | $1.32 | 1d | 1 | 1.42mi |
| 2864 Star Coral Dr Unit Na North Fort Myers, FL | 3.0 | 2.0 | 1614 | $1,999 | $1.24 | 23d | 1 | 1.44mi |
| 7622 Peyraud Dr North Fort Myers, FL | 3.0 | 2.0 | 1404 | $1,350 | $0.96 | 23d | 1 | 1.45mi |
HOA detail
- Monthly dues
- $185 · $2,220/yr
- Likely covers
- trashlandscapingpool
Listing history 13 events
-
2026-06-18days on market $99,500 Active 20 DOM
-
2026-06-17days on market $99,500 Active 19 DOM
-
2026-06-16days on market $99,500 Active 18 DOM
-
2026-06-15days on market $99,500 Active 17 DOM
-
2026-06-13days on market $99,500 Active 15 DOM
-
2026-06-10days on market $99,500 Active 12 DOM
-
2026-06-09days on market $99,500 Active 11 DOM
-
2026-06-08days on market $99,500 Active 10 DOM
-
2026-06-07days on market $99,500 Active 9 DOM
-
2026-06-03days on market $99,500 Active 5 DOM
-
2026-06-02days on market $99,500 Active 4 DOM
-
2026-06-01days on market $99,500 Active 3 DOM
-
2026-05-31days on market $99,500 Active 2 DOM
ⓘ Source: listings_history table (triggers on properties + properties_extension) + one-shot
backfill from property_details.listing_events for pre-trigger history.
Tax reassessment forecast FL · Resets to sale price
- Current annual tax
- $1,507 · $126/mo
- Projected year-2 tax
- $1,507 · $126/mo
- Expected delta
- $0/yr ($0/mo · 0.0%)
ⓘ Screening estimate from a state-policy table — verify with the county assessor before closing.
Climate risk First Street
- Flood 3/10 Moderate FEMA zone AE · 20% chance over 30 yrs
- Wildfire 3/10 Moderate
- Heat 10/10 Extreme 7 d/yr ≥107°F today · 29 d/yr by 30 yrs out
- Wind 10/10 Extreme 99% chance of damaging wind over 30 yrs
- Air quality 2/10 Low 1 unhealthy d/yr today · 1 by 30 yrs out
Nearby sold comps map
Loading sold comps map…
Walkable amenities ~0.75 mi
Loading nearby amenities…
Taxation est. · year 1
- Rental income
- $22,454
- − Mortgage interest
- −$5,574
- − Property taxes
- −$1,507
- − Insurance
- −$5,616
- − Repairs & maintenance
- −$1,796
- − Management
- −$1,796
- − HOA
- −$2,220
- − Depreciation
- −$2,895
- Taxable income
- $1,051
- Est. tax owed @ 24.0%
- −$252
- After-tax cash flow
- $1,883/yr
For passive investors: Depreciation is non-cash, so a rental often shows a tax loss while cash-flowing — sheltering income. Rental losses are passive: they offset passive income freely, and up to $25,000/yr can offset ordinary (W-2) income if you actively participate and your MAGI is under $100k (phasing out to $0 by $150k); unused losses carry forward. On sale, claimed depreciation is recaptured at up to 25%, and gains may owe capital-gains tax (a 1031 exchange can defer both). Figures are a year-1 estimate at your 24.0% rate — not tax advice; consult a CPA.
Schools (NCES district)
- District
- Lee
- NCES district ID
- 1201080
- Math proficiency
- 47% ▼ -11.00%
- Reading proficiency
- 50% ▼ -4.00%
- Median HH income
- $49,518
- Composite
- 41.49/100
- National rank
- #3458
- State rank
- #42 of 73 in FL
Livability — North Fort Myers
- Score
- 74/100
- State rank
- #269
- US rank
- #4409
Category grades
Schools grade is shown separately in the Schools card above.
Census & demographics
- Census place
- North Fort Myers, FL
- County
- Lee County · 788,662 people
- City population
- 57,035
- Metro
- Cape Coral-Fort Myers, FL
- Population (ZIP)
- 33,380
- Household income
- $55,000
- Rent vs Own
- Severe rent burden
- 775.0
Population outlook (Lee County) Hauer SSP2
- Today (2025)
- 871,946 people
- By 2030
- 955,468 · +9.6%
- By 2040
- 1,113,587 · +27.7%
- By 2050
- 1,256,891 · +44.1%
- By 2075
- 1,560,270 · +78.9%
- By 2100
- 1,726,848 · +98.0%
Race, ethnicity, and origin ACS 2023
- Neighborhood character
- Predominantly White (85%)
- Race & ethnicity
- White 85% Hispanic / Latino 10% Two or more races 7% Asian 1% Black 1%
- Hispanic origin (detail)
- Mexican 2% Puerto Rican 1% Cuban 3%
- Common ancestry
- Lithuanian 3% Romanian 3% Slovak 2%
- Foreign-born
- 10% · Canada
- Languages at home
- 88% English-only · Spanish 9% Other Indo-European 1% Russian/Polish/Slavic 1%
Political lean MEDSL · Lee
- 2024 margin
- Strong R (+28.4) · D 35.5% · R 63.9%
- 2008→2024 swing
- -18.0pp toward R · 2008: -10.4pp · 2024: -28.4pp
- All cycles
- 2024: R+28.4 2020: R+19.2 2016: R+20.4 2012: R+16.6 2008: R+10.4
Not yet ingested
- Civics
- —
Market trends
- HPI YoY
- ▼ -122.28%
- Current HPI
- 282.2895
- Rent YoY
- ▲ 2.63%
- Metro
- Cape Coral-Fort Myers, FL
- State GDP YoY
- ▲ 3.28%
- F500 in state
- 36
Industry mix (Fortune 500 HQ in FL)
| Industry | F500 HQs | Revenue |
|---|---|---|
| Industrial Technology | 2 | $29B |
|
||
| Insurance | 2 | $17B |
|
||
| Retail | 1 | $60B |
|
||
| Technology Distribution | 1 | $58B |
|
||
| Homebuilding | 1 | $35B |
|
||
| Technology Manufacturing | 1 | $35B |
|
||
Price history
-20.1% since first listed21 events — show timeline
- 2026-04-16 Listed $99,500 FORTMLS
- 2026-02-11 Listing Removed — FORTMLS
- 2025-03-10 Listed $119,000 FORTMLS
- 2022-12-13 Sold (Public Records) $150,000 Public Records
- 2022-12-09 Sold (MLS) $150,000 FORTMLS
- 2022-10-17 Pending — FORTMLS
- 2022-10-17 Relisted — FORTMLS
- 2022-10-11 Listing Removed — FORTMLS
- 2022-10-06 Relisted — FORTMLS
- 2022-09-13 Pending — FORTMLS
- 2022-09-12 Listing Removed — FORTMLS
- 2022-09-06 Pending — FORTMLS
- 2022-09-02 Relisted — FORTMLS
- 2022-09-02 Pending — FORTMLS
- 2022-08-22 Listed $184,500 FORTMLS
- 2021-07-20 Sold (Public Records) $112,800 Public Records
- 2021-07-16 Sold (MLS) $112,750 FORTMLS
- 2021-06-29 Pending — FORTMLS
- 2021-06-22 Relisted — FORTMLS
- 2021-06-21 Pending — FORTMLS
- 2021-06-08 Listed $124,500 FORTMLS
Property tax history
+14.4%/yrLatest (2025): $1,507 · -14.2% YoY. Source: county tax records.
Cash-flow waterfall
monthlySold comps — $/sqft
last 12 mo · ≤1 miLoading sold comps…