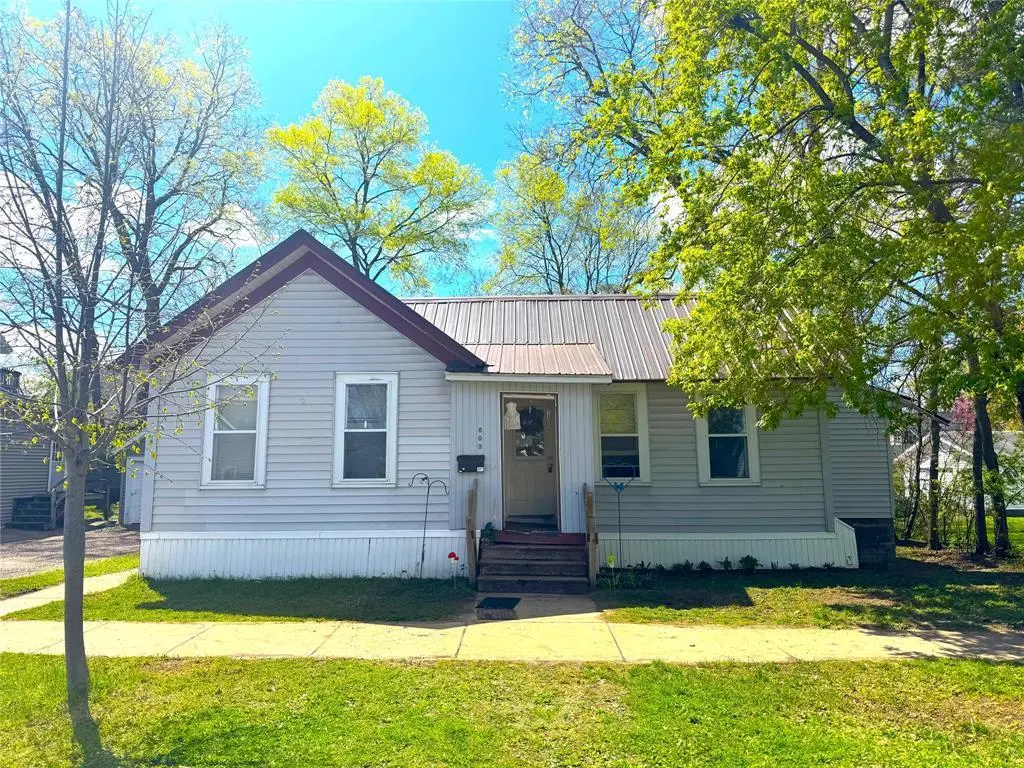
809 Niagara St · Eau Claire, WI
Flood risk 5/10 · Moderate
- FEMA flood zone
- X (unshaded)
- Chance of flooding over 30 yrs
- 0.24%
- Est. flood insurance / yr
- $473 – $860
Fire risk 3/10 · Minor
- Est. fire insurance / yr
- $636 – $1,182
Heat risk 2/10 · Minimal
- Hot days now (above 98°F)
- 7 days/yr
- Hot days in 30 yrs
- 14 days/yr
Wind risk 1/10 · Minimal
- Chance of severe wind over 30 yrs
- —
Air-quality risk 2/10 · Minimal
- Unhealthy air days now
- 1 days/yr
- Unhealthy air days in 30 yrs
- 1 days/yr
Risk factors via First Street. Map © Google.
Why this score? — see what drove the D grade
The composite is a weighted blend of 9 inputs, each scored 0–100. Each bar is that input's sub-score; the figure is the points it added to the 100-point composite (weight × sub-score).
- ARV discount +14.1/15.0
- Cash flow +9.4/30.0
- Livability +4.5/5.0
- Schools +3.5/10.0
- Rent growth +3.0/5.0
- 1% rule +2.8/10.0
- DSCR +2.6/10.0
- Condition / age +2.2/5.0
- Appreciation +0.0/10.0
$200,000
🖨 Deal sheet 📄 Offer letter ✓ Due diligence
Listing remarks
5-Bedroom Investment Property Near Campus & Water St. This spacious 5-bedroom, 1-bath home is ideally located close to campus and Water St. , making it a strong performer in the rental market. The property features steel roofing, vinyl siding, central air, a 22x20 detached garage, alley access, and a nice backyard area. Inside, you?ll find in-unit laundry, some hardwood flooring, and a layout well-suited for student or group living. This is an established rental property and is ready to start making your money work for you. Listing Agent is nephew of Seller.
Key facts
- Steel roofing
- Investment property
- Near campus
Tags
Property features AI
Exterior
- Parking: Detached 1-car garage
- Utilities: Municipal water; Municipal sewer; Natural gas service
- Home design: Single-family, one-story home; Approximately 1,160 finished above-grade square feet; Lot smaller than 1/2 acre (about 0.19 acre)
- Construction: Finished below grade: none
- Exterior features: Enclosed porch; Vinyl siding
Interior
- Kitchen: Range/oven; Refrigerator
- Bedrooms: Main-level master bedroom, approximately 10 x 10; Main-level bedroom, approximately 10 x 8; Main-level bedroom, approximately 14 x 12; Main-level bedroom, approximately 14 x 7
- Bathrooms: One full bathroom
- Heating & cooling: Forced air heating (natural gas); Central air conditioning
- Interior features: Circuit breakers; Partial crawl space basement with block and stone
Neighborhood map
What this means for you Summary
Snapshot
- This is a 5-bed/1.0-bath single-family listed at $200k. Condition is rated fair.
Deal economics
- At list price, monthly cash flow is $-144 ($-2k/yr) — negative.
- To cash-flow at today's rent, offer at most $179k (10.4% below list).
- To meet the 1% rule (rent ≥ 1% of price), the offer needs to be $157k (21.7% below list).
- Recommended offer: $157k (21.7% below list) — sets the bar for 1% rule.
- Cap rate 5.4% vs local median 2.4% in Eau Claire — top-decile yield for the area; either an underpriced asset or a hidden risk that comps aren't pricing in. Stress-test before assuming the spread holds.
Location & tenants
- Location reads 89/100 on livability (#10 in WI, #121 nationally) — a professional / high-income tenant draw. Strengths: amenities A+, cost of living A+, housing A+.
- Eau Claire Area School District (urban): math 38% / reading 43% proficiency, ranked #150 of 342 in WI (top 44%) — families likely to look elsewhere, expect single-tenant / working-renter base with shorter leases.
- Market conditions: Rents rising (+2.0%/yr); 212 active listings in the ZIP; 4 comparable units currently listed for rent nearby; rentals leasing fast (median 13d on market — plan ~1-2 weeks tenant-placement turnaround); 583 units permitted in Eau Claire County in 2024 (325 in 5+ unit buildings).
Forward outlook
- Local home prices are declining (-3.0%/yr); year-one equity from $1k of loan paydown is wiped out by about $6k of value loss. Plan a longer hold.
- Eau Claire County population projected at +14% by 2050 — modest demand growth; plan on rents tracking national, not racing it.
Negotiation context
- It's been on market 49 days — a 3% lower offer ($194k) is reasonable based on typical stale-listing flexibility.
Risks & watch-outs
- Watch-outs: built in 1880 — expect roof / HVAC / electrical / plumbing capex.
- Climate carrying-cost: moderate flood risk — expect insurance premiums to compound above CPI over the hold.
Questions for the listing agent
- What do current leases actually rent for vs. the listed asking? Can we see a recent rent roll and the last 12 months of T-12 income?
- It's been on market 49 days. Have you received any prior offers? Is the seller open to a 22% concession, seller financing, or rate buy-down credit?
- Have any recent inspections been done? Can we get a copy of the seller's disclosures and any deferred-maintenance estimates?
- Built in 1880 — when were the roof, HVAC, electrical panel, plumbing, and water heater last replaced?
- Is there a deadline driving the sale (1031 exchange, divorce, estate, relocation)? That informs how much negotiation room exists.
- Schools are B-rated — typically a magnet for longer-tenancy family renters. What's the average tenant stay here, and is there a school-zone premium baked into asking?
- The area grade is low — what's the realistic commute time and amenity access for the typical tenant pool here? Any planned neighborhood developments (good or bad) we should know about?
- What's the average days-on-market for RENTAL listings here right now (not sales)? A rising rental-DOM trend means longer vacancies and softer asking-rent achievability than the comps imply.
- What's the recent tenant-quality profile in this submarket — average credit score on applications, eviction rate, late-payment / NSF rate, and stable-employment percentage? A property-management company in the area should have these aggregated.
- How much new for-sale + rental construction is in the pipeline within 1–3 miles? Heavy new supply typically softens prices + rents 12–24 months out; constrained supply supports both.
Investment metrics
- 1% rule
- 0.78% ✗
- Cap rate
- 5.43%
- Cash-on-cash
- -3.09%
- DSCR
- 0.86
- GRM
- 10.6
CMA / ARV
- ARV (median comp)
- $234,190
- List price
- $200,000
- Delta
- -14.60%
- Verdict
- UNDERPRICED
- Comps
- 7 within 1.0 mi
Show comp detail 2 sales within ~0.75 mi
| Address | Dist | Beds/Ba | Sqft | Sold | Price | $/sf | Match |
|---|---|---|---|---|---|---|---|
| 509 Union St | 0.44mi | 4/1.0 (-1) | 1,209 (+4%) | 2mo | $235,000 | $194 | 66 |
| 917 Lakeside Ave | 0.15mi | 4/1.0 (-1) | 1,256 (+8%) | 22mo | $160,000 | $127 | 56 |
Match score weights: distance 35% · size 25% · config 20% · recency 20%. Top-matched comps best support the ARV.
Projected returns pro-forma
-3.0% appreciation · 2.01% rent growth · sell at horizon
- IRR
- -22.6%
- Equity multiple
- 0.23×
- Total profit
- $-43,126
- Equity at exit
- $29,821
- IRR
- -19.5%
- Equity multiple
- 0.01×
- Total profit
- $-55,515
- Equity at exit
- $17,292
Cash invested: $56,000 (down + closing). Projections, not guarantees.
Landlord ↔ Tenant lean methodology
- Overall (STATE)
- 73 Landlord-Friendly
- State Wisconsin
- 73 Landlord-Friendly · R+2
- County
- — inherits STATE
- City
- — inherits STATE
ZIP-level market 54703
- Rents YoY
- 2.0%
- Active inventory
- 212
- Price-to-rent
- 10.6×
Monthly cashflow live
- Estimated rent
- $1,567 medium interval (Pro) →
- Mortgage (P&I)
- −$1,049
- Tax est. 1.5%
- −$250 /mo · $3,000/yr
- Insurance
- −$83
- HOA
- −$0
- Vacancy / Maint / Mgmt
- −$329
- Net cashflow
- $-144
Break-even live
UW: 25.0% down · 7.5% · 30yr · 1.5% tax · 5.0% vac · 8.0% maint · 8.0% mgmt
Financing live
Cash to close
- Down payment
- $50,000
- Closing costs
- $6,000
- Reserves months
- —
- Total cash needed
- —
Loan-product check · same deal, 3 products live
Conventional
25% down · 7.5% · 30yr
- Down + closing
- —
- Monthly P&I
- —
- Monthly cashflow
- —
- DSCR
- —
- Eligible?
- —
Personal DTI + credit; lowest rate.
DSCR
20% down · 8.5% · 30yr
- Down + closing
- —
- Monthly P&I
- —
- Monthly cashflow
- —
- DSCR
- —
- Eligible?
- —
No personal income docs; deal must DSCR.
Hard money
10% down · 12.0% · 12mo
- Down + closing
- —
- Monthly P&I
- —
- Monthly cashflow
- —
- DSCR
- —
- Eligible?
- —
Short-term bridge; refi at stabilization.
Rent comps 4 comps
| Address | Beds | Baths | Sqft | Rent | $/sqft | DOM | Units | Dist |
|---|---|---|---|---|---|---|---|---|
| 315 9th Ave Eau Claire, WI | 4.0 | 1.0 | 1260 | $1,425 | $1.13 | 13d | 1 | 0.09mi |
| 1014 Oxford Ave Unit 1/2 Eau Claire, WI | 4.0 | 1.0 | 1244 | $1,396 | $1.12 | 43d | 1 | 0.62mi |
| 510 Washington St Eau Claire, WI | 4.0 | 2.0 | 1000 | $1,450 | $1.45 | 13d | 1 | 1.26mi |
| 1211 S Dewey St Eau Claire, WI | 4.0 | 1.0 | 1000 | $1,448 | $1.45 | 13d | 2 | 1.29mi |
Listing history 16 events
-
2026-06-19days on market $200,000 Active 49 DOM
-
2026-06-18days on market $200,000 Active 48 DOM
-
2026-06-17days on market $200,000 Active 47 DOM
-
2026-06-16days on market $200,000 Active 46 DOM
-
2026-06-15days on market $200,000 Active 45 DOM
-
2026-06-13days on market $200,000 Active 42 DOM
-
2026-06-10days on market $200,000 Active 40 DOM
-
2026-06-09days on market $200,000 Active 39 DOM
-
2026-06-08days on market $200,000 Active 38 DOM
-
2026-06-07days on market $200,000 Active 37 DOM
-
2026-06-05days on market $200,000 Active 34 DOM
-
2026-06-02days on market $200,000 Active 32 DOM
-
2026-06-01days on market $200,000 Active 31 DOM
-
2026-05-31days on market $200,000 Active 30 DOM
-
2026-05-30days on market $200,000 Active 29 DOM
-
2026-05-01$200,000 Active 570-char remark
ⓘ Source: listings_history table (triggers on properties + properties_extension) + one-shot
backfill from property_details.listing_events for pre-trigger history.
Climate risk First Street
- Flood 5/10 Major FEMA zone X (unshaded) · 24% chance over 30 yrs
- Wildfire 3/10 Moderate
- Heat 2/10 Low 7 d/yr ≥98°F today · 14 d/yr by 30 yrs out
- Wind 1/10 Low
- Air quality 2/10 Low 1 unhealthy d/yr today · 1 by 30 yrs out
Nearby sold comps map
Loading sold comps map…
Walkable amenities ~0.75 mi
Loading nearby amenities…
Taxation est. · year 1
- Rental income
- $18,802
- − Mortgage interest
- −$11,203
- − Property taxes
- −$3,000
- − Insurance
- −$1,000
- − Repairs & maintenance
- −$1,504
- − Management
- −$1,504
- − Depreciation
- −$5,818
- Taxable loss
- −$5,228
- Est. tax savings @ 24.0%
- +$1,255
- After-tax cash flow
- $-478/yr
For passive investors: Depreciation is non-cash, so a rental often shows a tax loss while cash-flowing — sheltering income. Rental losses are passive: they offset passive income freely, and up to $25,000/yr can offset ordinary (W-2) income if you actively participate and your MAGI is under $100k (phasing out to $0 by $150k); unused losses carry forward. On sale, claimed depreciation is recaptured at up to 25%, and gains may owe capital-gains tax (a 1031 exchange can defer both). Figures are a year-1 estimate at your 24.0% rate — not tax advice; consult a CPA.
Condition & rehab AI · 12 photos
This 5-bedroom home requires moderate renovations to update the kitchen and bathrooms, paint interior walls, and improve the landscaping and curb appeal. These updates will significantly increase its value for both resale and rental purposes.
Repairs flagged
- Major kitchen cabinets — outdated and in poor condition
- Major kitchen appliances — outdated and in poor condition
- Major kitchen countertops — outdated and in poor condition
- Major bathroom fixtures — outdated and in poor condition
- Major bathroom flooring — outdated and in poor condition
- Minor interior walls — some peeling paint
Value-add opportunities
- Both update kitchen and bathrooms — modernizing the kitchen and bathrooms will increase both resale and rental value
- Both paint interior walls — painting interior walls will improve the home's appearance and increase its value
- Both landscaping and curb appeal — improving the landscaping and curb appeal will increase both resale and rental value
Renovation cost estimate screening
| Repair item | Severity | Est. cost |
|---|---|---|
| kitchen cabinets · outdated and in poor condition | Major | $15,000–50,000 |
| kitchen appliances · outdated and in poor condition | Major | $15,000–50,000 |
| kitchen countertops · outdated and in poor condition | Major | $15,000–50,000 |
| bathroom fixtures · outdated and in poor condition | Major | $15,000–50,000 |
| bathroom flooring · outdated and in poor condition | Major | $15,000–50,000 |
| interior walls · some peeling paint | Minor | $500–3,000 |
| Total estimated repair cost · 6 items | $75,500–253,000 |
Value-add ROI direction
- Both update kitchen and bathrooms — modernizing the kitchen and bathrooms will increase both resale and rental value ↑
- Both paint interior walls — painting interior walls will improve the home's appearance and increase its value ↑
- Both landscaping and curb appeal — improving the landscaping and curb appeal will increase both resale and rental value ↑
ⓘ Cost ranges are severity-bucket heuristics (US national rule-of-thumb). Get contractor quotes + a written scope before underwriting a rehab budget.
Schools (NCES district)
- District
- Eau Claire Area School District
- NCES district ID
- 5504050
- Math proficiency
- 38% ▼ -9.00%
- Reading proficiency
- 43% ▬ 0.00%
- Median HH income
- $48,206
- Composite
- 34.72/100
- National rank
- #5135
- State rank
- #150 of 342 in WI
Livability — Eau Claire
- Score
- 89/100
- State rank
- #10
- US rank
- #121
Category grades
Schools grade is shown separately in the Schools card above.
Census & demographics
- Census place
- Eau Claire, WI
- County
- Eau Claire County · 96,114 people
- City population
- 87,167
- Metro
- Eau Claire, WI
- Population (ZIP)
- 44,153
- Household income
- $71,518
- Rent vs Own
- Severe rent burden
- 1614.0
Population outlook (Eau Claire County) Hauer SSP2
- Today (2025)
- 109,006 people
- By 2030
- 112,587 · +3.3%
- By 2040
- 118,674 · +8.9%
- By 2050
- 124,085 · +13.8%
- By 2075
- 135,804 · +24.6%
- By 2100
- 139,875 · +28.3%
Race, ethnicity, and origin ACS 2023
- Neighborhood character
- Predominantly White (85%)
- Race & ethnicity
- White 85% Asian 6% Two or more races 4% Hispanic / Latino 4% Black 2%
- Common ancestry
- Portuguese 16% Romanian 5% Lithuanian 3%
- Foreign-born
- 3% · Canada, China
- Languages at home
- 92% English-only · Other Asian/Pacific 4% Spanish 3%
Political lean MEDSL · Eau Claire
- 2024 margin
- D (+10.6) · D 54.6% · R 44.0% · Other 1.4%
- 2008→2024 swing
- -11.6pp toward R · 2008: 22.1pp · 2024: 10.6pp
- All cycles
- 2024: D+10.6 2020: D+10.8 2016: D+7.3 2012: D+13.6 2008: D+22.1
Not yet ingested
- Civics
- —
Market trends
- HPI YoY
- ▼ -276.20%
- Current HPI
- 218.2747
- Rent YoY
- ▲ 2.01%
- Metro
- Eau Claire, WI
- State GDP YoY
- ▲ 2.10%
- F500 in state
- 20
Industry mix (Fortune 500 HQ in WI)
| Industry | F500 HQs | Revenue |
|---|---|---|
| Industrial Machinery | 4 | $23B |
|
||
| Industrial Technology | 2 | $36B |
|
||
| Insurance | 1 | $36B |
|
||
| Professional Services | 1 | $19B |
|
||
| Utilities | 1 | $9B |
|
||
| Consumer Goods | 1 | $3B |
|
||
Price history
1 event — show timeline
- 2026-05-01 Listed $200,000 RANWW
Cash-flow waterfall
monthlySold comps — $/sqft
last 12 mo · ≤1 miLoading sold comps…