 Multi-family
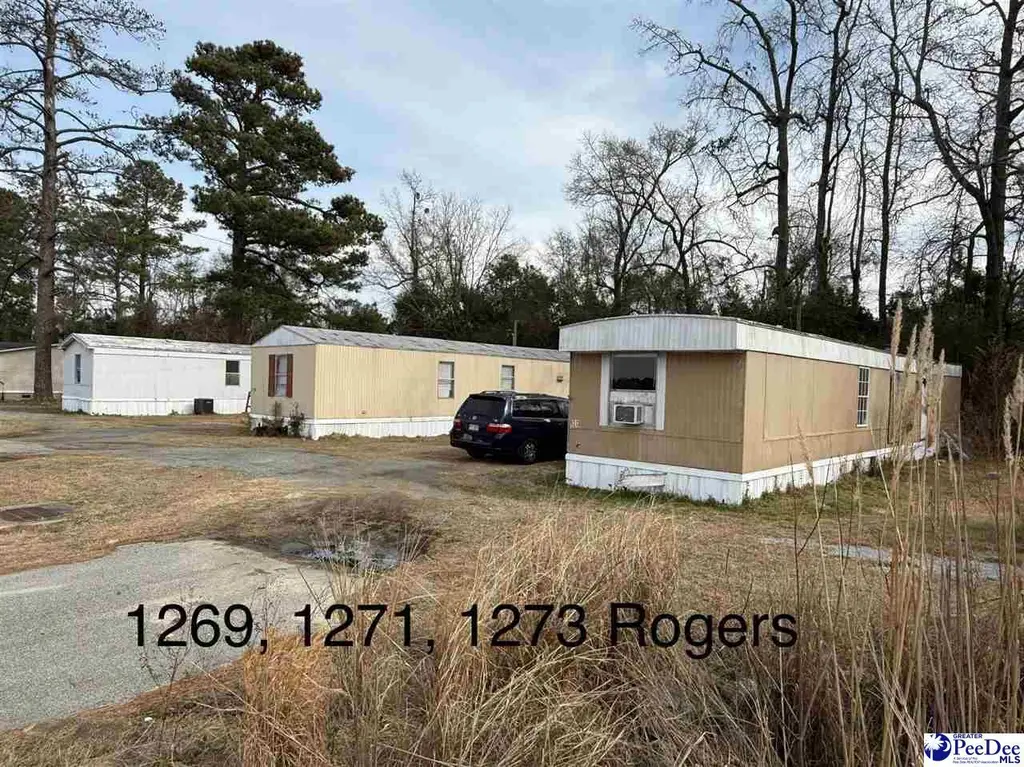
1269 Timmonsville Hwy · Darlington, SC
Flood risk 1/10 · Minimal
- FEMA flood zone
- X (unshaded)
- Chance of flooding over 30 yrs
- 0.0%
- Est. flood insurance / yr
- $507 – $1,088
Fire risk 2/10 · Minimal
- Est. fire insurance / yr
- $783 – $1,453
Heat risk 7/10 · Major
- Hot days now (above 108°F)
- 7 days/yr
- Hot days in 30 yrs
- 16 days/yr
Wind risk 8/10 · Major
- Chance of severe wind over 30 yrs
- 80.0%
Air-quality risk 1/10 · Minimal
- Unhealthy air days now
- 0 days/yr
- Unhealthy air days in 30 yrs
- 0 days/yr
Risk factors via First Street. Map © Google.
Why this score? — see what drove the B- grade
The composite is a weighted blend of 9 inputs, each scored 0–100. Each bar is that input's sub-score; the figure is the points it added to the 100-point composite (weight × sub-score).
- Cash flow +30.0/30.0
- 1% rule +10.0/10.0
- DSCR +10.0/10.0
- ARV discount +7.5/15.0
- Livability +2.9/5.0
- Schools +2.7/10.0
- Rent growth +2.5/5.0
- Condition / age +1.0/5.0
- Appreciation +0.0/10.0
$99,000
🖨 Deal sheet 📄 Offer letter ✓ Due diligence
Multi-family units
County records classify this as Multi-Family (2-4 Unit). Listing-text estimate: 1 unit. estimate disagrees with records
Listing remarks
Cash Buyer required. Property currently generates $12,000 in gross operating income annually and could easily produce over $20,000 annually. Buyer and buyers agent to verify all information during due diligence, including square footage, years built, etc. Sellers will not make any repairs, this is an as-is/where is sale. Parcels include 1269 Timmonsville Hwy, 1271 Timmonsville Hwy, and 1273 Timmonsville Hwy.
Key facts
- 6 parking spots
- Built 1999
- Listed 59 days
Property features AI
Exterior
- Parking: 6 parking spaces
- Home design: One-story multi-family residential income property
- Exterior features: Located in the County subdivision
Neighborhood map
What this means for you Summary
Snapshot
- This is a multifamily listed at $99k. Condition is rated poor.
Deal economics
- At list price, monthly cash flow is $1k ($16k/yr) — positive.
- The deal already cash-flows at list — no discount required.
- Meets the 1% rule at list price ($3k rent vs $99k).
- Recommended offer: $96k (3.0% below list) — sets the bar for market timing.
- Cap rate 22.9% vs local median 3.6% in Darlington — top-decile yield for the area; either an underpriced asset or a hidden risk that comps aren't pricing in. Stress-test before assuming the spread holds.
Location & tenants
- Location reads 57/100 on livability (#268 in SC) — a working-class tenant base; expect higher turnover. Strengths: cost of living A+, housing A+; Watch: crime F, amenities F, commute F.
- Darlington 01 (town): math 27% / reading 37% proficiency, ranked #52 of 80 in SC (top 65%) — families likely to look elsewhere, expect single-tenant / working-renter base with shorter leases; 75% free/reduced lunch — lower-income household profile, screen leases tightly.
- Zoned schools: Darlington Middle (math 21% / reading 28%, grade F, #166 of 229 statewide, top 72%, 919 students, 100% FRL); Darlington High (math 49% / reading 73%, grade C+, #105 of 196 statewide, top 54%, 1,054 students, 100% FRL) — zoned schools average 100% FRL vs 75% district-wide (25 pts higher); higher-poverty schools than district average — tighter screening recommended.
- Market conditions: 123 active listings in the ZIP; 195 units permitted in Darlington County in 2024 (0 in 5+ unit buildings).
Forward outlook
- Local home prices are declining (-3.0%/yr); year-one equity from $684 of loan paydown is wiped out by about $3k of value loss. Plan a longer hold.
- Darlington County population projected at -18% by 2050 — secular population decline; favor cash flow + early exit over multi-decade hold.
- At projected returns (-3.0% appreciation + 3.0% rent growth), your $28k cash investment doubles in ~2 years — after that, you're playing with house money.
Negotiation context
- It's been on market 60 days — a 3% lower offer ($96k) is reasonable based on typical stale-listing flexibility.
Risks & watch-outs
- Climate carrying-cost: severe wind risk, 80% chance of damaging wind over 30y; extreme-heat days projected 7→16/yr by 2055 (HVAC capex compounding) — expect insurance premiums to compound above CPI over the hold.
Questions for the listing agent
- It's been on market 60 days. Have you received any prior offers? Is the seller open to a 3% concession, seller financing, or rate buy-down credit?
- Have any recent inspections been done? Can we get a copy of the seller's disclosures and any deferred-maintenance estimates?
- Is there a deadline driving the sale (1031 exchange, divorce, estate, relocation)? That informs how much negotiation room exists.
- Schools are D-rated, which usually means shorter tenancies and higher turnover. Who's the typical renter profile here, and what's been the actual vacancy rate?
- Crime grade is F in this area — have there been break-ins, vandalism, or insurance claims at this property in the last 3 years? What carrier currently insures it and at what premium?
- What's the average days-on-market for RENTAL listings here right now (not sales)? A rising rental-DOM trend means longer vacancies and softer asking-rent achievability than the comps imply.
- What's the recent tenant-quality profile in this submarket — average credit score on applications, eviction rate, late-payment / NSF rate, and stable-employment percentage? A property-management company in the area should have these aggregated.
- How much new apartment / multifamily construction is in the pipeline within 1–3 miles? Heavy new supply (>2% of stock underway) typically softens rents 12–24 months out; light construction supports rent growth.
Investment metrics
- 1% rule
- 2.62% ✓
- Cap rate
- 22.86%
- Cash-on-cash
- 59.16%
- DSCR
- 3.63
- GRM
- 3.2
CMA / ARV
No comps found within radius.
Projected returns pro-forma
-3.0% appreciation · 3.0% rent growth · sell at horizon
- IRR
- 57.8%
- Equity multiple
- 3.56×
- Total profit
- $71,041
- Equity at exit
- $14,761
- IRR
- 62.7%
- Equity multiple
- 7.28×
- Total profit
- $174,104
- Equity at exit
- $8,560
Cash invested: $27,720 (down + closing). Projections, not guarantees.
Landlord ↔ Tenant lean methodology
- Overall (STATE)
- 90 Strongly Landlord-Friendly
- State South Carolina
- 90 Strongly Landlord-Friendly · R+6
- County
- — inherits STATE
- City
- — inherits STATE
ZIP-level market 29532
- Active inventory
- 123
- Price-to-rent
- 9.5×
Monthly cashflow live
- Estimated rent
- $2,596 medium interval (Pro) →
- Mortgage (P&I)
- −$519
- Tax est. 1.5%
- −$124 /mo · $1,485/yr
- Insurance
- −$41
- HOA
- −$0
- Vacancy / Maint / Mgmt
- −$545
- Net cashflow
- $1,367
Break-even live
3-unit breakdown (identical units grouped — click to expand)
| Units | Beds | Baths | Est. rent |
|---|---|---|---|
| 3× units | 2 | 1 | $2,595 |
| #1 | 2 | 1 | $865 |
| #2 | 2 | 1 | $865 |
| #3 | 2 | 1 | $865 |
| Total (3 units) | $2,596 | ||
UW: 25.0% down · 7.5% · 30yr · 1.5% tax · 5.0% vac · 8.0% maint · 8.0% mgmt
Financing live
Cash to close
- Down payment
- $24,750
- Closing costs
- $2,970
- Reserves months
- —
- Total cash needed
- —
Loan-product check · same deal, 3 products live
Conventional
25% down · 7.5% · 30yr
- Down + closing
- —
- Monthly P&I
- —
- Monthly cashflow
- —
- DSCR
- —
- Eligible?
- —
Personal DTI + credit; lowest rate.
DSCR
20% down · 8.5% · 30yr
- Down + closing
- —
- Monthly P&I
- —
- Monthly cashflow
- —
- DSCR
- —
- Eligible?
- —
No personal income docs; deal must DSCR.
Hard money
10% down · 12.0% · 12mo
- Down + closing
- —
- Monthly P&I
- —
- Monthly cashflow
- —
- DSCR
- —
- Eligible?
- —
Short-term bridge; refi at stabilization.
Listing history 18 events
-
2026-06-19days on market $99,000 Active 60 DOM
-
2026-06-18days on market $99,000 Active 59 DOM
-
2026-06-17days on market $99,000 Active 58 DOM
-
2026-06-16days on market $99,000 Active 57 DOM
-
2026-06-15days on market $99,000 Active 56 DOM
-
2026-06-14days on market $99,000 Active 54 DOM
-
2026-06-13days on market $99,000 Active 53 DOM
-
2026-06-10days on market $99,000 Active 51 DOM
-
2026-06-09days on market $99,000 Active 50 DOM
-
2026-06-08days on market $99,000 Active 49 DOM
-
2026-06-07days on market $99,000 Active 48 DOM
-
2026-06-05days on market $99,000 Active 45 DOM
-
2026-06-03days on market $99,000 Active 44 DOM
-
2026-06-02days on market $99,000 Active 43 DOM
-
2026-06-01days on market $99,000 Active 42 DOM
-
2026-05-31days on market $99,000 Active 41 DOM
-
2026-05-30days on market $99,000 Active 40 DOM
-
2026-04-20$99,000 Active
ⓘ Source: listings_history table (triggers on properties + properties_extension) + one-shot
backfill from property_details.listing_events for pre-trigger history.
Climate risk First Street
- Flood 1/10 Low FEMA zone X (unshaded) · 0% chance over 30 yrs
- Wildfire 2/10 Low
- Heat 7/10 Severe 7 d/yr ≥108°F today · 16 d/yr by 30 yrs out
- Wind 8/10 Severe 80% chance of damaging wind over 30 yrs
- Air quality 1/10 Low 0 unhealthy d/yr today · 0 by 30 yrs out
Nearby sold comps map
Loading sold comps map…
Walkable amenities ~0.75 mi
Loading nearby amenities…
Taxation est. · year 1
- Rental income
- $31,152
- − Mortgage interest
- −$5,546
- − Property taxes
- −$1,485
- − Insurance
- −$495
- − Repairs & maintenance
- −$2,492
- − Management
- −$2,492
- − Depreciation
- −$2,880
- Taxable income
- $15,762
- Est. tax owed @ 24.0%
- −$3,783
- After-tax cash flow
- $12,617/yr
For passive investors: Depreciation is non-cash, so a rental often shows a tax loss while cash-flowing — sheltering income. Rental losses are passive: they offset passive income freely, and up to $25,000/yr can offset ordinary (W-2) income if you actively participate and your MAGI is under $100k (phasing out to $0 by $150k); unused losses carry forward. On sale, claimed depreciation is recaptured at up to 25%, and gains may owe capital-gains tax (a 1031 exchange can defer both). Figures are a year-1 estimate at your 24.0% rate — not tax advice; consult a CPA.
Condition & rehab AI · 8 photos
This multi-family property requires extensive repairs and updates to improve its condition and increase its resale and rental value.
Repairs flagged
- Major roof — Significant wear and tear.
- Major siding — Peeling and chipping paint.
- Major flooring — Worn and in need of replacement.
- Major interior walls/paint — Wear and discoloration.
- Major HVAC/mechanicals — Old and may need replacement.
- Major landscaping — Sparse and in need of improvement.
- Major foundation/structure — Signs of settling and potential structural issues.
Value-add opportunities
- Both roof replacement — Improves both resale and rental value.
- Both exterior siding and paint — Enhances curb appeal and value.
- Both HVAC replacement — Improves comfort and energy efficiency.
- Both landscaping and curb appeal — Enhances curb appeal and value.
- Both foundation repair — Improves structural integrity and value.
Renovation cost estimate screening
| Repair item | Severity | Est. cost |
|---|---|---|
| roof · Significant wear and tear. | Major | $15,000–50,000 |
| siding · Peeling and chipping paint. | Major | $15,000–50,000 |
| flooring · Worn and in need of replacement. | Major | $15,000–50,000 |
| interior walls/paint · Wear and discoloration. | Major | $15,000–50,000 |
| HVAC/mechanicals · Old and may need replacement. | Major | $15,000–50,000 |
| landscaping · Sparse and in need of improvement. | Major | $15,000–50,000 |
| foundation/structure · Signs of settling and potential structural issues. | Major | $15,000–50,000 |
| Total estimated repair cost · 7 items | $105,000–350,000 |
Value-add ROI direction
- Both roof replacement — Improves both resale and rental value. ↑
- Both exterior siding and paint — Enhances curb appeal and value. ↑
- Both HVAC replacement — Improves comfort and energy efficiency. ↑
- Both landscaping and curb appeal — Enhances curb appeal and value. ↑
- Both foundation repair — Improves structural integrity and value. ↑
ⓘ Cost ranges are severity-bucket heuristics (US national rule-of-thumb). Get contractor quotes + a written scope before underwriting a rehab budget.
Schools (NCES district)
- District
- Darlington 01
- NCES district ID
- 4501860
- Math proficiency
- 27% ▼ -13.00%
- Reading proficiency
- 37% ▼ -1.00%
- Median HH income
- $36,243
- Composite
- 26.51/100
- National rank
- #7202
- State rank
- #52 of 80 in SC
Livability — Darlington
- Score
- 57/100
- State rank
- #268
- US rank
- #21556
Category grades
Schools grade is shown separately in the Schools card above.
Census & demographics
- Population (ZIP)
- 20,272
Population outlook (Darlington County) Hauer SSP2
- Today (2025)
- 64,981 people
- By 2030
- 62,846 · -3.3%
- By 2040
- 58,146 · -10.5%
- By 2050
- 53,541 · -17.6%
- By 2075
- 43,477 · -33.1%
- By 2100
- 34,013 · -47.7%
Race, ethnicity, and origin ACS 2023
- Neighborhood character
- Diverse neighborhood (Simpson 0.56)
- Race & ethnicity
- Black 54% White 39% Two or more races 4% Hispanic / Latino 4%
- Common ancestry
- Slovak 2% Italian 2% Serbian 1%
- Foreign-born
- 1% · Canada
- Languages at home
- 97% English-only · Spanish 2%
Political lean MEDSL · Darlington
- 2024 margin
- R (+13.3) · D 42.8% · R 56.1% · Other 1.1%
- 2008→2024 swing
- -13.2pp toward R · 2008: -0.1pp · 2024: -13.3pp
- All cycles
- 2024: R+13.3 2020: R+5.0 2016: R+3.7 2012: D+3.4 2008: R+0.1
Not yet ingested
- Civics
- —
Market trends
- HPI YoY
- ▼ -102.58%
- Current HPI
- 149.1051
- Rent YoY
- —
- Metro
- —
- State GDP YoY
- ▲ 4.51%
- F500 in state
- 2
Industry mix (Fortune 500 HQ in SC)
| Industry | F500 HQs | Revenue |
|---|---|---|
| Packaging | 1 | $7B |
|
||
Price history
1 event — show timeline
- 2026-04-20 Listed $99,000 RAGPD
Cash-flow waterfall
monthlySold comps — $/sqft
last 12 mo · ≤1 miLoading sold comps…