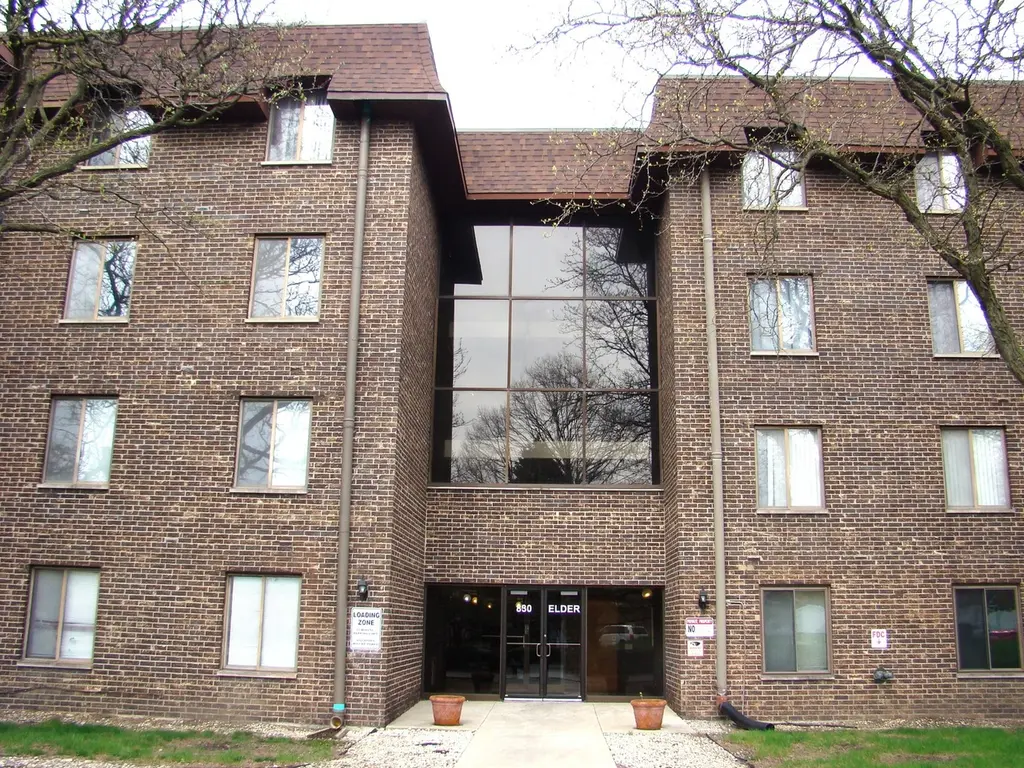
830 Elder Rd Unit B202 · Homewood, IL
Flood risk 1/10 · Minimal
- FEMA flood zone
- X (unshaded)
- Chance of flooding over 30 yrs
- 0.0%
- Est. flood insurance / yr
- $507 – $1,088
Fire risk 1/10 · Minimal
- Est. fire insurance / yr
- $804 – $1,492
Heat risk 3/10 · Minor
- Hot days now (above 101°F)
- 7 days/yr
- Hot days in 30 yrs
- 15 days/yr
Wind risk 2/10 · Minimal
- Chance of severe wind over 30 yrs
- —
Air-quality risk 4/10 · Minor
- Unhealthy air days now
- 4 days/yr
- Unhealthy air days in 30 yrs
- 5 days/yr
Risk factors via First Street. Map © Google.
Why this score? — see what drove the D- grade
The composite is a weighted blend of 9 inputs, each scored 0–100. Each bar is that input's sub-score; the figure is the points it added to the 100-point composite (weight × sub-score).
- Cash flow +10.6/30.0
- ARV discount +7.5/15.0
- 1% rule +7.2/10.0
- Livability +4.0/5.0
- DSCR +3.1/10.0
- Rent growth +2.5/5.0
- Condition / age +2.5/5.0
- Schools +2.4/10.0
- Appreciation +0.0/10.0
$134,900
🖨 Deal sheet 📄 Offer letter ✓ Due diligence
Listing remarks
GARAGE! GARAGE! GARAGE! Don't miss your opportunity to own this well-maintained condo with a separate deeded parking garage located in the Homewood Shores Subdivision and in the highly regarded Homewood-Flossmoor school district. This end unit condo features an updated kitchen with stainless steel appliances, granite countertops, ceramic flooring, wood cabinets, and recessed lighting; a primary suite with 2 closets and an updated private half bath; a coat closet; a linen closet; and a full updated bath with a soaking tub. The living room has a sliding glass patio door which leads out to a 12-foot x 5-foot balcony, offering serenity and a stunning pond view. The building features secure entr
Key facts
- Soaking tub
- Primary suite
- Updated kitchen
Tags
Property features AI
Finance
- Other: 64 units in building; Estimated living area; Commuter access: school bus, commuter bus, commuter train, interstate access
- HOA & community: Monthly association fee of $438; Association fee includes water, parking, insurance, clubhouse, pool, exterior maintenance, lawn care, scavenger, and snow removal; Pets allowed (cats and dogs; limits apply)
Exterior
- Parking: Detached garage (garage owned) with garage door opener; Total 3 parking spaces; 1 garage space
- Utilities: Lake Michigan water; Public sewer; Electric with circuit breakers
- Home design: Attached single (condo); Condo ownership; Entry level: 2; Built ~41-50 years ago; Brick construction; Built before 1978
- Construction: Brick exterior
- Exterior features: Common lot / common outdoor area
Interior
- Kitchen: Granite counters; Updated kitchen; Range; Microwave; Dishwasher; Refrigerator; Stainless steel appliances
- Bedrooms: 2 bedrooms (both on main/entry level); Master bedroom with half bath
- Flooring: Laminate; Carpet; Ceramic tile (kitchen)
- Bathrooms: 1 full bathroom; 1 half bathroom; Soaking tub
- Heating & cooling: Electric forced air heating; Central air conditioning
- Interior features: Elevator; Storage; Granite counters; Lobby; Separate dining room; Intercom; Drapes/curtains; 5 total rooms
- Laundry & utility: Common area laundry with sink; Laundry room
Neighborhood map
What this means for you Summary
Snapshot
- This is a 2-bed/1.5-bath condo listed at $135k.
Deal economics
- At list price, monthly cash flow is $-67 ($-803/yr) — negative.
- To cash-flow at today's rent, offer at most $123k (8.8% below list).
- Meets the 1% rule at list price ($2k rent vs $135k).
- Recommended offer: $123k (8.8% below list) — sets the bar for cash-flow.
Location & tenants
- Location reads 81/100 on livability (#81 in IL, #1,314 nationally) — a professional / high-income tenant draw. Strengths: commute A+, employment A+, cost of living A+; Watch: amenities F.
- Homewood Flossmoor Chsd 233 (suburban): math 21% / reading 27% proficiency, ranked #272 of 620 in IL (top 44%) — low school quality limits family demand, transient renter base, plan for 1-2y turnover.
- Zoned schools: Homewood-Flossmoor High School (math 21% / reading 27%, grade F, #304 of 693 statewide, top 44%, 2,798 students, 0% FRL).
- Market conditions: 101 active listings in the ZIP; 3 comparable units currently listed for rent nearby; rentals at typical pace (median 19d on market — plan ~3-4 weeks tenant-placement turnaround); 6,272 units permitted in Cook County in 2024 (4,658 in 5+ unit buildings).
Forward outlook
- Local home prices are declining (-3.0%/yr); year-one equity from $933 of loan paydown is wiped out by about $4k of value loss. Plan a longer hold.
Negotiation context
- It's been on market 63 days — a 6% lower offer ($127k) is reasonable based on typical stale-listing flexibility.
- Current owner paid $59k; list at $135k implies a 129% gain — meaningful room to come down on a strong offer.
Risks & watch-outs
- Watch-outs: HOA is 27% of rent.
Questions for the listing agent
- What do current leases actually rent for vs. the listed asking? Can we see a recent rent roll and the last 12 months of T-12 income?
- It's been on market 63 days. Have you received any prior offers? Is the seller open to a 9% concession, seller financing, or rate buy-down credit?
- Built in 1977 — when were the roof, HVAC, electrical panel, plumbing, and water heater last replaced?
- What does the HOA fee cover, when was the last increase, and are there any pending special assessments or reserve-fund shortfalls?
- Any open or pending special assessments — roof, HVAC, plumbing, elevator, façade? What's the per-unit balance and payoff schedule, and is the seller paying it off at close or rolling it to the buyer?
- Why hasn't it sold? Are there any deal-killer items the seller is aware of (foundation, flood, title, zoning, code violations)?
- Is there a deadline driving the sale (1031 exchange, divorce, estate, relocation)? That informs how much negotiation room exists.
- Schools are D-rated, which usually means shorter tenancies and higher turnover. Who's the typical renter profile here, and what's been the actual vacancy rate?
- The area grade is low — what's the realistic commute time and amenity access for the typical tenant pool here? Any planned neighborhood developments (good or bad) we should know about?
- What's the average days-on-market for RENTAL listings here right now (not sales)? A rising rental-DOM trend means longer vacancies and softer asking-rent achievability than the comps imply.
- What's the recent tenant-quality profile in this submarket — average credit score on applications, eviction rate, late-payment / NSF rate, and stable-employment percentage? A property-management company in the area should have these aggregated.
- How much new apartment / multifamily construction is in the pipeline within 1–3 miles? Heavy new supply (>2% of stock underway) typically softens rents 12–24 months out; light construction supports rent growth.
Investment metrics
- 1% rule
- 1.22% ✓
- Cap rate
- 5.70%
- Cash-on-cash
- -2.13%
- DSCR
- 0.91
- GRM
- 6.8
CMA / ARV
No comps found within radius.
Projected returns pro-forma
-3.0% appreciation · 3.0% rent growth · sell at horizon
- IRR
- -19.5%
- Equity multiple
- 0.32×
- Total profit
- $-25,827
- Equity at exit
- $20,114
- IRR
- -11.8%
- Equity multiple
- 0.29×
- Total profit
- $-26,782
- Equity at exit
- $11,664
Cash invested: $37,772 (down + closing). Projections, not guarantees.
Landlord ↔ Tenant lean methodology
- Overall (STATE)
- 43 Moderately Tenant-Leaning
- State Illinois
- 43 Moderately Tenant-Leaning · D+7
- County
- — inherits STATE
- City
- — inherits STATE
ZIP-level market 60430
- Home prices YoY
- -32.1%
- Active inventory
- 101
- Price-to-rent
- 6.8×
Monthly cashflow live
- Estimated rent
- $1,650 medium interval (Pro) →
- Mortgage (P&I)
- −$707
- Tax from tax record
- −$169 /mo · $2,027/yr
- Insurance
- −$56
- HOA
- −$438
- Vacancy / Maint / Mgmt
- −$347
- Net cashflow
- $-67
Break-even live
UW: 25.0% down · 7.5% · 30yr · 1.5% tax · 5.0% vac · 8.0% maint · 8.0% mgmt
Financing live
Cash to close
- Down payment
- $33,725
- Closing costs
- $4,047
- Reserves months
- —
- Total cash needed
- —
Loan-product check · same deal, 3 products live
Conventional
25% down · 7.5% · 30yr
- Down + closing
- —
- Monthly P&I
- —
- Monthly cashflow
- —
- DSCR
- —
- Eligible?
- —
Personal DTI + credit; lowest rate.
DSCR
20% down · 8.5% · 30yr
- Down + closing
- —
- Monthly P&I
- —
- Monthly cashflow
- —
- DSCR
- —
- Eligible?
- —
No personal income docs; deal must DSCR.
Hard money
10% down · 12.0% · 12mo
- Down + closing
- —
- Monthly P&I
- —
- Monthly cashflow
- —
- DSCR
- —
- Eligible?
- —
Short-term bridge; refi at stabilization.
Rent comps 3 comps
| Address | Beds | Baths | Sqft | Rent | $/sqft | DOM | Units | Dist |
|---|---|---|---|---|---|---|---|---|
| 1933 Hickory Rd Unit 1937-C Homewood, IL | 1.0 | 1.0 | 850 | $1,550 | $1.82 | 18d | 1 | 1.32mi |
| 1933 Hickory Rd Homewood, IL | 1.0 | 1.0 | 850 | $1,550 | $1.82 | 20d | 1 | 1.32mi |
| 44 N Glenwood Ave Glenwood, IL | 1.0 | 1.0 | 700 | $1,900 | $2.71 | 1d | 1 | 1.36mi |
HOA detail condo
- Monthly dues
- $438 · $5,256/yr
- Assessments
- None detected in remarks — confirm with the listing agent.
Listing history 17 events
-
2026-06-18days on market $134,900 Active 63 DOM
-
2026-06-17days on market $134,900 Active 62 DOM
-
2026-06-16days on market $134,900 Active 61 DOM
-
2026-06-15days on market $134,900 Active 60 DOM
-
2026-06-13days on market $134,900 Active 58 DOM
-
2026-06-09days on market $134,900 Active 54 DOM
-
2026-06-08days on market $134,900 Active 53 DOM
-
2026-06-07days on market $134,900 Active 52 DOM
-
2026-06-04days on market $134,900 Active 49 DOM
-
2026-06-03days on market $134,900 Active 48 DOM
-
2026-06-02days on market $134,900 Active 47 DOM
-
2026-06-01days on market $134,900 Active 46 DOM
-
2026-05-31days on market $134,900 Active 45 DOM
-
2026-04-16$134,900 Active
-
2001-09-25soldstatus $59,000
-
1998-10-20soldstatus $71,000
-
1989-06-09soldstatus $52,000
ⓘ Source: listings_history table (triggers on properties + properties_extension) + one-shot
backfill from property_details.listing_events for pre-trigger history.
Tax reassessment forecast IL · Partial reset (capped growth)
- Current annual tax
- $2,027 · $169/mo
- Projected year-2 tax
- $2,544 · $212/mo
- Expected delta
- +$518/yr (+$43/mo · 25.5%)
ⓘ Screening estimate from a state-policy table — verify with the county assessor before closing.
Climate risk First Street
- Flood 1/10 Low FEMA zone X (unshaded) · 0% chance over 30 yrs
- Wildfire 1/10 Low
- Heat 3/10 Moderate 7 d/yr ≥101°F today · 15 d/yr by 30 yrs out
- Wind 2/10 Low
- Air quality 4/10 Moderate 4 unhealthy d/yr today · 5 by 30 yrs out
Nearby sold comps map
Loading sold comps map…
Walkable amenities ~0.75 mi
Loading nearby amenities…
Taxation est. · year 1
- Rental income
- $19,802
- − Mortgage interest
- −$7,556
- − Property taxes
- −$2,027
- − Insurance
- −$674
- − Repairs & maintenance
- −$1,584
- − Management
- −$1,584
- − HOA
- −$5,256
- − Depreciation
- −$3,924
- Taxable loss
- −$2,805
- Est. tax savings @ 24.0%
- +$673
- After-tax cash flow
- $-130/yr
For passive investors: Depreciation is non-cash, so a rental often shows a tax loss while cash-flowing — sheltering income. Rental losses are passive: they offset passive income freely, and up to $25,000/yr can offset ordinary (W-2) income if you actively participate and your MAGI is under $100k (phasing out to $0 by $150k); unused losses carry forward. On sale, claimed depreciation is recaptured at up to 25%, and gains may owe capital-gains tax (a 1031 exchange can defer both). Figures are a year-1 estimate at your 24.0% rate — not tax advice; consult a CPA.
Schools (NCES district)
- District
- Homewood Flossmoor Chsd 233
- NCES district ID
- 1719560
- Math proficiency
- 21% ▼ -15.00%
- Reading proficiency
- 27% ▼ -13.00%
- Median HH income
- $83,564
- Composite
- 24.42/100
- National rank
- #7681
- State rank
- #272 of 620 in IL
Livability — Homewood
- Score
- 81/100
- State rank
- #81
- US rank
- #1314
Category grades
Schools grade is shown separately in the Schools card above.
Census & demographics
- Census place
- Homewood, IL
- City population
- 19,993
- Population (ZIP)
- 19,993
Population outlook (Cook County) Hauer SSP2
- Today (2025)
- 5,347,519 people
- By 2030
- 5,357,703 · +0.2%
- By 2040
- 5,324,924 · -0.4%
- By 2050
- 5,230,762 · -2.2%
- By 2075
- 4,785,735 · -10.5%
- By 2100
- 4,188,836 · -21.7%
Race, ethnicity, and origin ACS 2023
- Neighborhood character
- Diverse neighborhood (Simpson 0.62)
- Race & ethnicity
- Black 44% White 42% Hispanic / Latino 9% Two or more races 6% Asian 1%
- Hispanic origin (detail)
- Mexican 7%
- Common ancestry
- Romanian 5% Iranian 2% Italian 2%
- Foreign-born
- 6% · Canada, Dominican Republic
- Languages at home
- 91% English-only · Spanish 5% Russian/Polish/Slavic 1% German/W. Germanic 1%
Political lean MEDSL · Cook
- 2024 margin
- Solid D (+42.0) · D 70.4% · R 28.4% · Other 1.2%
- 2008→2024 swing
- -11.4pp toward R · 2008: 53.4pp · 2024: 42.0pp
- All cycles
- 2024: D+42.0 2020: D+50.3 2016: D+53.0 2012: D+49.4 2008: D+53.4
Not yet ingested
- Civics
- —
Market trends
- HPI YoY
- ▼ -105.00%
- Current HPI
- 222.2923
- Rent YoY
- —
- Metro
- —
- State GDP YoY
- ▲ 1.59%
- F500 in state
- 60
Industry mix (Fortune 500 HQ in IL)
| Industry | F500 HQs | Revenue |
|---|---|---|
| Insurance | 4 | $201B |
|
||
| Consumer Goods | 4 | $87B |
|
||
| Industrial Machinery | 3 | $64B |
|
||
| Healthcare | 2 | $55B |
|
||
| Retail / Pharmacy | 1 | $148B |
|
||
| Agriculture / Food | 1 | $86B |
|
||
Price history
+159.4% since first listed4 events — show timeline
- 2026-04-16 Listed $134,900 MRED as Distributed by MLS Grid
- 2001-09-25 Sold (Public Records) $59,000 Public Records
- 1998-10-20 Sold (Public Records) $71,000 Public Records
- 1989-06-09 Sold (Public Records) $52,000 Public Records
Property tax history
+1.7%/yrLatest (2023): $2,027 · +287.2% YoY. Source: county tax records.
Cash-flow waterfall
monthlySold comps — $/sqft
last 12 mo · ≤1 miLoading sold comps…