 Multi-family
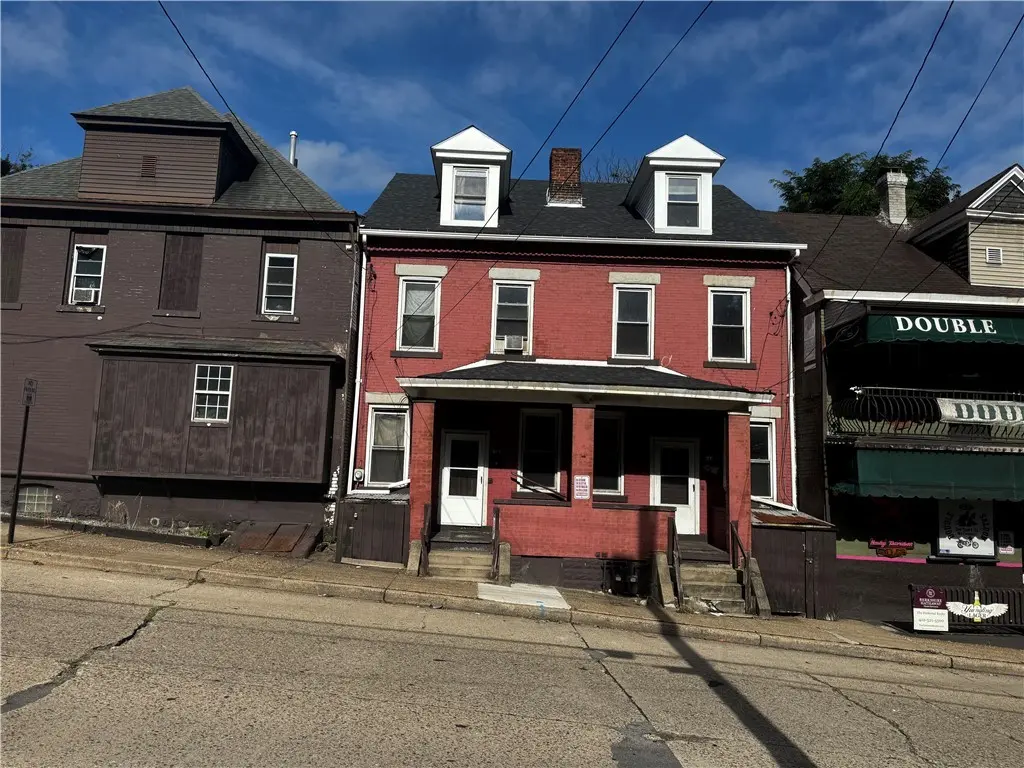
614 Evans Ave · McKeesport, PA
Flood risk 7/10 · Major
- FEMA flood zone
- X (unshaded)
- Chance of flooding over 30 yrs
- 0.78%
- Est. flood insurance / yr
- $473 – $860
Fire risk 1/10 · Minimal
- Est. fire insurance / yr
- $511 – $949
Heat risk 4/10 · Minor
- Hot days now (above 97°F)
- 7 days/yr
- Hot days in 30 yrs
- 18 days/yr
Wind risk 2/10 · Minimal
- Chance of severe wind over 30 yrs
- —
Air-quality risk 5/10 · Moderate
- Unhealthy air days now
- 9 days/yr
- Unhealthy air days in 30 yrs
- 11 days/yr
Risk factors via First Street. Map © Google.
Why this score? — see what drove the D grade
The composite is a weighted blend of 9 inputs, each scored 0–100. Each bar is that input's sub-score; the figure is the points it added to the 100-point composite (weight × sub-score).
- Cash flow +15.0/30.0
- ARV discount +7.5/15.0
- 1% rule +5.0/10.0
- DSCR +5.0/10.0
- Livability +3.3/5.0
- Rent growth +2.5/5.0
- Schools +1.6/10.0
- Condition / age +1.0/5.0
- Appreciation +0.0/10.0
$52,500
🖨 Deal sheet 📄 Offer letter ✓ Due diligence
Multi-family units
County records classify this as Multi-Family (2-4 Unit). Listing-text estimate: 1 unit. estimate disagrees with records
Listing remarks MLS
Wonderful opportunity to start your investing business or add to your portfolio. With a little TLC this property can be up and running quickly. Located with in walking distance to UPMC McKeesport and several other large employers.
Key facts
- 8,916 sq ft lot
- Built 1905
- Listed 298 days
Neighborhood map
What this means for you Summary
Snapshot
- This is a 6-bed/2.0-bath multifamily listed at $52k. Condition is rated poor.
Deal economics
- At list price, monthly cash flow is $1k ($16k/yr) — positive.
- The deal already cash-flows at list — no discount required.
- Meets the 1% rule at list price ($2k rent vs $52k).
- Recommended offer: $46k (12.0% below list) — sets the bar for market timing.
- Cap rate 37.6% vs local median 10.3% in McKeesport — top-decile yield for the area; either an underpriced asset or a hidden risk that comps aren't pricing in. Stress-test before assuming the spread holds.
Location & tenants
- Location reads 66/100 on livability (#1,089 in PA) — a middle-class / working-renter tenant base. Strengths: commute A+, cost of living A+, housing A+; Watch: schools D+, health & safety D, crime F.
- Mckeesport Area SD (suburban): math 11% / reading 28% proficiency, ranked #499 of 539 in PA (top 93%) — low school quality limits family demand, transient renter base, plan for 1-2y turnover; 66% free/reduced lunch — lower-income household profile, screen leases tightly.
- Market conditions: 113 active listings in the ZIP; lower-income renter base — watch delinquency; 2,996 units permitted in Allegheny County in 2024 (1,588 in 5+ unit buildings).
- At $2,194/mo this rent would consume 74% of the median local household income ($35k/yr) (locally 1239% of renters already pay >50% of income on rent) — very limited rent-growth headroom before tenants either downsize or default.
Forward outlook
- Local home prices are declining (-3.0%/yr); year-one equity from $363 of loan paydown is wiped out by about $2k of value loss. Plan a longer hold.
- At projected returns (-3.0% appreciation + 3.0% rent growth), your $15k cash investment doubles in ~2 years — after that, you're playing with house money.
Negotiation context
- It's been on market 299 days — a 12% lower offer ($46k) is reasonable based on typical stale-listing flexibility.
- 2 sale attempts; this cycle's ask has dropped $7k (12%) from the opening price — seller is motivated, your offer sets the floor, not the list.
Risks & watch-outs
- Watch-outs: flood insurance adds $56/mo; built in 1905 — expect roof / HVAC / electrical / plumbing capex.
- Climate carrying-cost: major flood risk — expect insurance premiums to compound above CPI over the hold.
Questions for the listing agent
- It's been on market 299 days. Have you received any prior offers? Is the seller open to a 12% concession, seller financing, or rate buy-down credit?
- Have any recent inspections been done? Can we get a copy of the seller's disclosures and any deferred-maintenance estimates?
- Built in 1905 — when were the roof, HVAC, electrical panel, plumbing, and water heater last replaced?
- What's the actual annual flood-insurance premium (NFIP or private), and is the property in a SFHA with mandatory coverage?
- Why hasn't it sold? Are there any deal-killer items the seller is aware of (foundation, flood, title, zoning, code violations)?
- Is there a deadline driving the sale (1031 exchange, divorce, estate, relocation)? That informs how much negotiation room exists.
- Schools are D-rated, which usually means shorter tenancies and higher turnover. Who's the typical renter profile here, and what's been the actual vacancy rate?
- Crime grade is F in this area — have there been break-ins, vandalism, or insurance claims at this property in the last 3 years? What carrier currently insures it and at what premium?
- The area grade is low — what's the realistic commute time and amenity access for the typical tenant pool here? Any planned neighborhood developments (good or bad) we should know about?
- What's the average days-on-market for RENTAL listings here right now (not sales)? A rising rental-DOM trend means longer vacancies and softer asking-rent achievability than the comps imply.
- What's the recent tenant-quality profile in this submarket — average credit score on applications, eviction rate, late-payment / NSF rate, and stable-employment percentage? A property-management company in the area should have these aggregated.
- How much new apartment / multifamily construction is in the pipeline within 1–3 miles? Heavy new supply (>2% of stock underway) typically softens rents 12–24 months out; light construction supports rent growth.
Investment metrics
- 1% rule
- 4.18% ✓
- Cap rate
- 37.62%
- Cash-on-cash
- 111.87%
- DSCR
- 5.98
- GRM
- 2.0
CMA / ARV
No comps found within radius.
Show comp detail 4 sales within ~0.75 mi
| Address | Dist | Beds/Ba | Sqft | Sold | Price | $/sf | Match |
|---|---|---|---|---|---|---|---|
| 1233-1235 Park St | 0.36mi | 5/3.0 (-1) | — | 6mo | $142,500 | — | 57 |
| 1608 Union Ave | 0.52mi | 6/4.0 | — | 11mo | $136,500 | — | 46 |
| 2902 Garbett St | 0.63mi | 6/5.5 | — | 1mo | $45,000 | — | 44 |
| 1834 Flagler | 0.70mi | 5/3.0 (-1) | — | 14mo | $118,000 | — | 34 |
Match score weights: distance 35% · size 25% · config 20% · recency 20%. Top-matched comps best support the ARV.
Projected returns pro-forma
-3.0% appreciation · 3.0% rent growth · sell at horizon
- IRR
- —
- Equity multiple
- 6.12×
- Total profit
- $75,307
- Equity at exit
- $7,828
- IRR
- —
- Equity multiple
- 12.82×
- Total profit
- $173,686
- Equity at exit
- $4,539
Cash invested: $14,700 (down + closing). Projections, not guarantees.
Landlord ↔ Tenant lean methodology
- Overall (STATE)
- 62 Landlord-Friendly
- State Pennsylvania
- 62 Landlord-Friendly · EVEN
- County
- — inherits STATE
- City
- — inherits STATE
ZIP-level market 15132
- Home prices YoY
- -32.9%
- Active inventory
- 113
- Price-to-rent
- 4.0×
Monthly cashflow live
- Estimated rent
- $2,194 high interval (Pro) →
- Mortgage (P&I)
- −$275
- Tax est. 1.5%
- −$66 /mo · $788/yr
- Insurance
- −$22
- Flood insurance flood zone
- −$56 /mo · $666/yr
- HOA
- −$0
- Vacancy / Maint / Mgmt
- −$461
- Net cashflow
- $1,315
Break-even live
2-unit breakdown (identical units grouped — click to expand)
| Units | Beds | Baths | Est. rent |
|---|---|---|---|
| 2× units | 2 | 1 | $2,194 |
| #1 | 2 | 1 | $1,097 |
| #2 | 2 | 1 | $1,097 |
| Total (2 units) | $2,194 | ||
UW: 25.0% down · 7.5% · 30yr · 1.5% tax · 5.0% vac · 8.0% maint · 8.0% mgmt
Financing live
Cash to close
- Down payment
- $13,125
- Closing costs
- $1,575
- Reserves months
- —
- Total cash needed
- —
Loan-product check · same deal, 3 products live
Conventional
25% down · 7.5% · 30yr
- Down + closing
- —
- Monthly P&I
- —
- Monthly cashflow
- —
- DSCR
- —
- Eligible?
- —
Personal DTI + credit; lowest rate.
DSCR
20% down · 8.5% · 30yr
- Down + closing
- —
- Monthly P&I
- —
- Monthly cashflow
- —
- DSCR
- —
- Eligible?
- —
No personal income docs; deal must DSCR.
Hard money
10% down · 12.0% · 12mo
- Down + closing
- —
- Monthly P&I
- —
- Monthly cashflow
- —
- DSCR
- —
- Eligible?
- —
Short-term bridge; refi at stabilization.
Listing history 14 events
-
2026-06-15days on market $52,500 Active 299 DOM
-
2026-06-13days on market $52,500 Active 297 DOM
-
2026-06-13days on market $52,500 Active 296 DOM
-
2026-06-09days on market $52,500 Active 293 DOM
-
2026-06-08days on market $52,500 Active 292 DOM
-
2026-06-07days on market $52,500 Active 291 DOM
-
2026-06-03days on market $52,500 Active 287 DOM
-
2026-06-02days on market $52,500 Active 286 DOM
-
2026-06-01days on market $52,500 Active 285 DOM
-
2026-05-31days on market $52,500 Active 284 DOM
-
2025-12-11price $52,500 230-char remark
Show marketing remark (230 chars)
Wonderful opportunity to start your investing business or add to your portfolio. With a little TLC this property can be up and running quickly. Located with in walking distance to UPMC McKeesport and several other large employers.
-
2025-11-26status Active 230-char remark
Show marketing remark (230 chars)
Wonderful opportunity to start your investing business or add to your portfolio. With a little TLC this property can be up and running quickly. Located with in walking distance to UPMC McKeesport and several other large employers.
-
2025-11-14historical Contingent 230-char remark
Show marketing remark (230 chars)
Wonderful opportunity to start your investing business or add to your portfolio. With a little TLC this property can be up and running quickly. Located with in walking distance to UPMC McKeesport and several other large employers.
-
2025-08-19$59,900 Active 230-char remark
Show marketing remark (230 chars)
Wonderful opportunity to start your investing business or add to your portfolio. With a little TLC this property can be up and running quickly. Located with in walking distance to UPMC McKeesport and several other large employers.
ⓘ Source: listings_history table (triggers on properties + properties_extension) + one-shot
backfill from property_details.listing_events for pre-trigger history.
Climate risk First Street
- Flood 7/10 Severe FEMA zone X (unshaded) · 78% chance over 30 yrs
- Wildfire 1/10 Low
- Heat 4/10 Moderate 7 d/yr ≥97°F today · 18 d/yr by 30 yrs out
- Wind 2/10 Low
- Air quality 5/10 Major 9 unhealthy d/yr today · 11 by 30 yrs out
Nearby sold comps map
Loading sold comps map…
Walkable amenities ~0.75 mi
Loading nearby amenities…
Taxation est. · year 1
- Rental income
- $26,328
- − Mortgage interest
- −$2,941
- − Property taxes
- −$788
- − Insurance
- −$929
- − Repairs & maintenance
- −$2,106
- − Management
- −$2,106
- − Depreciation
- −$1,527
- Taxable income
- $15,931
- Est. tax owed @ 24.0%
- −$3,823
- After-tax cash flow
- $11,955/yr
For passive investors: Depreciation is non-cash, so a rental often shows a tax loss while cash-flowing — sheltering income. Rental losses are passive: they offset passive income freely, and up to $25,000/yr can offset ordinary (W-2) income if you actively participate and your MAGI is under $100k (phasing out to $0 by $150k); unused losses carry forward. On sale, claimed depreciation is recaptured at up to 25%, and gains may owe capital-gains tax (a 1031 exchange can defer both). Figures are a year-1 estimate at your 24.0% rate — not tax advice; consult a CPA.
Condition & rehab AI · 13 photos
This multi-family property requires extensive renovations, including structural repairs, painting, and updating the interior and exterior. The investment opportunity lies in the potential for significant value increase through thorough renovations.
Repairs flagged
- Major Exposed insulation — Structural damage
- Major Missing cabinets — Aesthetic and functional
- Major Dirty floor — Health and safety hazard
Value-add opportunities
- Both Painting — Enhances curb appeal and interior aesthetics
- Both Siding repair — Improves structural integrity and appearance
- Both Cabinets — Restores functionality and aesthetics
- Both Flooring — Improves hygiene and comfort
Renovation cost estimate screening
| Repair item | Severity | Est. cost |
|---|---|---|
| Exposed insulation · Structural damage | Major | $15,000–50,000 |
| Missing cabinets · Aesthetic and functional | Major | $15,000–50,000 |
| Dirty floor · Health and safety hazard | Major | $15,000–50,000 |
| Total estimated repair cost · 3 items | $45,000–150,000 |
Value-add ROI direction
- Both Painting — Enhances curb appeal and interior aesthetics ↑
- Both Siding repair — Improves structural integrity and appearance ↑
- Both Cabinets — Restores functionality and aesthetics ↑
- Both Flooring — Improves hygiene and comfort ↑
ⓘ Cost ranges are severity-bucket heuristics (US national rule-of-thumb). Get contractor quotes + a written scope before underwriting a rehab budget.
Schools (NCES district)
- District
- Mckeesport Area SD
- NCES district ID
- 4214940
- Math proficiency
- 11% ▼ -9.00%
- Reading proficiency
- 28% ▼ -10.00%
- Median HH income
- $33,779
- Composite
- 15.88/100
- National rank
- #9257
- State rank
- #499 of 539 in PA
Livability — McKeesport
- Score
- 66/100
- State rank
- #1089
- US rank
- #12321
Category grades
Schools grade is shown separately in the Schools card above.
Census & demographics
- Census place
- McKeesport, PA
- County
- Allegheny County · 1,022,028 people
- City population
- 25,010
- Metro
- Pittsburgh, PA
- Population (ZIP)
- 18,898
- Household income
- $35,397
- Rent vs Own
- Severe rent burden
- 1239.0
Population outlook (Allegheny County) Hauer SSP2
- Today (2025)
- 1,250,282 people
- By 2030
- 1,256,482 · +0.5%
- By 2040
- 1,256,318 · +0.5%
- By 2050
- 1,244,169 · -0.5%
- By 2075
- 1,197,693 · -4.2%
- By 2100
- 1,093,187 · -12.6%
Race, ethnicity, and origin ACS 2023
- Neighborhood character
- Diverse neighborhood (Simpson 0.62)
- Race & ethnicity
- White 50% Black 35% Two or more races 10% Hispanic / Latino 4% Asian 1%
- Common ancestry
- Romanian 5% Serbian 2% Scotch-Irish 2%
- Foreign-born
- 2% · Canada, China
- Languages at home
- 96% English-only · Spanish 3%
Political lean MEDSL · Allegheny
- 2024 margin
- Strong D (+20.3) · D 59.7% · R 39.4%
- 2008→2024 swing
- +4.8pp toward D · 2008: 15.5pp · 2024: 20.3pp
- All cycles
- 2024: D+20.3 2020: D+20.4 2016: D+16.4 2012: D+14.4 2008: D+15.5
Not yet ingested
- Civics
- —
Market trends
- HPI YoY
- ▼ -71.01%
- Current HPI
- 145.195
- Rent YoY
- —
- Metro
- Pittsburgh, PA
- State GDP YoY
- ▲ 1.68%
- F500 in state
- 34
Industry mix (Fortune 500 HQ in PA)
| Industry | F500 HQs | Revenue |
|---|---|---|
| Healthcare | 2 | $309B |
|
||
| Insurance | 2 | $27B |
|
||
| Telecommunications / Media | 1 | $124B |
|
||
| Industrial Distribution | 1 | $22B |
|
||
| Financial Services | 1 | $20B |
|
||
| Chemicals / Materials | 1 | $18B |
|
||
Price history
-12.4% since first listed4 events — show timeline
- 2025-12-11 Price Changed $52,500 West Penn MLS
- 2025-11-26 Relisted — West Penn MLS
- 2025-11-14 Contingent — West Penn MLS
- 2025-08-19 Listed $59,900 West Penn MLS
Cash-flow waterfall
monthlySold comps — $/sqft
last 12 mo · ≤1 miLoading sold comps…