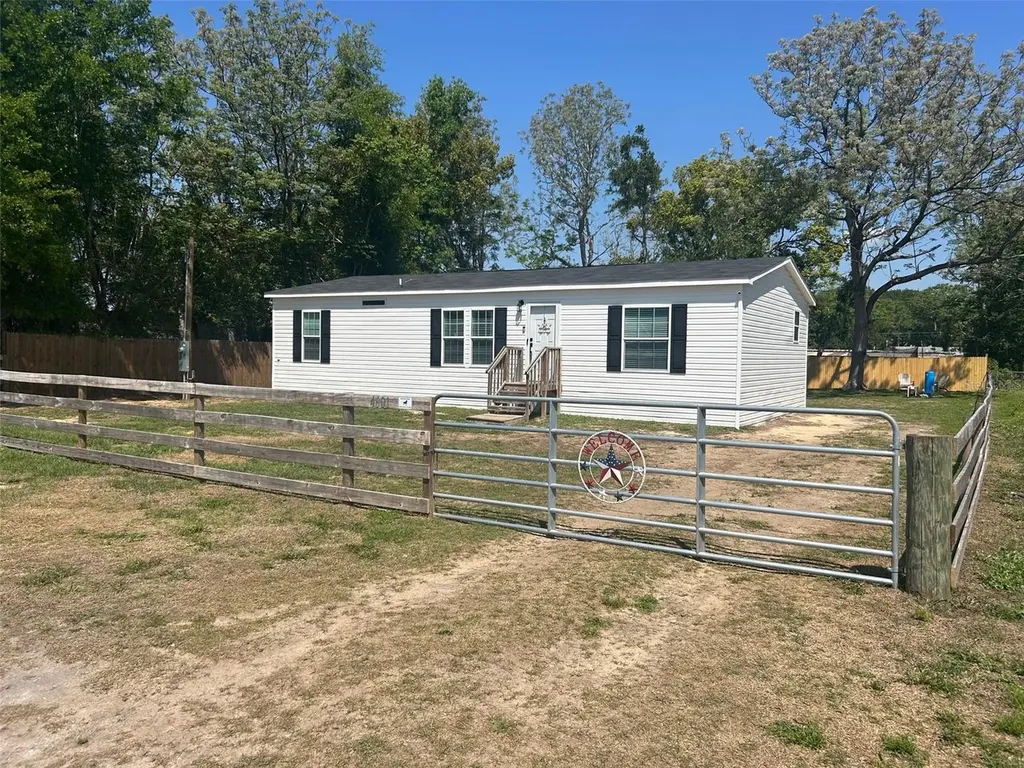
4601 Oak St · Fruitland Park, FL
Flood risk 4/10 · Minor
- FEMA flood zone
- X (unshaded)
- Chance of flooding over 30 yrs
- 0.22%
- Est. flood insurance / yr
- $507 – $1,088
Fire risk 3/10 · Minor
- Est. fire insurance / yr
- $947 – $1,759
Heat risk 8/10 · Major
- Hot days now (above 107°F)
- 7 days/yr
- Hot days in 30 yrs
- 21 days/yr
Wind risk 9/10 · Severe
- Chance of severe wind over 30 yrs
- 99.0%
Air-quality risk 3/10 · Minor
- Unhealthy air days now
- 2 days/yr
- Unhealthy air days in 30 yrs
- 4 days/yr
Risk factors via First Street. Map © Google.
Why this score? — see what drove the D grade
The composite is a weighted blend of 9 inputs, each scored 0–100. Each bar is that input's sub-score; the figure is the points it added to the 100-point composite (weight × sub-score).
- Cash flow +13.3/30.0
- ARV discount +7.5/15.0
- Schools +4.2/10.0
- DSCR +4.0/10.0
- Livability +3.5/5.0
- 1% rule +2.6/10.0
- Rent growth +2.5/5.0
- Condition / age +2.5/5.0
- Appreciation +0.0/10.0
$249,900
🖨 Deal sheet (PDF) 📄 Offer letter ✓ Due diligence
Listing remarks
This is the one you’ve been waiting for! Brand new 2025 manufactured home with NO HOA, offering modern features and functional living throughout. The open floor plan showcases luxury vinyl flooring, high ceilings, and crown molding for a clean, elevated feel. The spacious kitchen features an island with bar seating, abundant cabinetry, a stainless farmhouse sink with drying rack and cutting board, and stainless steel appliances with a glass cooktop, all opening seamlessly to the living and dining areas. The dining area includes sliding doors leading to the backyard, while the living room provides plenty of space for everyday living and entertaining. The primary suite is generously siz
Key facts
- Open floor plan
- Spacious kitchen
- Sliding doors
Tags
Property features AI
Finance
- Other: Property type: Residential; Property subtype: Manufactured Home; Zoning: RM; Lot is paved and in county on a public maintained asphalt road; Lot vegetation includes oak trees; Lot size approximately 0.23 acres; Living area reported as 1,248 sq ft; Building area reported as 1,248 sq ft
- HOA & community: No association; Pets allowed
Exterior
- Parking: Carport with 3 spaces
- Utilities: Well water; Septic tank; High-speed internet available; Cable available; Electricity connected; Phone available
- Home design: Manufactured home (double wide); One story; South-facing
- Construction: Vinyl siding; Frame construction; Shingle roof; Crawlspace foundation; Manufactured by Scotbilt
- Exterior features: Sliding doors; Storage; Barn(s); Workshop; Additional storage structures; Pole barn
Interior
- Kitchen: Dishwasher; Range; Refrigerator; Electric water heater
- Bedrooms: 3 bedrooms
- Bathrooms: 2 full bathrooms
- Heating & cooling: Central heating (electric); Central air conditioning
- Interior features: Ceiling fans; Crown molding; Eat-in kitchen; Open floorplan; Split bedroom layout; Walk-in closet(s); Window treatments; Double pane windows; Inside utility room
- Laundry & utility: Inside laundry room
Neighborhood map
What this means for you Summary
Snapshot
- This is a 3-bed/2.0-bath manufactured listed at $250k.
Deal economics
- At list price, monthly cash flow is $-2 ($-25/yr) — negative.
- To cash-flow at today's rent, offer at most $250k (0.1% below list).
- To meet the 1% rule (rent ≥ 1% of price), the offer needs to be $191k (23.8% below list).
- Recommended offer: $191k (23.8% below list) — sets the bar for 1% rule.
- Cap rate 6.3% vs local median 4.0% in Fruitland Park — top-decile yield for the area; either an underpriced asset or a hidden risk that comps aren't pricing in. Stress-test before assuming the spread holds.
Location & tenants
- Location reads 70/100 on livability (#447 in FL) — a middle-class / working-renter tenant base. Strengths: housing A+, crime A, health & safety A-; Watch: amenities F, commute F.
- Lake (suburban): math 49% / reading 50% proficiency, ranked #37 of 73 in FL (top 51%) — families likely to look elsewhere, expect single-tenant / working-renter base with shorter leases.
- Zoned schools: Fruitland Park Elementary School (math 46% / reading 41%, grade F, #1,345 of 2,144 statewide, top 64%, 733 students, 66% FRL); Carver Middle School (math 41% / reading 41%, grade F, #353 of 571 statewide, top 63%, 837 students, 65% FRL); Leesburg High School (math 24% / reading 32%, grade F, #464 of 667 statewide, top 70%, 1,641 students, 58% FRL).
- Zoned-school proficiency averages 38% at this address vs 50% district-wide (-12 pts) — the specific schools serving this property underperform the Lake average; the district grade overstates school quality for this exact location.
- Market conditions: 168 active listings in the ZIP; 1 comparable units currently listed for rent nearby; 4,799 units permitted in Lake County in 2024 (814 in 5+ unit buildings).
- This rent runs 34% of the median local income ($66k/yr) — at the standard rent-burdened threshold; future hikes will face affordability resistance.
Forward outlook
- Local home prices are declining (-3.0%/yr); year-one equity from $2k of loan paydown is wiped out by about $7k of value loss. Plan a longer hold.
- Lake County population projected at +37% by 2050 — long-run rental-demand tailwind backs the buy-and-hold thesis.
Negotiation context
- It's been on market 83 days — a 6% lower offer ($235k) is reasonable based on typical stale-listing flexibility.
- Current owner paid $20k; list at $250k implies a 1156% gain — meaningful room to come down on a strong offer.
Risks & watch-outs
- Climate carrying-cost: severe wind risk, 99% chance of damaging wind over 30y; extreme-heat days projected 7→21/yr by 2055 (HVAC capex compounding) — expect insurance premiums to compound above CPI over the hold.
Questions for the listing agent
- What do current leases actually rent for vs. the listed asking? Can we see a recent rent roll and the last 12 months of T-12 income?
- It's been on market 83 days. Have you received any prior offers? Is the seller open to a 24% concession, seller financing, or rate buy-down credit?
- Why hasn't it sold? Are there any deal-killer items the seller is aware of (foundation, flood, title, zoning, code violations)?
- Is there a deadline driving the sale (1031 exchange, divorce, estate, relocation)? That informs how much negotiation room exists.
- Schools are D-rated, which usually means shorter tenancies and higher turnover. Who's the typical renter profile here, and what's been the actual vacancy rate?
- The area grade is low — what's the realistic commute time and amenity access for the typical tenant pool here? Any planned neighborhood developments (good or bad) we should know about?
- What's the average days-on-market for RENTAL listings here right now (not sales)? A rising rental-DOM trend means longer vacancies and softer asking-rent achievability than the comps imply.
- What's the recent tenant-quality profile in this submarket — average credit score on applications, eviction rate, late-payment / NSF rate, and stable-employment percentage? A property-management company in the area should have these aggregated.
- How much new for-sale + rental construction is in the pipeline within 1–3 miles? Heavy new supply typically softens prices + rents 12–24 months out; constrained supply supports both.
Investment metrics
- 1% rule
- 0.76% ✗
- Cap rate
- 6.28%
- Cash-on-cash
- -0.04%
- DSCR
- 1.00
- GRM
- 10.9
CMA / ARV
- ARV (on-the-fly)
- $72,384
- Comps found
- 1
Show comp detail 1 sale within ~0.75 mi
| Address | Dist | Beds/Ba | Sqft | Sold | Price | $/sf | Match |
|---|---|---|---|---|---|---|---|
| 36725 Daisy Ln | 0.23mi | 2/1.0 (-1) | 1,088 (-13%) | 4mo | $63,000 | $58 | 55 |
Match score weights: distance 35% · size 25% · config 20% · recency 20%. Top-matched comps best support the ARV.
Projected returns pro-forma
-3.0% appreciation · 3.0% rent growth · sell at horizon
- IRR
- -16.4%
- Equity multiple
- 0.42×
- Total profit
- $-40,733
- Equity at exit
- $37,261
- IRR
- -8.2%
- Equity multiple
- 0.48×
- Total profit
- $-36,071
- Equity at exit
- $21,607
Cash invested: $69,972 (down + closing). Projections, not guarantees.
Landlord ↔ Tenant lean methodology
- Overall (STATE)
- 87 Strongly Landlord-Friendly
- State Florida
- 87 Strongly Landlord-Friendly · R+3
- County
- — inherits STATE
- City
- — inherits STATE
ZIP-level market 34731
- Home prices YoY
- -10.1%
- Active inventory
- 168
- Price-to-rent
- 10.9×
Monthly cashflow live
- Estimated rent
- $1,905 medium interval (Pro) →
- Mortgage (P&I)
- −$1,311
- Tax from tax record
- −$92 /mo · $1,109/yr
- Insurance
- −$104
- HOA
- −$0
- Vacancy / Maint / Mgmt
- −$400
- Net cashflow
- $-2
Break-even live
Sensitivity live
| Price | -10% $139 | -5% $69 | +0% $-2 | +5% $-73 | +10% $-144 |
|---|---|---|---|---|---|
| Rent | -10% $-153 | -5% $-77 | +0% $-2 | +5% $73 | +10% $148 |
| Rate | -1.0pp $124 | -0.5pp $61 | base $-2 | +0.5pp $-67 | +1.0pp $-133 |
UW: 25.0% down · 7.5% · 30yr · 1.5% tax · 5.0% vac · 8.0% maint · 8.0% mgmt
Financing live
Cash to close
- Down payment
- $62,475
- Closing costs
- $7,497
- Reserves months
- —
- Total cash needed
- —
Loan-product check · same deal, 3 products live
Conventional
25% down · 7.5% · 30yr
- Down + closing
- —
- Monthly P&I
- —
- Monthly cashflow
- —
- DSCR
- —
- Eligible?
- —
Personal DTI + credit; lowest rate.
DSCR
20% down · 8.5% · 30yr
- Down + closing
- —
- Monthly P&I
- —
- Monthly cashflow
- —
- DSCR
- —
- Eligible?
- —
No personal income docs; deal must DSCR.
Hard money
10% down · 12.0% · 12mo
- Down + closing
- —
- Monthly P&I
- —
- Monthly cashflow
- —
- DSCR
- —
- Eligible?
- —
Short-term bridge; refi at stabilization.
Rent comps 1 comps
| Address | Beds | Baths | Sqft | Rent | $/sqft | DOM | Units | Dist |
|---|---|---|---|---|---|---|---|---|
| 36832 Wilmington Rd Fruitland Park, FL | 3.0 | 3.0 | 1452 | $1,800 | $1.24 | 5d | 1 | 0.21mi |
Listing history 18 events
-
2026-06-21days on market $249,900 Active 83 DOM
-
2026-06-18days on market $249,900 Active 80 DOM
-
2026-06-17days on market $249,900 Active 79 DOM
-
2026-06-16days on market $249,900 Active 78 DOM
-
2026-06-15days on market $249,900 Active 77 DOM
-
2026-06-13days on market $249,900 Active 75 DOM
-
2026-06-09days on market $249,900 Active 71 DOM
-
2026-06-08days on market $249,900 Active 70 DOM
-
2026-06-07days on market $249,900 Active 69 DOM
-
2026-06-04days on market $249,900 Active 66 DOM
-
2026-06-03days on market $249,900 Active 65 DOM
-
2026-06-02days on market $249,900 Active 64 DOM
-
2026-06-01days on market $249,900 Active 63 DOM
-
2026-05-31days on market $249,900 Active 62 DOM
-
2026-03-30$249,900 Active
-
1989-02-01soldstatus $19,900
-
1988-10-01soldstatus $19,400
-
1987-08-01soldstatus $21,900
ⓘ Source: listings_history table (triggers on properties + properties_extension) + one-shot
backfill from property_details.listing_events for pre-trigger history.
Tax reassessment forecast FL · Resets to sale price
- Current annual tax
- $1,109 · $92/mo
- Projected year-2 tax
- $2,074 · $173/mo
- Expected delta
- +$965/yr (+$80/mo · 87.0%)
ⓘ Screening estimate from a state-policy table — verify with the county assessor before closing.
Climate risk First Street
- Flood 4/10 Moderate FEMA zone X (unshaded) · 22% chance over 30 yrs
- Wildfire 3/10 Moderate
- Heat 8/10 Severe 7 d/yr ≥107°F today · 21 d/yr by 30 yrs out
- Wind 9/10 Extreme 99% chance of damaging wind over 30 yrs
- Air quality 3/10 Moderate 2 unhealthy d/yr today · 4 by 30 yrs out
Nearby sold comps map
Loading sold comps map…
Walkable amenities ~0.75 mi
Loading nearby amenities…
Taxation est. · year 1
- Rental income
- $22,861
- − Mortgage interest
- −$13,998
- − Property taxes
- −$1,109
- − Insurance
- −$1,250
- − Repairs & maintenance
- −$1,829
- − Management
- −$1,829
- − Depreciation
- −$7,270
- Taxable loss
- −$4,424
- Est. tax savings @ 24.0%
- +$1,062
- After-tax cash flow
- $1,037/yr
For passive investors: Depreciation is non-cash, so a rental often shows a tax loss while cash-flowing — sheltering income. Rental losses are passive: they offset passive income freely, and up to $25,000/yr can offset ordinary (W-2) income if you actively participate and your MAGI is under $100k (phasing out to $0 by $150k); unused losses carry forward. On sale, claimed depreciation is recaptured at up to 25%, and gains may owe capital-gains tax (a 1031 exchange can defer both). Figures are a year-1 estimate at your 24.0% rate — not tax advice; consult a CPA.
Schools (NCES district)
- District
- Lake
- NCES district ID
- 1201050
- Math proficiency
- 49% ▼ -7.00%
- Reading proficiency
- 50% ▼ -4.00%
- Median HH income
- $46,632
- Composite
- 42.05/100
- National rank
- #3327
- State rank
- #37 of 73 in FL
Livability — Fruitland Park
- Score
- 70/100
- State rank
- #447
- US rank
- #8098
Category grades
Schools grade is shown separately in the Schools card above.
Census & demographics
- County
- Lake County · 364,602 people
- City population
- 12,196
- Metro
- Orlando-Kissimmee-Sanford, FL
- Population (ZIP)
- 12,196
- Household income
- $66,300
- Rent vs Own
- Severe rent burden
- 269.0
Population outlook (Lake County) Hauer SSP2
- Today (2025)
- 386,640 people
- By 2030
- 417,107 · +7.9%
- By 2040
- 476,676 · +23.3%
- By 2050
- 531,296 · +37.4%
- By 2075
- 648,303 · +67.7%
- By 2100
- 698,530 · +80.7%
Race, ethnicity, and origin ACS 2023
- Neighborhood character
- Predominantly White (76%)
- Race & ethnicity
- White 76% Black 11% Two or more races 11% Hispanic / Latino 3%
- Common ancestry
- Romanian 3% Serbian 2% Iranian 2%
- Foreign-born
- 5% · Canada
- Languages at home
- 98% English-only · Spanish 1% German/W. Germanic 1%
Political lean MEDSL · Lake
- 2024 margin
- Strong R (+24.7) · D 37.3% · R 62.0%
- 2008→2024 swing
- -11.2pp toward R · 2008: -13.5pp · 2024: -24.7pp
- All cycles
- 2024: R+24.7 2020: R+20.0 2016: R+23.1 2012: R+17.1 2008: R+13.5
Not yet ingested
- Civics
- —
Market trends
- HPI YoY
- ▼ -35.91%
- Current HPI
- 318.8206
- Rent YoY
- —
- Metro
- Orlando-Kissimmee-Sanford, FL
- State GDP YoY
- ▲ 3.28%
- F500 in state
- 36
Industry mix (Fortune 500 HQ in FL)
| Industry | F500 HQs | Revenue |
|---|---|---|
| Industrial Technology | 2 | $29B |
|
||
| Insurance | 2 | $17B |
|
||
| Retail | 1 | $60B |
|
||
| Technology Distribution | 1 | $58B |
|
||
| Homebuilding | 1 | $35B |
|
||
| Technology Manufacturing | 1 | $35B |
|
||
Price history
+1041.1% since first listed4 events — show timeline
- 2026-03-30 Listed $249,900 Stellar MLS as Distributed by MLS Grid
- 1989-02-01 Sold (Public Records) $19,900 Public Records
- 1988-10-01 Sold (Public Records) $19,400 Public Records
- 1987-08-01 Sold (Public Records) $21,900 Public Records
Property tax history
+9.7%/yrLatest (2025): $1,109 · -3.9% YoY. Source: county tax records.
Cash-flow waterfall
monthlySold comps — $/sqft
last 12 mo · ≤1 miLoading sold comps…