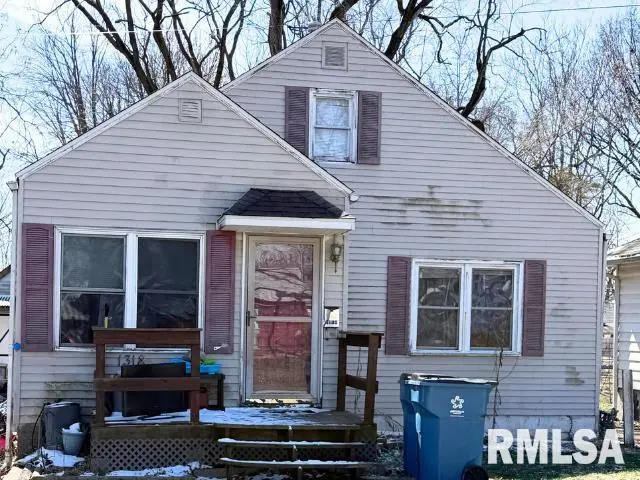
1318 E Lenox Ave · Springfield, IL
Flood risk 1/10 · Minimal
- FEMA flood zone
- X (unshaded)
- Chance of flooding over 30 yrs
- 0.0%
- Est. flood insurance / yr
- $473 – $860
Fire risk 1/10 · Minimal
- Est. fire insurance / yr
- $804 – $1,492
Heat risk 4/10 · Minor
- Hot days now (above 105°F)
- 7 days/yr
- Hot days in 30 yrs
- 20 days/yr
Wind risk 2/10 · Minimal
- Chance of severe wind over 30 yrs
- 2.0%
Air-quality risk 2/10 · Minimal
- Unhealthy air days now
- 1 days/yr
- Unhealthy air days in 30 yrs
- 1 days/yr
Risk factors via First Street. Map © Google.
Why this score? — see what drove the B+ grade
The composite is a weighted blend of 9 inputs, each scored 0–100. Each bar is that input's sub-score; the figure is the points it added to the 100-point composite (weight × sub-score).
- Cash flow +30.0/30.0
- ARV discount +15.0/15.0
- 1% rule +10.0/10.0
- DSCR +10.0/10.0
- Rent growth +5.0/5.0
- Livability +4.0/5.0
- Condition / age +2.5/5.0
- Schools +1.7/10.0
- Appreciation +0.0/10.0
$65,000
🖨 Deal sheet 📄 Offer letter ✓ Due diligence
Listing remarks MLS
Welcome to this charming 2 bed one bath property located just minutes from the heart of Springfield! Enjoy the perfect blend of comfort and convenience with easy access to the vibrant downtown area. This home is ideally situated near shopping, dining, entertainment, and everyday amenities. Spend weekends exploring local favorites, visiting the historic Illinois State Capitol, or enjoying the scenic grounds of Washington Park Botanical Garden. Inside, you'll find a welcoming space ready to make your own, while the location makes daily living effortless. Whether you're commuting, grabbing dinner downtown, or enjoying nearby parks and attractions, everything Springfield has to offer is just moments away.
Key facts
- 6,000 sq ft lot
- Built 1950
- Listed 93 days
Tags
Neighborhood map
What this means for you Summary
Snapshot
- This is a 2-bed/1.0-bath other listed at $65k.
Deal economics
- At list price, monthly cash flow is $440 ($5k/yr) — positive.
- The deal already cash-flows at list — no discount required.
- Meets the 1% rule at list price ($1k rent vs $65k).
- Recommended offer: $59k (9.0% below list) — sets the bar for market timing.
- Cap rate 14.4% vs local median 4.9% in Springfield — top-decile yield for the area; either an underpriced asset or a hidden risk that comps aren't pricing in. Stress-test before assuming the spread holds.
Location & tenants
- Location reads 79/100 on livability (#122 in IL, #2,138 nationally) — a middle-class / working-renter tenant base. Strengths: amenities A+, commute A+, cost of living A+; Watch: schools D+, crime F.
- Springfield SD 186 (urban): math 17% / reading 22% proficiency, ranked #438 of 620 in IL (top 71%) — low school quality limits family demand, transient renter base, plan for 1-2y turnover; 64% free/reduced lunch — lower-income household profile, screen leases tightly.
- Market conditions: Rents rising fast (+12.2%/yr); 107 active listings in the ZIP; 17 comparable units currently listed for rent nearby; rentals lingering (median 44d on market — plan ~5-8 weeks vacancy on turnover, expect pricing pressure); 71% of comp listings sitting > 30 days — soft ceiling on asking rent; 225 units permitted in Sangamon County in 2024 (48 in 5+ unit buildings).
- This rent runs 31% of the median local income ($45k/yr) — at the standard rent-burdened threshold; future hikes will face affordability resistance.
Forward outlook
- Local home prices are declining (-3.0%/yr); year-one equity from $449 of loan paydown is wiped out by about $2k of value loss. Plan a longer hold.
- Sangamon County population projected to shrink 9% by 2050 — rents likely to lag national; underwrite the cash flow, not the appreciation.
- At projected returns (-3.0% appreciation + 8.0% rent growth), your $18k cash investment doubles in ~4 years — after that, you're playing with house money.
Negotiation context
- It's been on market 94 days — a 9% lower offer ($59k) is reasonable based on typical stale-listing flexibility.
- 4 sale attempts since 18y ago with the ask held roughly flat each time — persistent listings suggest the price (not the market) is what's stuck; bring a comps-based counter.
Risks & watch-outs
- Watch-outs: built in 1950 — expect roof / HVAC / electrical / plumbing capex.
Questions for the listing agent
- It's been on market 94 days. Have you received any prior offers? Is the seller open to a 9% concession, seller financing, or rate buy-down credit?
- Built in 1950 — when were the roof, HVAC, electrical panel, plumbing, and water heater last replaced?
- Why hasn't it sold? Are there any deal-killer items the seller is aware of (foundation, flood, title, zoning, code violations)?
- Is there a deadline driving the sale (1031 exchange, divorce, estate, relocation)? That informs how much negotiation room exists.
- Schools are D-rated, which usually means shorter tenancies and higher turnover. Who's the typical renter profile here, and what's been the actual vacancy rate?
- Crime grade is F in this area — have there been break-ins, vandalism, or insurance claims at this property in the last 3 years? What carrier currently insures it and at what premium?
- What's the average days-on-market for RENTAL listings here right now (not sales)? A rising rental-DOM trend means longer vacancies and softer asking-rent achievability than the comps imply.
- What's the recent tenant-quality profile in this submarket — average credit score on applications, eviction rate, late-payment / NSF rate, and stable-employment percentage? A property-management company in the area should have these aggregated.
- How much new for-sale + rental construction is in the pipeline within 1–3 miles? Heavy new supply typically softens prices + rents 12–24 months out; constrained supply supports both.
Investment metrics
- 1% rule
- 1.78% ✓
- Cap rate
- 14.42%
- Cash-on-cash
- 29.03%
- DSCR
- 2.29
- GRM
- 4.7
CMA / ARV
- ARV (median comp)
- $83,782
- List price
- $65,000
- Delta
- -22.42%
- Verdict
- UNDERPRICED
- Comps
- 20 within 1.0 mi
Projected returns pro-forma
-3.0% appreciation · 8.0% rent growth · sell at horizon
- IRR
- 29.1%
- Equity multiple
- 2.30×
- Total profit
- $23,640
- Equity at exit
- $9,692
- IRR
- 39.3%
- Equity multiple
- 5.65×
- Total profit
- $84,589
- Equity at exit
- $5,620
Cash invested: $18,200 (down + closing). Projections, not guarantees.
Landlord ↔ Tenant lean methodology
- Overall (STATE)
- 43 Moderately Tenant-Leaning
- State Illinois
- 43 Moderately Tenant-Leaning · D+7
- County
- — inherits STATE
- City
- — inherits STATE
ZIP-level market 62703
- Home prices YoY
- -28.9%
- Rents YoY
- 12.2%
- Active inventory
- 107
- Price-to-rent
- 4.7×
Monthly cashflow live
- Estimated rent
- $1,155 high interval (Pro) →
- Mortgage (P&I)
- −$341
- Tax from tax record
- −$104 /mo · $1,247/yr
- Insurance
- −$27
- HOA
- −$0
- Vacancy / Maint / Mgmt
- −$242
- Net cashflow
- $440
Break-even live
UW: 25.0% down · 7.5% · 30yr · 1.5% tax · 5.0% vac · 8.0% maint · 8.0% mgmt
Financing live
Cash to close
- Down payment
- $16,250
- Closing costs
- $1,950
- Reserves months
- —
- Total cash needed
- —
Loan-product check · same deal, 3 products live
Conventional
25% down · 7.5% · 30yr
- Down + closing
- —
- Monthly P&I
- —
- Monthly cashflow
- —
- DSCR
- —
- Eligible?
- —
Personal DTI + credit; lowest rate.
DSCR
20% down · 8.5% · 30yr
- Down + closing
- —
- Monthly P&I
- —
- Monthly cashflow
- —
- DSCR
- —
- Eligible?
- —
No personal income docs; deal must DSCR.
Hard money
10% down · 12.0% · 12mo
- Down + closing
- —
- Monthly P&I
- —
- Monthly cashflow
- —
- DSCR
- —
- Eligible?
- —
Short-term bridge; refi at stabilization.
Rent comps 17 comps
| Address | Beds | Baths | Sqft | Rent | $/sqft | DOM | Units | Dist |
|---|---|---|---|---|---|---|---|---|
| 2328 S 10th St Springfield, IL | 3.0 | 1.0 | 1100 | $1,200 | $1.09 | 44d | 1 | 0.35mi |
| 2257 S 10th St Springfield, IL | 2.0 | 1.0 | 1100 | $1,150 | $1.05 | 44d | 1 | 0.42mi |
| 6 Ridge Ct Springfield, IL | 3.0 | 1.0 | 905 | $1,350 | $1.49 | 44d | 1 | 0.43mi |
| 604 Bryn Mawr Blvd Springfield, IL | 2.0 | 1.0 | 850 | $1,100 | $1.29 | 44d | 1 | 0.64mi |
| 2949 Fox Bridge Rd Springfield, IL | 2.0 | 1.0 | 900 | $960 | $1.07 | 21d | 1 | 0.74mi |
| 1908 S 4th St Springfield, IL | 1.0 | 1.0 | 800 | $850 | $1.06 | 21d | 1 | 0.94mi |
| 2005 E Laurel St Springfield, IL | 2.0 | 1.0 | 900 | $1,000 | $1.11 | 44d | 1 | 0.96mi |
| 1929 E Spruce St Springfield, IL | 3.0 | 1.0 | 1500 | $1,300 | $0.87 | 44d | 1 | 0.97mi |
| 1726 S 6th St Springfield, IL | 3.0 | 1.5 | 1408 | $1,500 | $1.07 | 44d | 1 | 0.98mi |
| 1600 S 6th St Unit 1 Springfield, IL | 3.0 | 2.0 | 1100 | $1,250 | $1.14 | 21d | 1 | 1.06mi |
| 2473 Ladley Ct Unit 2412-1 L Springfield, IL | 2.0 | 1.0 | 700 | $725 | $1.04 | 44d | 1 | 1.12mi |
| 2473 Ladley Ct Unit 2108-2 B Springfield, IL | 2.0 | 1.0 | 700 | $825 | $1.18 | 44d | 1 | 1.12mi |
| 525 E Pine St Unit 4 Springfield, IL | 2.0 | 2.0 | 1250 | $1,200 | $0.96 | 21d | 1 | 1.16mi |
| 525 E Pine St Springfield, IL | 2.0 | 2.0 | 1250 | $1,200 | $0.96 | 44d | 1 | 1.16mi |
| 1214 S 7th St Unit C Springfield, IL | 3.0 | 1.0 | 1200 | $1,350 | $1.12 | 44d | 1 | 1.26mi |
| 1104 S 11th St Unit A Springfield, IL | 3.0 | 1.0 | 1200 | $1,000 | $0.83 | 44d | 1 | 1.27mi |
| 1501 S Spring St Springfield, IL | 2.0 | 1.0 | 1000 | $1,000 | $1.00 | 21d | 1 | 1.36mi |
Listing history 28 events
-
2026-06-19days on market $65,000 Active 94 DOM
-
2026-06-18days on market $65,000 Active 93 DOM
-
2026-06-17days on market $65,000 Active 92 DOM
-
2026-06-16days on market $65,000 Active 91 DOM
-
2026-06-15days on market $65,000 Active 90 DOM
-
2026-06-14days on market $65,000 Active 88 DOM
-
2026-06-13days on market $65,000 Active 87 DOM
-
2026-06-10days on market $65,000 Active 85 DOM
-
2026-06-09days on market $65,000 Active 84 DOM
-
2026-06-08days on market $65,000 Active 83 DOM
-
2026-06-07days on market $65,000 Active 82 DOM
-
2026-06-05days on market $65,000 Active 79 DOM
-
2026-06-03days on market $65,000 Active 78 DOM
-
2026-06-02days on market $65,000 Active 77 DOM
-
2026-06-01days on market $65,000 Active 76 DOM
-
2026-05-31days on market $65,000 Active 75 DOM
-
2026-05-30days on market $65,000 Active 74 DOM
-
2026-03-17$65,000 Active 712-char remark
Show marketing remark (712 chars)
Welcome to this charming 2 bed one bath property located just minutes from the heart of Springfield! Enjoy the perfect blend of comfort and convenience with easy access to the vibrant downtown area. This home is ideally situated near shopping, dining, entertainment, and everyday amenities. Spend weekends exploring local favorites, visiting the historic Illinois State Capitol, or enjoying the scenic grounds of Washington Park Botanical Garden. Inside, you'll find a welcoming space ready to make your own, while the location makes daily living effortless. Whether you're commuting, grabbing dinner downtown, or enjoying nearby parks and attractions, everything Springfield has to offer is just moments away.
-
2025-12-17historical
-
2025-12-15historical
-
2025-09-08Active
-
2023-09-04historical
-
2023-03-02Active
-
2022-02-24soldstatus $375,950
-
2022-02-24soldstatus $375,950
-
2021-08-06historical
-
2008-07-07soldstatus $10,500
-
2008-04-29$11,500
ⓘ Source: listings_history table (triggers on properties + properties_extension) + one-shot
backfill from property_details.listing_events for pre-trigger history.
Tax reassessment forecast IL · Partial reset (capped growth)
- Current annual tax
- $1,247 · $104/mo
- Projected year-2 tax
- $1,361 · $113/mo
- Expected delta
- +$114/yr (+$10/mo · 9.2%)
ⓘ Screening estimate from a state-policy table — verify with the county assessor before closing.
Climate risk First Street
- Flood 1/10 Low FEMA zone X (unshaded) · 0% chance over 30 yrs
- Wildfire 1/10 Low
- Heat 4/10 Moderate 7 d/yr ≥105°F today · 20 d/yr by 30 yrs out
- Wind 2/10 Low 2% chance of damaging wind over 30 yrs
- Air quality 2/10 Low 1 unhealthy d/yr today · 1 by 30 yrs out
Nearby sold comps map
Loading sold comps map…
Walkable amenities ~0.75 mi
Loading nearby amenities…
Taxation est. · year 1
- Rental income
- $13,855
- − Mortgage interest
- −$3,641
- − Property taxes
- −$1,247
- − Insurance
- −$325
- − Repairs & maintenance
- −$1,108
- − Management
- −$1,108
- − Depreciation
- −$1,891
- Taxable income
- $4,534
- Est. tax owed @ 24.0%
- −$1,088
- After-tax cash flow
- $4,195/yr
For passive investors: Depreciation is non-cash, so a rental often shows a tax loss while cash-flowing — sheltering income. Rental losses are passive: they offset passive income freely, and up to $25,000/yr can offset ordinary (W-2) income if you actively participate and your MAGI is under $100k (phasing out to $0 by $150k); unused losses carry forward. On sale, claimed depreciation is recaptured at up to 25%, and gains may owe capital-gains tax (a 1031 exchange can defer both). Figures are a year-1 estimate at your 24.0% rate — not tax advice; consult a CPA.
Schools (NCES district)
- District
- Springfield SD 186
- NCES district ID
- 1737080
- Math proficiency
- 17% ▼ -7.00%
- Reading proficiency
- 22% ▼ -5.00%
- Median HH income
- $43,744
- Composite
- 16.89/100
- National rank
- #9142
- State rank
- #438 of 620 in IL
Livability — Springfield
- Score
- 79/100
- State rank
- #122
- US rank
- #2138
Category grades
Schools grade is shown separately in the Schools card above.
Census & demographics
- Census place
- Springfield, IL
- County
- Sangamon County · 115,414 people
- City population
- 59,955
- Metro
- Springfield, IL
- Population (ZIP)
- 28,922
- Household income
- $45,009
- Rent vs Own
- Severe rent burden
- 1626.0
Population outlook (Sangamon County) Hauer SSP2
- Today (2025)
- 198,317 people
- By 2030
- 196,127 · -1.1%
- By 2040
- 188,664 · -4.9%
- By 2050
- 179,624 · -9.4%
- By 2075
- 155,027 · -21.8%
- By 2100
- 122,588 · -38.2%
Race, ethnicity, and origin ACS 2023
- Neighborhood character
- Diverse neighborhood (Simpson 0.59)
- Race & ethnicity
- White 53% Black 35% Two or more races 7% Hispanic / Latino 5%
- Common ancestry
- Lithuanian 2% Romanian 2% Italian 1%
- Foreign-born
- 3% · Canada
- Languages at home
- 95% English-only · Spanish 3% Arabic 1%
Political lean MEDSL · Sangamon
- 2024 margin
- Toss-up / Even · D 46.6% · R 51.6% · Other 1.8%
- 2008→2024 swing
- -9.3pp toward R · 2008: 4.4pp · 2024: -5.0pp
- All cycles
- 2024: R+5.0 2020: R+4.4 2016: R+9.4 2012: R+8.7 2008: D+4.4
Not yet ingested
- Civics
- —
Market trends
- HPI YoY
- ▼ -59.69%
- Current HPI
- 147.0877
- Rent YoY
- ▲ 12.19%
- Metro
- Springfield, IL
- State GDP YoY
- ▲ 1.59%
- F500 in state
- 60
Industry mix (Fortune 500 HQ in IL)
| Industry | F500 HQs | Revenue |
|---|---|---|
| Insurance | 4 | $201B |
|
||
| Consumer Goods | 4 | $87B |
|
||
| Industrial Machinery | 3 | $64B |
|
||
| Healthcare | 2 | $55B |
|
||
| Retail / Pharmacy | 1 | $148B |
|
||
| Agriculture / Food | 1 | $86B |
|
||
Price history
+465.2% since first listed11 events — show timeline
- 2026-03-17 Listed $65,000 RMLSA as Distributed by MLS Grid
- 2025-12-17 Listing Removed — MRED as Distributed by MLS Grid
- 2025-12-15 Listing Removed — RMLSA as Distributed by MLS Grid
- 2025-09-08 Listed — RMLSA as Distributed by MLS Grid
- 2023-09-04 Listing Removed — RMLSA as Distributed by MLS Grid
- 2023-03-02 Listed — RMLSA as Distributed by MLS Grid
- 2022-02-24 Sold (Public Records) $375,950 Public Records
- 2022-02-24 Sold (Public Records) $375,950 Public Records
- 2021-08-06 Listing Removed — RMLSA as Distributed by MLS Grid
- 2008-07-07 Sold (MLS) $10,500 RMLSA as Distributed by MLS Grid
- 2008-04-29 Listed $11,500 RMLSA as Distributed by MLS Grid
Property tax history
+4.4%/yrLatest (2024): $1,247 · +4.0% YoY. Source: county tax records.
Cash-flow waterfall
monthlySold comps — $/sqft
last 12 mo · ≤1 miLoading sold comps…