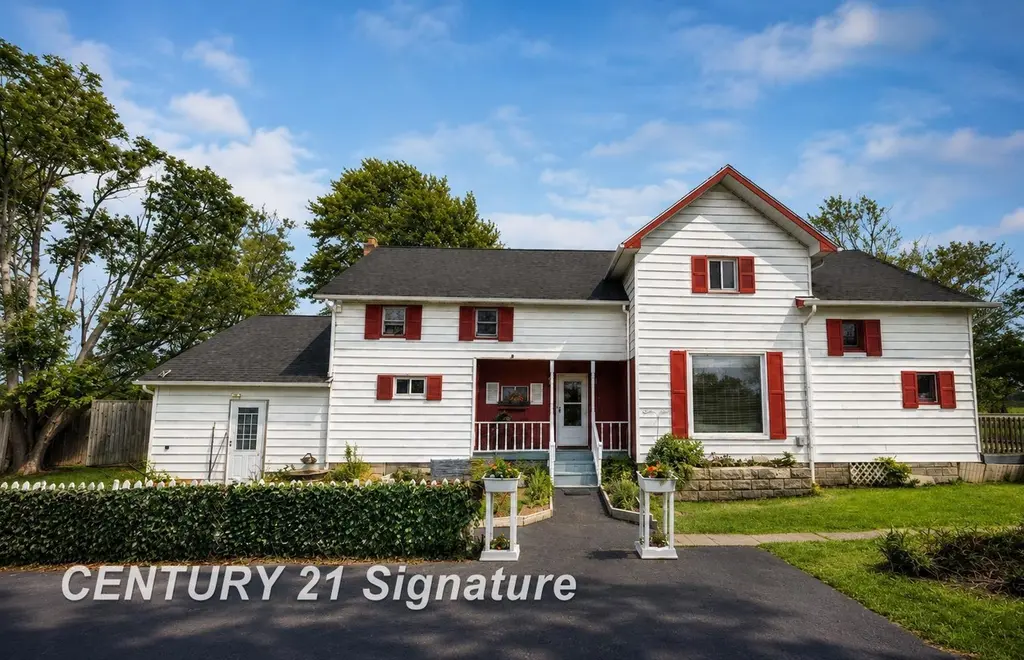
970 Cass Avenue Road Rd · Portsmouth, MI
Flood risk 1/10 · Minimal
- FEMA flood zone
- X (unshaded)
- Chance of flooding over 30 yrs
- 0.0%
- Est. flood insurance / yr
- $507 – $1,088
Fire risk 1/10 · Minimal
- Est. fire insurance / yr
- $784 – $1,456
Heat risk 2/10 · Minimal
- Hot days now (above 97°F)
- 7 days/yr
- Hot days in 30 yrs
- 14 days/yr
Wind risk 1/10 · Minimal
- Chance of severe wind over 30 yrs
- —
Air-quality risk 2/10 · Minimal
- Unhealthy air days now
- 1 days/yr
- Unhealthy air days in 30 yrs
- 2 days/yr
Risk factors via First Street. Map © Google.
Why this score? — see what drove the D grade
The composite is a weighted blend of 9 inputs, each scored 0–100. Each bar is that input's sub-score; the figure is the points it added to the 100-point composite (weight × sub-score).
- Cash flow +16.1/30.0
- ARV discount +7.5/15.0
- DSCR +5.0/10.0
- 1% rule +3.7/10.0
- Schools +2.8/10.0
- Rent growth +2.5/5.0
- Livability +2.5/5.0
- Condition / age +2.5/5.0
- Appreciation +0.0/10.0
$175,000
🖨 Deal sheet (PDF) 📄 Offer letter ✓ Due diligence
Listing remarks
A grand historic farmhouse rich with charm and timeless craftsmanship. From the original woodwork to the beautiful architectural details throughout. While the home needs some cosmetic updating, it is priced accordingly, giving you the opportunity to add your own vision and style. The irreplaceable architectural features are already here and the major updates have already been completed! Including newer windows, newer roof, updated electrical, a remodeled bathroom, newer furnace, newer hot water heater and more. Situated on 1.55 acres in a peaceful country setting, this spacious home offers two kitchens, a large dining area, an inviting living room, one main-floor bedroom, four additional be
Key facts
- Updated electrical
- Newer roof
- Historic farmhouse
Tags
Property features AI
Exterior
- Utilities: Public water; Septic system; Natural gas heating fuel; Gas water heater
- Home design: Residential 2-story home; Built in 1894; Facing / entry level details not specified
- Construction: Vinyl siding construction; Basement and crawlspace foundation
- Exterior features: Vinyl siding; Road frontage
Interior
- Kitchen: Dishwasher; Range / Oven
- Bedrooms: Main-level primary bedroom; Additional bedrooms on the second floor (multiple)
- Bathrooms: One full bathroom (main level)
- Heating & cooling: Forced air heating; No central air (no cooling system listed)
- Interior features: Decorative electric fireplace (1 total); Has basement
Neighborhood map
What this means for you Summary
Snapshot
- This is a 5-bed/1.0-bath single-family listed at $175k.
Deal economics
- At list price, monthly cash flow is $90 ($1k/yr) — positive.
- The deal already cash-flows at list — no discount required.
- To meet the 1% rule (rent ≥ 1% of price), the offer needs to be $152k (13.2% below list).
- Recommended offer: $152k (13.2% below list) — sets the bar for 1% rule.
Location & tenants
- Location reads: area grade D — affects rentability + tenant quality, not the cash-flow math above.
- Bay City School District (urban): math 27% / reading 40% proficiency, ranked #317 of 540 in MI (top 59%) — families likely to look elsewhere, expect single-tenant / working-renter base with shorter leases.
- Zoned schools: Hampton Elementary School (math 37% / reading 42%, grade F, #606 of 1,397 statewide, top 48%, 405 students, 67% FRL); Handy Middle School (math 17% / reading 33%, grade F, #387 of 493 statewide, top 78%, 685 students, 79% FRL); Bay City Central High School (math 22% / reading 47%, grade F, #372 of 713 statewide, top 56%, 1,033 students, 64% FRL) — zoned schools average 70% FRL vs 44% district-wide (26 pts higher); higher-poverty schools than district average — tighter screening recommended.
- Market conditions: 150 active listings in the ZIP; 39 units permitted in Bay County in 2024 (0 in 5+ unit buildings).
- This rent runs 36% of the median local income ($51k/yr) — at the standard rent-burdened threshold; future hikes will face affordability resistance.
Forward outlook
- Local home prices are declining (-3.0%/yr); year-one equity from $1k of loan paydown is wiped out by about $5k of value loss. Plan a longer hold.
- Bay County population projected at -21% by 2050 — secular population decline; favor cash flow + early exit over multi-decade hold.
Negotiation context
- Only 8 days on market — expect competitive offers; lowballing is unlikely to land.
Risks & watch-outs
- Watch-outs: built in 1894 — expect roof / HVAC / electrical / plumbing capex.
Questions for the listing agent
- Built in 1894 — when were the roof, HVAC, electrical panel, plumbing, and water heater last replaced?
- Is there a deadline driving the sale (1031 exchange, divorce, estate, relocation)? That informs how much negotiation room exists.
- The area grade is low — what's the realistic commute time and amenity access for the typical tenant pool here? Any planned neighborhood developments (good or bad) we should know about?
- What's the average days-on-market for RENTAL listings here right now (not sales)? A rising rental-DOM trend means longer vacancies and softer asking-rent achievability than the comps imply.
- What's the recent tenant-quality profile in this submarket — average credit score on applications, eviction rate, late-payment / NSF rate, and stable-employment percentage? A property-management company in the area should have these aggregated.
- How much new for-sale + rental construction is in the pipeline within 1–3 miles? Heavy new supply typically softens prices + rents 12–24 months out; constrained supply supports both.
Investment metrics
- 1% rule
- 0.87% ✗
- Cap rate
- 6.91%
- Cash-on-cash
- 2.20%
- DSCR
- 1.10
- GRM
- 9.6
CMA / ARV
No comps found within radius.
Projected returns pro-forma
-3.0% appreciation · 3.0% rent growth · sell at horizon
- IRR
- -12.8%
- Equity multiple
- 0.54×
- Total profit
- $-22,684
- Equity at exit
- $26,093
- IRR
- -3.9%
- Equity multiple
- 0.74×
- Total profit
- $-12,553
- Equity at exit
- $15,131
Cash invested: $49,000 (down + closing). Projections, not guarantees.
Landlord ↔ Tenant lean methodology
- Overall (STATE)
- 62 Landlord-Friendly
- State Michigan
- 62 Landlord-Friendly · EVEN
- County
- — inherits STATE
- City
- — inherits STATE
ZIP-level market 48708
- Home prices YoY
- -30.9%
- Active inventory
- 150
- Price-to-rent
- 9.6×
Monthly cashflow live
- Estimated rent
- $1,519 medium interval (Pro) →
- Mortgage (P&I)
- −$918
- Tax from tax record
- −$120 /mo · $1,437/yr
- Insurance
- −$73
- HOA
- −$0
- Vacancy / Maint / Mgmt
- −$319
- Net cashflow
- $90
Break-even live
Sensitivity live
| Price | -10% $189 | -5% $139 | +0% $90 | +5% $40 | +10% $-9 |
|---|---|---|---|---|---|
| Rent | -10% $-30 | -5% $30 | +0% $90 | +5% $150 | +10% $210 |
| Rate | -1.0pp $178 | -0.5pp $134 | base $90 | +0.5pp $44 | +1.0pp $-2 |
UW: 25.0% down · 7.5% · 30yr · 1.5% tax · 5.0% vac · 8.0% maint · 8.0% mgmt
Financing live
Cash to close
- Down payment
- $43,750
- Closing costs
- $5,250
- Reserves months
- —
- Total cash needed
- —
Loan-product check · same deal, 3 products live
Conventional
25% down · 7.5% · 30yr
- Down + closing
- —
- Monthly P&I
- —
- Monthly cashflow
- —
- DSCR
- —
- Eligible?
- —
Personal DTI + credit; lowest rate.
DSCR
20% down · 8.5% · 30yr
- Down + closing
- —
- Monthly P&I
- —
- Monthly cashflow
- —
- DSCR
- —
- Eligible?
- —
No personal income docs; deal must DSCR.
Hard money
10% down · 12.0% · 12mo
- Down + closing
- —
- Monthly P&I
- —
- Monthly cashflow
- —
- DSCR
- —
- Eligible?
- —
Short-term bridge; refi at stabilization.
Listing history 10 events
-
2026-06-22days on market $175,000 Active 8 DOM
-
2026-06-21days on market $175,000 Active 7 DOM
-
2026-06-19days on market $175,000 Active 5 DOM
-
2026-06-18days on market $175,000 Active 4 DOM
-
2026-06-17days on market $175,000 Active 3 DOM
-
2026-06-16days on market $175,000 Active 2 DOM
-
2026-06-16days on market $175,000 Active 1 DOM
-
2026-06-15days on market $175,000 Active 2 DOM
-
2026-06-14remarks 699-char remark
-
2026-06-14$175,000 Active 1 DOM
ⓘ Source: listings_history table (triggers on properties + properties_extension) + one-shot
backfill from property_details.listing_events for pre-trigger history.
Tax reassessment forecast MI · Partial reset (capped growth)
- Current annual tax
- $1,437 · $120/mo
- Projected year-2 tax
- $2,066 · $172/mo
- Expected delta
- +$629/yr (+$52/mo · 43.8%)
ⓘ Screening estimate from a state-policy table — verify with the county assessor before closing.
Climate risk First Street
- Flood 1/10 Low FEMA zone X (unshaded) · 0% chance over 30 yrs
- Wildfire 1/10 Low
- Heat 2/10 Low 7 d/yr ≥97°F today · 14 d/yr by 30 yrs out
- Wind 1/10 Low
- Air quality 2/10 Low 1 unhealthy d/yr today · 2 by 30 yrs out
Nearby sold comps map
Loading sold comps map…
Walkable amenities ~0.75 mi
Loading nearby amenities…
Taxation est. · year 1
- Rental income
- $18,228
- − Mortgage interest
- −$9,803
- − Property taxes
- −$1,437
- − Insurance
- −$875
- − Repairs & maintenance
- −$1,458
- − Management
- −$1,458
- − Depreciation
- −$5,091
- Taxable loss
- −$1,894
- Est. tax savings @ 24.0%
- +$454
- After-tax cash flow
- $1,530/yr
For passive investors: Depreciation is non-cash, so a rental often shows a tax loss while cash-flowing — sheltering income. Rental losses are passive: they offset passive income freely, and up to $25,000/yr can offset ordinary (W-2) income if you actively participate and your MAGI is under $100k (phasing out to $0 by $150k); unused losses carry forward. On sale, claimed depreciation is recaptured at up to 25%, and gains may owe capital-gains tax (a 1031 exchange can defer both). Figures are a year-1 estimate at your 24.0% rate — not tax advice; consult a CPA.
Schools (NCES district)
- District
- Bay City School District
- NCES district ID
- 2604260
- Math proficiency
- 27% ▼ -8.00%
- Reading proficiency
- 40% ▼ -4.00%
- Median HH income
- $43,833
- Composite
- 28.47/100
- National rank
- #6743
- State rank
- #317 of 540 in MI
Livability — Portsmouth
No livability data for this city. (Only ~50 U.S. cities are tracked.)
Census & demographics
- County
- Bay County · 36,975 people
- Metro
- Bay City, MI
- Population (ZIP)
- 25,635
- Household income
- $50,518
- Rent vs Own
- Severe rent burden
- 528.0
Population outlook (Bay County) Hauer SSP2
- Today (2025)
- 101,476 people
- By 2030
- 98,152 · -3.3%
- By 2040
- 89,711 · -11.6%
- By 2050
- 80,614 · -20.6%
- By 2075
- 60,544 · -40.3%
- By 2100
- 41,603 · -59.0%
Race, ethnicity, and origin ACS 2023
- Neighborhood character
- Predominantly White (81%)
- Race & ethnicity
- White 81% Hispanic / Latino 11% Two or more races 10% Black 3%
- Hispanic origin (detail)
- Mexican 9%
- Common ancestry
- Romanian 17% Lithuanian 7% Slovak 2%
- Foreign-born
- 2% · Canada, South Korea
- Languages at home
- 96% English-only · Spanish 2% German/W. Germanic 1%
Political lean MEDSL · Bay
- 2024 margin
- R (+14.7) · D 42.0% · R 56.7% · Other 1.3%
- 2008→2024 swing
- -30.0pp toward R · 2008: 15.3pp · 2024: -14.7pp
- All cycles
- 2024: R+14.7 2020: R+11.6 2016: R+12.6 2012: D+6.0 2008: D+15.3
Not yet ingested
- Civics
- —
Market trends
- HPI YoY
- ▼ -82.21%
- Current HPI
- 183.5774
- Rent YoY
- —
- Metro
- Bay City, MI
- State GDP YoY
- ▲ 1.37%
- F500 in state
- 28
Industry mix (Fortune 500 HQ in MI)
| Industry | F500 HQs | Revenue |
|---|---|---|
| Automotive Parts | 3 | $48B |
|
||
| Automotive | 2 | $372B |
|
||
| Chemicals | 1 | $45B |
|
||
| Automotive Retail | 1 | $29B |
|
||
| Healthcare / Medical Devices | 1 | $23B |
|
||
| Automotive Technology | 1 | $20B |
|
||
Price history
1 event — show timeline
- 2026-06-13 Listed $175,000 MiRealSource-MiMLS
Property tax history
-0.5%/yrLatest (2025): $1,437 · +4.1% YoY. Source: county tax records.
Cash-flow waterfall
monthlySold comps — $/sqft
last 12 mo · ≤1 miLoading sold comps…