 9-Plex
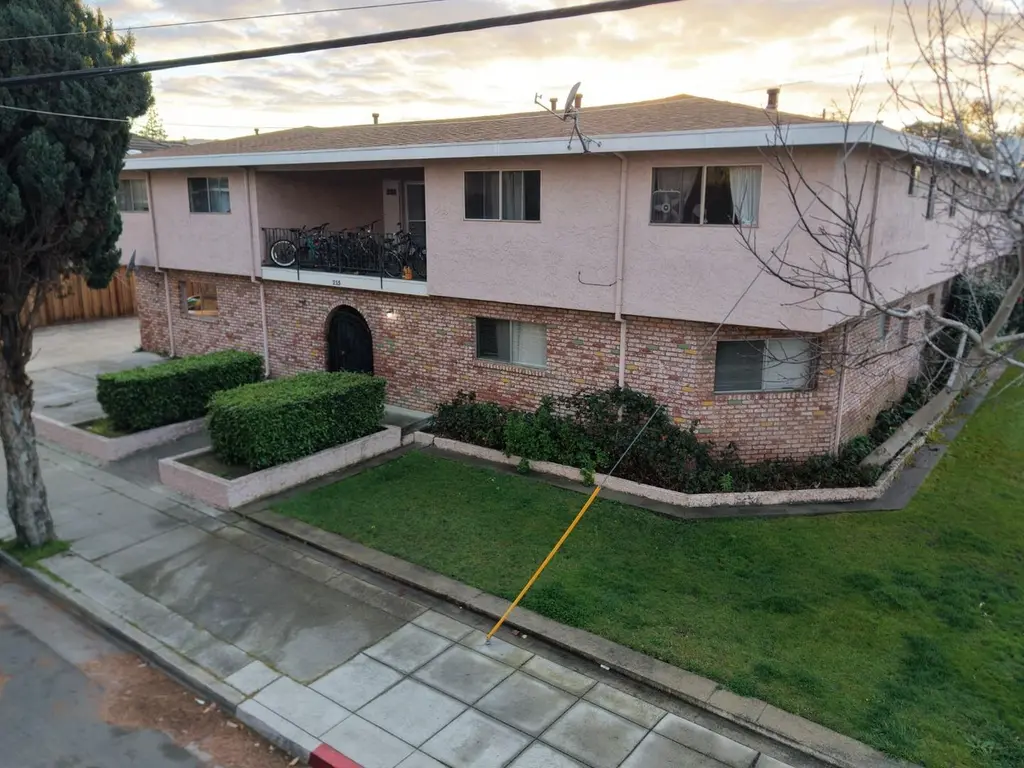
215 Charles St · Sunnyvale, CA
Flood risk 1/10 · Minimal
- FEMA flood zone
- X (shaded)
- Chance of flooding over 30 yrs
- 0.0%
- Est. flood insurance / yr
- $507 – $1,088
Fire risk 1/10 · Minimal
- Est. fire insurance / yr
- $659 – $1,223
Heat risk 4/10 · Minor
- Hot days now (above 92°F)
- 7 days/yr
- Hot days in 30 yrs
- 14 days/yr
Wind risk 1/10 · Minimal
- Chance of severe wind over 30 yrs
- —
Air-quality risk 7/10 · Major
- Unhealthy air days now
- 13 days/yr
- Unhealthy air days in 30 yrs
- 13 days/yr
Risk factors via First Street. Map © Google.
Why this score? — see what drove the C grade
The composite is a weighted blend of 9 inputs, each scored 0–100. Each bar is that input's sub-score; the figure is the points it added to the 100-point composite (weight × sub-score).
- Cash flow +18.5/30.0
- Schools +8.3/10.0
- ARV discount +7.5/15.0
- DSCR +5.8/10.0
- Livability +4.1/5.0
- 1% rule +3.8/10.0
- Rent growth +3.7/5.0
- Appreciation +3.5/10.0
- Condition / age +2.5/5.0
$3,980,000
🖨 Deal sheet (PDF) 📄 Offer letter ✓ Due diligence
Multi-family units
County records classify this as Multi-Family (5+ Unit). Listing-text estimate: 9 units. confirmed
5+ unit building — per-unit beds/baths from public records are typically unavailable; the breakdown below (if shown) is an estimate from the listing text.
Listing remarks MLS
215 Charles St. is a well-maintained, 9-unit apartment community built in 1971, situated in a premier location just one block from downtown Sunnyvale. The property features a superior unit mix consisting exclusively of two-bedroom, one-bathroom floor plans, catering to high-demand renter demographics. Can be purchased together or separately with the 6 unit apartment property located at 530 Columbia Ave in Sunnyvale. Also listed on MLS# ML82046337
Key facts
- 0.28 acre lot
- 9 parking spots
- Built 1971
Property features AI
Finance
- Other: Meters: primary water, separate electric, separate gas; Tenant-paid utilities: electric, gas, heating, hot water
- Financial info: Property has 9 units with annual gross income approximately $223,665 and annual rental income reported at $229,080; Gross scheduled income $229,080 and gross rent multiplier 17.26; Other income $1,502; other expenses $950; total expenses $83,474; vacancy factor 3%; Landscape expense $1,300; trash expense $6,731; utility expenses $13,464
Exterior
- Parking: Carport parking for nine vehicles; Covered and uncovered parking
- Utilities: Public water; Public sewer; Public utilities
- Home design: Individual ownership
- Construction: Concrete slab foundation
- Exterior features: Composition roof; Cable TV and satellite available; One building; R4 zoning
Interior
- Kitchen: Includes typical kitchen appliances (unit-level details not specified)
- Bedrooms: Nine 2-bedroom units
- Flooring: Carpet; Laminate; Tile
- Bathrooms: Nine 1-bath units
- Heating & cooling: Forced air heating; Window/wall cooling units
- Interior features: Carpet, laminate and tile flooring
- Laundry & utility: Separate electric and separate gas meters; Utilities for units include electric, gas, heating and hot water (tenant-paid)
Neighborhood map
What this means for you Summary
Snapshot
- This is a 9 × 2-bed/1.0-bath units multifamily listed at $3.98M.
Deal economics
- At list price, monthly cash flow is $4k ($46k/yr) — positive. Per door: $424/mo.
- The deal already cash-flows at list — no discount required.
- To meet the 1% rule (rent ≥ 1% of price), the offer needs to be $3.50M (12.1% below list).
- Recommended offer: $3.50M (12.1% below list) — sets the bar for 1% rule.
- Cap rate 7.4% vs local median 1.2% in Sunnyvale — top-decile yield for the area; either an underpriced asset or a hidden risk that comps aren't pricing in. Stress-test before assuming the spread holds.
Location & tenants
- Location reads 82/100 on livability (#37 in CA, #1,258 nationally) — a professional / high-income tenant draw. Strengths: amenities A+, commute A+, employment A+; Watch: cost of living F.
- Fremont Union High (urban): math 87% / reading 91% proficiency, ranked #6 of 517 in CA (top 1%) — strong family-tenant draw, lease renewals of 3-5y typical.
- Zoned schools: Homestead High (math 87% / reading 92%, grade A+, #14 of 1,170 statewide, top 1%, 2,311 students, 12% FRL).
- Market conditions: Rents rising fast (+5.0%/yr); 93 active listings in the ZIP; high-income renter base; 3,838 units permitted in Santa Clara County in 2024 (1,886 in 5+ unit buildings).
- At $34,965/mo this rent would consume 237% of the median local household income ($177k/yr) (locally 2421% of renters already pay >50% of income on rent) — very limited rent-growth headroom before tenants either downsize or default.
Forward outlook
- Local home prices are declining (-2.9%/yr); year-one equity from $28k of loan paydown is wiped out by about $117k of value loss. Plan a longer hold.
- Santa Clara County population projected at +24% by 2050 — long-run rental-demand tailwind backs the buy-and-hold thesis.
Negotiation context
- It's been on market 42 days — a 3% lower offer ($3.86M) is reasonable based on typical stale-listing flexibility.
- 2 sale attempts with the ask held roughly flat each time — persistent listings suggest the price (not the market) is what's stuck; bring a comps-based counter.
Questions for the listing agent
- It's been on market 42 days. Have you received any prior offers? Is the seller open to a 12% concession, seller financing, or rate buy-down credit?
- Can we see the unit-by-unit rent roll, current vacancy, and any below-market leases? What's the average tenancy length?
- What capital expenditures (roof, boiler, parking lot, exteriors) have been made in the last 5 years, and what's planned in the next 2?
- Built in 1971 — when were the roof, HVAC, electrical panel, plumbing, and water heater last replaced?
- Is there a deadline driving the sale (1031 exchange, divorce, estate, relocation)? That informs how much negotiation room exists.
- Schools are B-rated — typically a magnet for longer-tenancy family renters. What's the average tenant stay here, and is there a school-zone premium baked into asking?
- What's the average days-on-market for RENTAL listings here right now (not sales)? A rising rental-DOM trend means longer vacancies and softer asking-rent achievability than the comps imply.
- What's the recent tenant-quality profile in this submarket — average credit score on applications, eviction rate, late-payment / NSF rate, and stable-employment percentage? A property-management company in the area should have these aggregated.
- How much new apartment / multifamily construction is in the pipeline within 1–3 miles? Heavy new supply (>2% of stock underway) typically softens rents 12–24 months out; light construction supports rent growth.
Investment metrics
- 1% rule
- 0.88% ✗
- Cap rate
- 7.44%
- Cash-on-cash
- 4.11%
- DSCR
- 1.18
- GRM
- 9.5
CMA / ARV
No comps found within radius.
Projected returns pro-forma
-2.94% appreciation · 4.97% rent growth · sell at horizon
- IRR
- -7.7%
- Equity multiple
- 0.71×
- Total profit
- $-323,738
- Equity at exit
- $603,237
- IRR
- 3.8%
- Equity multiple
- 1.30×
- Total profit
- $333,699
- Equity at exit
- $360,984
Cash invested: $1,114,400 (down + closing). Projections, not guarantees.
Landlord ↔ Tenant lean methodology
- Overall (STATE)
- 18 Strongly Tenant-Friendly
- State California
- 18 Strongly Tenant-Friendly · D+13
- County
- — inherits STATE
- City
- — inherits STATE
ZIP-level market 94086
- Home prices YoY
- -0.7%
- Rents YoY
- 5.0%
- Active inventory
- 93
- Price-to-rent
- 85.4×
Monthly cashflow live
- Estimated rent
- $34,965 high interval (Pro) →
- Mortgage (P&I)
- −$20,872
- Tax from tax record
- −$1,276 /mo · $15,315/yr
- Insurance
- −$1,658
- HOA
- −$0
- Vacancy / Maint / Mgmt
- −$7,343
- Net cashflow
- $3,816
Break-even live
Sensitivity live
| Price | -10% $6,069 | -5% $4,943 | +0% $3,816 | +5% $2,690 | +10% $1,563 |
|---|---|---|---|---|---|
| Rent | -10% $1,054 | -5% $2,435 | +0% $3,816 | +5% $5,197 | +10% $6,578 |
| Rate | -1.0pp $5,821 | -0.5pp $4,828 | base $3,816 | +0.5pp $2,785 | +1.0pp $1,736 |
9-unit breakdown (identical units grouped — click to expand)
| Units | Beds | Baths | Est. rent |
|---|---|---|---|
| 9× units | 2 | 1 | $34,965 |
| #1 | 2 | 1 | $3,885 |
| #2 | 2 | 1 | $3,885 |
| #3 | 2 | 1 | $3,885 |
| #4 | 2 | 1 | $3,885 |
| #5 | 2 | 1 | $3,885 |
| #6 | 2 | 1 | $3,885 |
| #7 | 2 | 1 | $3,885 |
| #8 | 2 | 1 | $3,885 |
| #9 | 2 | 1 | $3,885 |
| Total (9 units) | $34,965 | ||
UW: 25.0% down · 7.5% · 30yr · 1.5% tax · 5.0% vac · 8.0% maint · 8.0% mgmt
Financing live
Cash to close
- Down payment
- $995,000
- Closing costs
- $119,400
- Reserves months
- —
- Total cash needed
- —
Loan-product check · same deal, 3 products live
Conventional
25% down · 7.5% · 30yr
- Down + closing
- —
- Monthly P&I
- —
- Monthly cashflow
- —
- DSCR
- —
- Eligible?
- —
Personal DTI + credit; lowest rate.
DSCR
20% down · 8.5% · 30yr
- Down + closing
- —
- Monthly P&I
- —
- Monthly cashflow
- —
- DSCR
- —
- Eligible?
- —
No personal income docs; deal must DSCR.
Hard money
10% down · 12.0% · 12mo
- Down + closing
- —
- Monthly P&I
- —
- Monthly cashflow
- —
- DSCR
- —
- Eligible?
- —
Short-term bridge; refi at stabilization.
Listing history 15 events
-
2026-06-18days on market $3,980,000 Active 42 DOM
-
2026-06-17days on market $3,980,000 Active 41 DOM
-
2026-06-16days on market $3,980,000 Active 40 DOM
-
2026-06-15days on market $3,980,000 Active 39 DOM
-
2026-06-13days on market $3,980,000 Active 37 DOM
-
2026-06-09days on market $3,980,000 Active 33 DOM
-
2026-06-08days on market $3,980,000 Active 32 DOM
-
2026-06-07days on market $3,980,000 Active 31 DOM
-
2026-06-05days on market $3,980,000 Active 28 DOM
-
2026-06-03days on market $3,980,000 Active 27 DOM
-
2026-06-02days on market $3,980,000 Active 26 DOM
-
2026-06-01days on market $3,980,000 Active 25 DOM
-
2026-05-31days on market $3,980,000 Active 24 DOM
-
2026-05-08$3,980,000 Active 450-char remark
Show marketing remark (450 chars)
215 Charles St. is a well-maintained, 9-unit apartment community built in 1971, situated in a premier location just one block from downtown Sunnyvale. The property features a superior unit mix consisting exclusively of two-bedroom, one-bathroom floor plans, catering to high-demand renter demographics. Can be purchased together or separately with the 6 unit apartment property located at 530 Columbia Ave in Sunnyvale. Also listed on MLS# ML82046337
ⓘ Source: listings_history table (triggers on properties + properties_extension) + one-shot
backfill from property_details.listing_events for pre-trigger history.
Tax reassessment forecast CA · Resets to sale price
- Current annual tax
- $15,315 · $1,276/mo
- Projected year-2 tax
- $30,248 · $2,521/mo
- Expected delta
- +$14,933/yr (+$1,244/mo · 97.5%)
ⓘ Screening estimate from a state-policy table — verify with the county assessor before closing.
Climate risk First Street
- Flood 1/10 Low FEMA zone X (shaded) · 0% chance over 30 yrs
- Wildfire 1/10 Low
- Heat 4/10 Moderate 7 d/yr ≥92°F today · 14 d/yr by 30 yrs out
- Wind 1/10 Low
- Air quality 7/10 Severe 13 unhealthy d/yr today · 13 by 30 yrs out
Nearby sold comps map
Loading sold comps map…
Walkable amenities ~0.75 mi
Loading nearby amenities…
Taxation est. · year 1
- Rental income
- $419,580
- − Mortgage interest
- −$222,942
- − Property taxes
- −$15,315
- − Insurance
- −$19,900
- − Repairs & maintenance
- −$33,566
- − Management
- −$33,566
- − Depreciation
- −$115,782
- Taxable loss
- −$21,492
- Est. tax savings @ 24.0%
- +$5,158
- After-tax cash flow
- $50,952/yr
For passive investors: Depreciation is non-cash, so a rental often shows a tax loss while cash-flowing — sheltering income. Rental losses are passive: they offset passive income freely, and up to $25,000/yr can offset ordinary (W-2) income if you actively participate and your MAGI is under $100k (phasing out to $0 by $150k); unused losses carry forward. On sale, claimed depreciation is recaptured at up to 25%, and gains may owe capital-gains tax (a 1031 exchange can defer both). Figures are a year-1 estimate at your 24.0% rate — not tax advice; consult a CPA.
Schools (NCES district)
- District
- Fremont Union High
- NCES district ID
- 0614430
- Math proficiency
- 87% ▲ 9.00%
- Reading proficiency
- 91% ▲ 10.00%
- Median HH income
- $128,947
- Composite
- 82.66/100
- National rank
- #20
- State rank
- #6 of 517 in CA
Livability — Sunnyvale
- Score
- 82/100
- State rank
- #37
- US rank
- #1258
Category grades
Schools grade is shown separately in the Schools card above.
Census & demographics
- Census place
- Sunnyvale, CA
- County
- Santa Clara County · 1,806,974 people
- City population
- 154,236
- Metro
- San Jose-Sunnyvale-Santa Clara, CA
- Population (ZIP)
- 49,746
- Household income
- $177,054
- Rent vs Own
- Severe rent burden
- 2421.0
Population outlook (Santa Clara County) Hauer SSP2
- Today (2025)
- 2,179,074 people
- By 2030
- 2,301,297 · +5.6%
- By 2040
- 2,528,195 · +16.0%
- By 2050
- 2,712,135 · +24.5%
- By 2075
- 2,998,701 · +37.6%
- By 2100
- 2,931,429 · +34.5%
Race, ethnicity, and origin ACS 2023
- Neighborhood character
- Diverse neighborhood (Simpson 0.66)
- Race & ethnicity
- Asian 49% White 28% Hispanic / Latino 17% Two or more races 11% Black 1%
- Hispanic origin (detail)
- Mexican 12%
- Common ancestry
- Scotch-Irish 2% Italian 2% Lithuanian 1%
- Foreign-born
- 50% · China, Canada, South Korea
- Languages at home
- 40% English-only · Chinese 15% Other Indo-European 14% Spanish 11%
Political lean MEDSL · Santa Clara
- 2024 margin
- Solid D (+40.0) · D 68.1% · R 28.1% · Other 3.8%
- 2008→2024 swing
- -0.9pp no change · 2008: 40.9pp · 2024: 40.0pp
- All cycles
- 2024: D+40.0 2020: D+47.4 2016: D+52.5 2012: D+42.1 2008: D+40.9
Not yet ingested
- Civics
- —
Market trends
- HPI YoY
- ▼ -2.94%
- Current HPI
- 403.7164
- Rent YoY
- ▲ 4.97%
- Metro
- San Jose-Sunnyvale-Santa Clara, CA
- State GDP YoY
- ▲ 3.21%
- F500 in state
- 116
Industry mix (Fortune 500 HQ in CA)
| Industry | F500 HQs | Revenue |
|---|---|---|
| Technology | 27 | $1,492B |
|
||
| Financial Services | 3 | $174B |
|
||
| Retail | 3 | $44B |
|
||
| Insurance | 3 | $26B |
|
||
| Media / Entertainment | 2 | $115B |
|
||
| Pharmaceuticals / Biotech | 2 | $62B |
|
||
Price history
+0.0% since first listed2 events — show timeline
- 2026-05-08 Listed $3,980,000 bridgeMLS, Bay East AOR, or Contra Costa AOR
- 2026-05-08 Listed $3,980,000 MLSListings
Property tax history
+1.8%/yrLatest (2025): $15,315 · +3.8% YoY. Source: county tax records.
Cash-flow waterfall
monthlySold comps — $/sqft
last 12 mo · ≤1 miLoading sold comps…