70200 Dillon Rd #346 · Desert Edge, CA
Flood risk 1/10 · Minimal
- FEMA flood zone
- A
- Chance of flooding over 30 yrs
- 0.0%
- Est. flood insurance / yr
- $1,009 – $1,996
Fire risk 5/10 · Moderate
- Est. fire insurance / yr
- $659 – $1,223
Heat risk 8/10 · Major
- Hot days now (above 109°F)
- 6 days/yr
- Hot days in 30 yrs
- 16 days/yr
Wind risk 1/10 · Minimal
- Chance of severe wind over 30 yrs
- —
Air-quality risk 5/10 · Moderate
- Unhealthy air days now
- 6 days/yr
- Unhealthy air days in 30 yrs
- 8 days/yr
Risk factors via First Street. Map © Google.
Why this score? — see what drove the B+ grade
The composite is a weighted blend of 9 inputs, each scored 0–100. Each bar is that input's sub-score; the figure is the points it added to the 100-point composite (weight × sub-score).
- Cash flow +30.0/30.0
- ARV discount +15.0/15.0
- 1% rule +10.0/10.0
- DSCR +10.0/10.0
- Condition / age +3.8/5.0
- Livability +3.4/5.0
- Schools +2.7/10.0
- Rent growth +2.5/5.0
- Appreciation +0.0/10.0
$45,000
🖨 Deal sheet 📄 Offer letter ✓ Due diligence
Listing remarks MLS
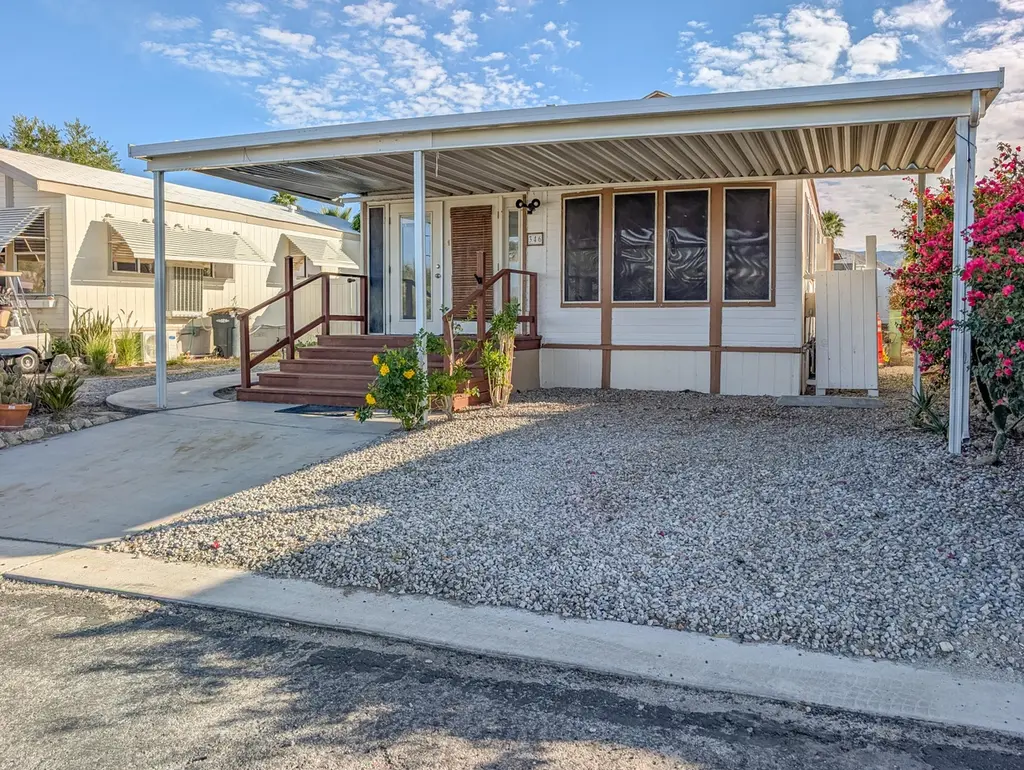
Great Opportunity! Steps to the Clubhouse, this listing presents a 2-bedroom, 1991 National Park Model home with low rents at the esteemed 55+ Caliente Springs Resort. The residence offers wood-style flooring throughout, a dedicated laundry room outfitted with a stack washer and dryer, and a generous, private backyard featuring fruit trees and peaceful serenity, a large shed for storage alongside picturesque views of Mt. San Jacinto and surrounding hills. Residents have access to a range of amenities, including a 9-hole golf course, mineral-fed hot springs pool and spas, chapel services, and additional facilities. The property is move-in ready and provides a versatile space suitable for personal customization to meet your design preferences. Please note that the lot is not owned; monthly space rent is $707. Make offers!
Key facts
- Private backyard
- Fruit trees
- Large shed
Tags
Neighborhood map
What this means for you Summary
Snapshot
- This is a 2-bed/1.0-bath manufactured listed at $45k. Condition is rated good.
Deal economics
- At list price, monthly cash flow is $1k ($12k/yr) — positive.
- The deal already cash-flows at list — no discount required.
- Meets the 1% rule at list price ($2k rent vs $45k).
- Recommended offer: $40k (12.0% below list) — sets the bar for market timing.
- Cap rate 37.2% vs local median 14.8% in Desert Edge — top-decile yield for the area; either an underpriced asset or a hidden risk that comps aren't pricing in. Stress-test before assuming the spread holds.
Location & tenants
- Location reads 68/100 on livability (#297 in CA) — a middle-class / working-renter tenant base. Strengths: cost of living A+, housing A+; Watch: crime C-, schools F, commute D-.
- Palm Springs Unified (suburban): math 21% / reading 42% proficiency, ranked #328 of 517 in CA (top 63%) — families likely to look elsewhere, expect single-tenant / working-renter base with shorter leases; 73% free/reduced lunch — lower-income household profile, screen leases tightly.
- Market conditions: 216 active listings in the ZIP; 5 comparable units currently listed for rent nearby; rentals at typical pace (median 24d on market — plan ~3-4 weeks tenant-placement turnaround); 40% of comp listings sitting > 30 days — soft ceiling on asking rent; 9,195 units permitted in Riverside County in 2024 (1,512 in 5+ unit buildings).
Forward outlook
- Local home prices are declining (-3.0%/yr); year-one equity from $311 of loan paydown is wiped out by about $1k of value loss. Plan a longer hold.
- Riverside County population projected at +22% by 2050 — long-run rental-demand tailwind backs the buy-and-hold thesis.
- At projected returns (-3.0% appreciation + 3.0% rent growth), your $13k cash investment doubles in ~2 years — after that, you're playing with house money.
Negotiation context
- It's been on market 126 days — a 12% lower offer ($40k) is reasonable based on typical stale-listing flexibility.
Risks & watch-outs
- Watch-outs: flood insurance adds $125/mo.
- Climate carrying-cost: in FEMA flood zone A (mandatory federal flood insurance); moderate wildfire risk; extreme-heat days projected 6→16/yr by 2055 (HVAC capex compounding) — expect insurance premiums to compound above CPI over the hold.
Questions for the listing agent
- It's been on market 126 days. Have you received any prior offers? Is the seller open to a 12% concession, seller financing, or rate buy-down credit?
- What's the actual annual flood-insurance premium (NFIP or private), and is the property in a SFHA with mandatory coverage?
- Why hasn't it sold? Are there any deal-killer items the seller is aware of (foundation, flood, title, zoning, code violations)?
- Is there a deadline driving the sale (1031 exchange, divorce, estate, relocation)? That informs how much negotiation room exists.
- Schools are F-rated, which usually means shorter tenancies and higher turnover. Who's the typical renter profile here, and what's been the actual vacancy rate?
- What's the average days-on-market for RENTAL listings here right now (not sales)? A rising rental-DOM trend means longer vacancies and softer asking-rent achievability than the comps imply.
- What's the recent tenant-quality profile in this submarket — average credit score on applications, eviction rate, late-payment / NSF rate, and stable-employment percentage? A property-management company in the area should have these aggregated.
- How much new for-sale + rental construction is in the pipeline within 1–3 miles? Heavy new supply typically softens prices + rents 12–24 months out; constrained supply supports both.
Investment metrics
- 1% rule
- 4.13% ✓
- Cap rate
- 37.17%
- Cash-on-cash
- 110.28%
- DSCR
- 5.91
- GRM
- 2.0
CMA / ARV
- ARV (median comp)
- $68,500
- List price
- $45,000
- Delta
- -34.31%
- Verdict
- UNDERPRICED
- Comps
- 20 within 1.0 mi
Show comp detail 12 sales within ~0.75 mi
| Address | Dist | Beds/Ba | Sqft | Sold | Price | $/sf | Match |
|---|---|---|---|---|---|---|---|
| 70200 Dillon Rd #102 | 0.12mi | 2/1.5 | 800 (0%) | 0mo | $72,000 | $90 | 92 |
| 70200 Dillon Rd #664 | 0.06mi | 2/1.5 | 800 (0%) | 3mo | $95,000 | $119 | 92 |
| 70200 Dillon Rd #550 | 0.12mi | 2/2.0 | 800 (0%) | 1mo | $122,000 | $153 | 90 |
| 70200 Dillon Rd #437 | 0.06mi | 1/1.0 (-1) | 780 (-2%) | 1mo | $65,000 | $83 | 87 |
| 70200 Dillon Rd #376 | 0.23mi | 1/1.0 (-1) | 800 (0%) | 3mo | $60,000 | $75 | 82 |
| 70200 Dillon Rd #536 | 0.23mi | 2/1.5 | 750 (-6%) | 1mo | $90,000 | $120 | 76 |
| 70200 Dillon Rd #436 | 0.07mi | 2/1.0 | 700 (-12%) | 7mo | $98,000 | $140 | 70 |
| 70200 Dillon Rd #569 | 0.23mi | 1/1.0 (-1) | 700 (-12%) | 4mo | $74,000 | $106 | 60 |
| 70200 Dillon Rd #157 | 0.23mi | 1/1.0 (-1) | 700 (-12%) | 6mo | $54,800 | $78 | 59 |
| 17625 Langlois #105 | 0.66mi | 2/2.0 | 840 (+5%) | 1mo | $55,000 | $65 | 56 |
| 17555-2 Corkill Rd #28 | 0.61mi | 2/2.0 | 880 (+10%) | 3mo | $99,990 | $114 | 48 |
| 17625 Langlois #9 | 0.66mi | 2/1.0 | 700 (-12%) | 3mo | $15,000 | $21 | 46 |
Match score weights: distance 35% · size 25% · config 20% · recency 20%. Top-matched comps best support the ARV.
Projected returns pro-forma
-3.0% appreciation · 3.0% rent growth · sell at horizon
- IRR
- 99.4%
- Equity multiple
- 5.65×
- Total profit
- $58,586
- Equity at exit
- $6,710
- IRR
- —
- Equity multiple
- 11.80×
- Total profit
- $136,136
- Equity at exit
- $3,891
Cash invested: $12,600 (down + closing). Projections, not guarantees.
Landlord ↔ Tenant lean methodology
- Overall (STATE)
- 18 Strongly Tenant-Friendly
- State California
- 18 Strongly Tenant-Friendly · D+13
- County
- — inherits STATE
- City
- — inherits STATE
ZIP-level market 92241
- Home prices YoY
- -22.8%
- Active inventory
- 216
- Price-to-rent
- 2.0×
Monthly cashflow live
- Estimated rent
- $1,859 high interval (Pro) →
- Mortgage (P&I)
- −$236
- Tax est. 1.5%
- −$56 /mo · $675/yr
- Insurance
- −$19
- Flood insurance flood zone
- −$125 /mo · $1,502/yr
- HOA
- −$0
- Vacancy / Maint / Mgmt
- −$390
- Net cashflow
- $1,033
Break-even live
UW: 25.0% down · 7.5% · 30yr · 1.5% tax · 5.0% vac · 8.0% maint · 8.0% mgmt
Financing live
Cash to close
- Down payment
- $11,250
- Closing costs
- $1,350
- Reserves months
- —
- Total cash needed
- —
Loan-product check · same deal, 3 products live
Conventional
25% down · 7.5% · 30yr
- Down + closing
- —
- Monthly P&I
- —
- Monthly cashflow
- —
- DSCR
- —
- Eligible?
- —
Personal DTI + credit; lowest rate.
DSCR
20% down · 8.5% · 30yr
- Down + closing
- —
- Monthly P&I
- —
- Monthly cashflow
- —
- DSCR
- —
- Eligible?
- —
No personal income docs; deal must DSCR.
Hard money
10% down · 12.0% · 12mo
- Down + closing
- —
- Monthly P&I
- —
- Monthly cashflow
- —
- DSCR
- —
- Eligible?
- —
Short-term bridge; refi at stabilization.
Rent comps 5 comps
| Address | Beds | Baths | Sqft | Rent | $/sqft | DOM | Units | Dist |
|---|---|---|---|---|---|---|---|---|
| 69360 Poolside Dr Desert Hot Springs, CA | 3.0 | 2.0 | 648 | $1,800 | $2.78 | 2d | 1 | 0.76mi |
| 70875 Dillon Rd Desert Hot Springs, CA | 2.0 | 2.0 | 720 | $2,200 | $3.06 | 43d | 1 | 0.88mi |
| 18070 Langlois Rd #257 Desert Hot Springs, CA | 2.0 | 2.0 | 1056 | $1,850 | $1.75 | 43d | 1 | 1.03mi |
| 18070 Langlois Rd Dsrt Hot Spgs, CA | 2.0 | 2.0 | 950 | $1,850 | $1.95 | 24d | 1 | 1.03mi |
| 15935 Mary Cir Desert Hot Springs, CA | 1.0 | 1.0 | 550 | $1,350 | $2.45 | 18d | 1 | 1.30mi |
Listing history 16 events
-
2026-06-18days on market $45,000 Active 126 DOM
-
2026-06-17days on market $45,000 Active 125 DOM
-
2026-06-16days on market $45,000 Active 124 DOM
-
2026-06-15days on market $45,000 Active 123 DOM
-
2026-06-13days on market $45,000 Active 121 DOM
-
2026-06-13days on market $45,000 Active 120 DOM
-
2026-06-09days on market $45,000 Active 117 DOM
-
2026-06-08days on market $45,000 Active 116 DOM
-
2026-06-07days on market $45,000 Active 115 DOM
-
2026-06-04days on market $45,000 Active 112 DOM
-
2026-06-03days on market $45,000 Active 111 DOM
-
2026-06-02days on market $45,000 Active 110 DOM
-
2026-06-01days on market $45,000 Active 109 DOM
-
2026-05-31days on market $45,000 Active 108 DOM
-
2026-05-16price $45,000 831-char remark
Show marketing remark (831 chars)
Great Opportunity! Steps to the Clubhouse, this listing presents a 2-bedroom, 1991 National Park Model home with low rents at the esteemed 55+ Caliente Springs Resort. The residence offers wood-style flooring throughout, a dedicated laundry room outfitted with a stack washer and dryer, and a generous, private backyard featuring fruit trees and peaceful serenity, a large shed for storage alongside picturesque views of Mt. San Jacinto and surrounding hills. Residents have access to a range of amenities, including a 9-hole golf course, mineral-fed hot springs pool and spas, chapel services, and additional facilities. The property is move-in ready and provides a versatile space suitable for personal customization to meet your design preferences. Please note that the lot is not owned; monthly space rent is $707. Make offers!
-
2026-02-12$55,000 Active 831-char remark
Show marketing remark (831 chars)
Great Opportunity! Steps to the Clubhouse, this listing presents a 2-bedroom, 1991 National Park Model home with low rents at the esteemed 55+ Caliente Springs Resort. The residence offers wood-style flooring throughout, a dedicated laundry room outfitted with a stack washer and dryer, and a generous, private backyard featuring fruit trees and peaceful serenity, a large shed for storage alongside picturesque views of Mt. San Jacinto and surrounding hills. Residents have access to a range of amenities, including a 9-hole golf course, mineral-fed hot springs pool and spas, chapel services, and additional facilities. The property is move-in ready and provides a versatile space suitable for personal customization to meet your design preferences. Please note that the lot is not owned; monthly space rent is $707. Make offers!
ⓘ Source: listings_history table (triggers on properties + properties_extension) + one-shot
backfill from property_details.listing_events for pre-trigger history.
Climate risk First Street
- Flood 1/10 Low FEMA zone A · 0% chance over 30 yrs
- Wildfire 5/10 Major
- Heat 8/10 Severe 6 d/yr ≥109°F today · 16 d/yr by 30 yrs out
- Wind 1/10 Low
- Air quality 5/10 Major 6 unhealthy d/yr today · 8 by 30 yrs out
Nearby sold comps map
Loading sold comps map…
Walkable amenities ~0.75 mi
Loading nearby amenities…
Taxation est. · year 1
- Rental income
- $22,312
- − Mortgage interest
- −$2,521
- − Property taxes
- −$675
- − Insurance
- −$1,727
- − Repairs & maintenance
- −$1,785
- − Management
- −$1,785
- − Depreciation
- −$1,309
- Taxable income
- $12,510
- Est. tax owed @ 24.0%
- −$3,002
- After-tax cash flow
- $9,390/yr
For passive investors: Depreciation is non-cash, so a rental often shows a tax loss while cash-flowing — sheltering income. Rental losses are passive: they offset passive income freely, and up to $25,000/yr can offset ordinary (W-2) income if you actively participate and your MAGI is under $100k (phasing out to $0 by $150k); unused losses carry forward. On sale, claimed depreciation is recaptured at up to 25%, and gains may owe capital-gains tax (a 1031 exchange can defer both). Figures are a year-1 estimate at your 24.0% rate — not tax advice; consult a CPA.
Condition & rehab AI · 12 photos
This move-in ready manufactured home is in good condition with minimal repairs needed. It offers a good investment opportunity with potential for value increase through cosmetic updates.
Value-add opportunities
- Both Paint exterior siding — Enhances curb appeal and value
- Resale Replace countertops and backsplash in kitchen — Improves kitchen functionality and aesthetics
- Resale Install new flooring in bathrooms — Enhances bathroom aesthetics and value
Renovation cost estimate screening
Value-add ROI direction
- Both Paint exterior siding — Enhances curb appeal and value ↑
- Resale Replace countertops and backsplash in kitchen — Improves kitchen functionality and aesthetics ↑
- Resale Install new flooring in bathrooms — Enhances bathroom aesthetics and value ↑
ⓘ Cost ranges are severity-bucket heuristics (US national rule-of-thumb). Get contractor quotes + a written scope before underwriting a rehab budget.
Schools (NCES district)
- District
- Palm Springs Unified
- NCES district ID
- 0629550
- Math proficiency
- 21% ▼ -7.00%
- Reading proficiency
- 42% ▬ 0.00%
- Median HH income
- $43,638
- Composite
- 26.76/100
- National rank
- #7131
- State rank
- #328 of 517 in CA
Livability — Desert Edge
- Score
- 68/100
- State rank
- #297
- US rank
- #9953
Category grades
Schools grade is shown separately in the Schools card above.
Census & demographics
- Census place
- Desert Edge, CA
- Population (ZIP)
- 8,624
Population outlook (Riverside County) Hauer SSP2
- Today (2025)
- 2,664,475 people
- By 2030
- 2,802,692 · +5.2%
- By 2040
- 3,050,904 · +14.5%
- By 2050
- 3,256,783 · +22.2%
- By 2075
- 3,655,058 · +37.2%
- By 2100
- 3,766,594 · +41.4%
Race, ethnicity, and origin ACS 2023
- Race & ethnicity
- White 50% Hispanic / Latino 46% Two or more races 16% Asian 2% Native American 1%
- Hispanic origin (detail)
- Mexican 36%
- Common ancestry
- Lithuanian 3% Slovak 2% Portuguese 2%
- Foreign-born
- 28% · Canada, South Korea
- Languages at home
- 57% English-only · Spanish 38% Chinese 1% Russian/Polish/Slavic 1%
Political lean MEDSL · Riverside
- 2024 margin
- Toss-up / Even · D 48.0% · R 49.3% · Other 2.6%
- 2008→2024 swing
- -3.6pp toward R · 2008: 2.3pp · 2024: -1.3pp
- All cycles
- 2024: R+1.3 2020: D+8.0 2016: D+4.3 2012: R+0.4 2008: D+2.3
Not yet ingested
- Civics
- —
Market trends
- HPI YoY
- ▼ -118.23%
- Current HPI
- 400.5663
- Rent YoY
- —
- Metro
- —
- State GDP YoY
- ▲ 3.21%
- F500 in state
- 116
Industry mix (Fortune 500 HQ in CA)
| Industry | F500 HQs | Revenue |
|---|---|---|
| Technology | 27 | $1,492B |
|
||
| Financial Services | 3 | $174B |
|
||
| Retail | 3 | $44B |
|
||
| Insurance | 3 | $26B |
|
||
| Media / Entertainment | 2 | $115B |
|
||
| Pharmaceuticals / Biotech | 2 | $62B |
|
||
Price history
-18.2% since first listed2 events — show timeline
- 2026-05-16 Price Changed $45,000 GPSMLS
- 2026-02-12 Listed $55,000 GPSMLS
Cash-flow waterfall
monthlySold comps — $/sqft
last 12 mo · ≤1 miLoading sold comps…