131 Hollister Dr Unit Hollister Heights · Salem, PA
Flood risk 7/10 · Major
- FEMA flood zone
- X (unshaded)
- Chance of flooding over 30 yrs
- 0.59%
- Est. flood insurance / yr
- $507 – $1,088
Fire risk 1/10 · Minimal
- Est. fire insurance / yr
- $511 – $949
Heat risk 2/10 · Minimal
- Hot days now (above 90°F)
- 7 days/yr
- Hot days in 30 yrs
- 16 days/yr
Wind risk 3/10 · Minor
- Chance of severe wind over 30 yrs
- 4.0%
Air-quality risk 2/10 · Minimal
- Unhealthy air days now
- 1 days/yr
- Unhealthy air days in 30 yrs
- 2 days/yr
Risk factors via First Street. Map © Google.
Why this score? — see what drove the C grade
The composite is a weighted blend of 9 inputs, each scored 0–100. Each bar is that input's sub-score; the figure is the points it added to the 100-point composite (weight × sub-score).
- Cash flow +16.4/30.0
- 1% rule +10.0/10.0
- Appreciation +10.0/10.0
- ARV discount +5.3/15.0
- DSCR +5.1/10.0
- Schools +4.4/10.0
- Rent growth +2.5/5.0
- Livability +2.5/5.0
- Condition / age +2.5/5.0
$125,000
🖨 Deal sheet 📄 Offer letter ✓ Due diligence
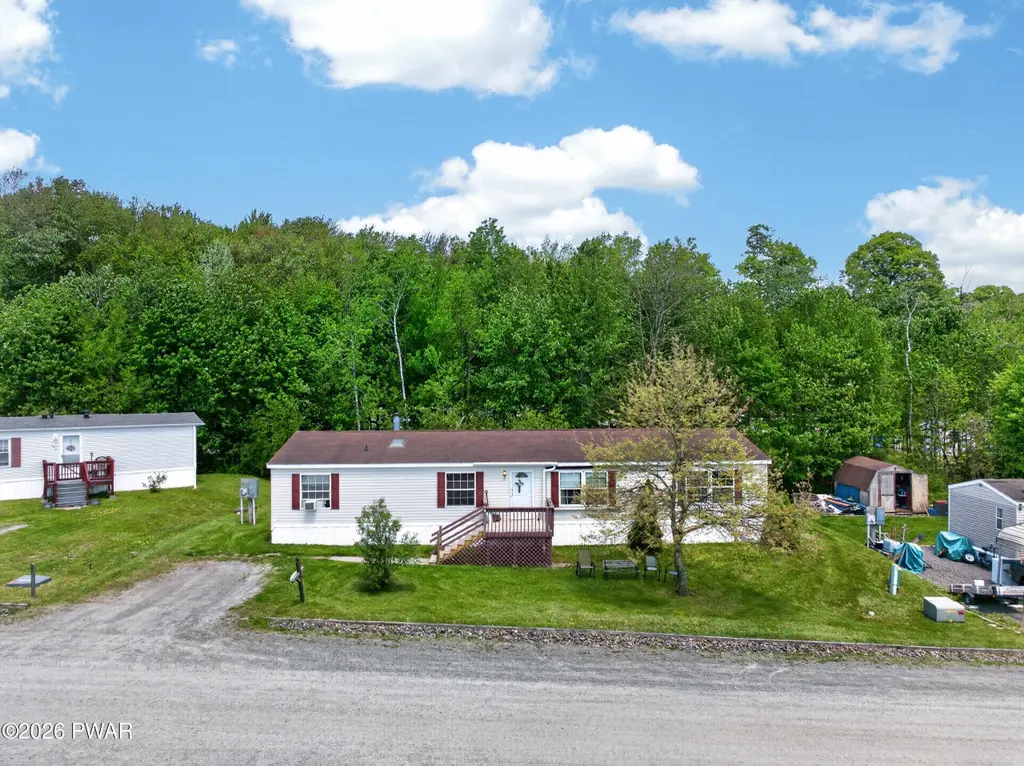
Listing remarks
Charming and well-maintained home conveniently located right at the front of the community in the desirable North Pocono area! This inviting property features a comfortable layout with spacious living areas and a cozy wood-burning stove with electric insert, perfect for added warmth and ambiance year-round. Enjoy relaxing or entertaining on the front and rear decks while taking in the peaceful surroundings. The home's prime location offers easy access in and out of the community and is just minutes from local amenities, schools, and commuter routes. Situated on a leased lot, this property provides an affordable opportunity for comfortable living in a scenic setting
Key facts
- Easy access
- Front and rear decks
- Scenic setting
Tags
Property features AI
Finance
- HOA & community: Homeowners association with monthly fee of $600; HOA covers water, sewer, trash, and snow removal; Association amenities include snow removal and trash
Exterior
- Parking: Driveway; Unpaved parking; Off-street parking
- Security: Carbon monoxide detectors; Fire alarm
- Utilities: Circuit breaker electric panel; Water connected; Sewer connected (private sewer); Electricity connected; Cable available; Phone available
- Home design: Manufactured double-wide home; Single-story; Property is attached; Single-family use; No common walls
- Construction: Vinyl siding; Asphalt shingle roof; Block foundation; Built above grade finished area: 1,728
- Exterior features: Private entrance; Private yard; Rain gutters; Front porch; Rear porch; Sliding doors; Back yard; Front yard; Level, cleared lot; Has view
Interior
- Kitchen: Free‑standing electric range and oven; Free‑standing refrigerator; ENERGY STAR qualified refrigerator; ENERGY STAR qualified freezer; ENERGY STAR qualified dishwasher
- Bedrooms: Total rooms: 8
- Flooring: Carpet; Laminate
- Bathrooms: 2 full bathrooms
- Heating & cooling: Baseboard heating (electric); Ceiling fan cooling
- Interior features: Ceiling fans; Soaking tub; Vaulted ceilings; His and hers closets; Skylights; Electric and wood-burning fireplace (1)
- Laundry & utility: Washer and dryer; Electric dryer hookup; Washer hookup; Laundry room on main level; Electric water heater; Water heater
Neighborhood map
What this means for you Summary
Snapshot
- This is a 3-bed/2.0-bath manufactured listed at $125k.
Deal economics
- At list price, monthly cash flow is $5 ($57/yr) — positive.
- The deal already cash-flows at list — no discount required.
- Meets the 1% rule at list price ($2k rent vs $125k).
- Recommended offer: $123k (1.5% below list) — sets the bar for market timing.
Location & tenants
- Location reads: area grade C — affects rentability + tenant quality, not the cash-flow math above.
- Western Wayne SD (rural): math 39% / reading 63% proficiency, ranked #165 of 539 in PA (top 31%) — acceptable for families but not a draw, mixed tenant base, ~2y average lease.
- Market conditions: 95 active listings in the ZIP; 177 units permitted in Wayne County in 2024 (0 in 5+ unit buildings).
Forward outlook
- In year one you build about $13k of equity ($864 loan paydown + $12k appreciation (10.0% local appreciation)).
- Wayne County population projected at -17% by 2050 — secular population decline; favor cash flow + early exit over multi-decade hold.
- At projected returns (10.0% appreciation + 3.0% rent growth), your $35k cash investment doubles in ~3 years — after that, you're playing with house money.
- By year 3, paydown + projected appreciation supports a ~$34k cash-out refi (75% LTV) — recoverable capital for the next deal without selling this one.
Negotiation context
- It's been on market 22 days — a 2% lower offer ($123k) is reasonable based on typical stale-listing flexibility.
- 2 sale attempts since 12y ago with the ask held roughly flat each time — persistent listings suggest the price (not the market) is what's stuck; bring a comps-based counter.
Risks & watch-outs
- Watch-outs: flood insurance adds $66/mo; HOA is 32% of rent.
- Climate carrying-cost: major flood risk — expect insurance premiums to compound above CPI over the hold.
Questions for the listing agent
- What's the actual annual flood-insurance premium (NFIP or private), and is the property in a SFHA with mandatory coverage?
- What does the HOA fee cover, when was the last increase, and are there any pending special assessments or reserve-fund shortfalls?
- Is there a deadline driving the sale (1031 exchange, divorce, estate, relocation)? That informs how much negotiation room exists.
- What's the average days-on-market for RENTAL listings here right now (not sales)? A rising rental-DOM trend means longer vacancies and softer asking-rent achievability than the comps imply.
- What's the recent tenant-quality profile in this submarket — average credit score on applications, eviction rate, late-payment / NSF rate, and stable-employment percentage? A property-management company in the area should have these aggregated.
- How much new for-sale + rental construction is in the pipeline within 1–3 miles? Heavy new supply typically softens prices + rents 12–24 months out; constrained supply supports both.
Investment metrics
- 1% rule
- 1.51% ✓
- Cap rate
- 6.98%
- Cash-on-cash
- 2.44%
- DSCR
- 1.11
- GRM
- 5.5
CMA / ARV
- ARV (on-the-fly)
- $119,232
- Comps found
- 1
Show comp detail 1 sale within ~0.75 mi
| Address | Dist | Beds/Ba | Sqft | Sold | Price | $/sf | Match |
|---|---|---|---|---|---|---|---|
| 141 Hollister Dr | 0.02mi | 3/2.0 | 1,586 (-8%) | 2mo | $109,000 | $69 | 84 |
Match score weights: distance 35% · size 25% · config 20% · recency 20%. Top-matched comps best support the ARV.
Projected returns pro-forma
10.0% appreciation · 3.0% rent growth · sell at horizon
- IRR
- 24.5%
- Equity multiple
- 2.97×
- Total profit
- $68,792
- Equity at exit
- $112,610
- IRR
- 21.8%
- Equity multiple
- 6.80×
- Total profit
- $203,161
- Equity at exit
- $242,848
Cash invested: $35,000 (down + closing). Projections, not guarantees.
Landlord ↔ Tenant lean methodology
- Overall (STATE)
- 62 Landlord-Friendly
- State Pennsylvania
- 62 Landlord-Friendly · EVEN
- County
- — inherits STATE
- City
- — inherits STATE
ZIP-level market 18444
- Home prices YoY
- 24.9%
- Active inventory
- 95
- Price-to-rent
- 5.5×
Monthly cashflow live
- Estimated rent
- $1,887 medium interval (Pro) →
- Mortgage (P&I)
- −$656
- Tax from tax record
- −$112 /mo · $1,345/yr
- Insurance
- −$52
- Flood insurance flood zone
- −$66 /mo · $798/yr
- HOA
- −$600
- Vacancy / Maint / Mgmt
- −$396
- Net cashflow
- $5
Break-even live
UW: 25.0% down · 7.5% · 30yr · 1.5% tax · 5.0% vac · 8.0% maint · 8.0% mgmt
Financing live
Cash to close
- Down payment
- $31,250
- Closing costs
- $3,750
- Reserves months
- —
- Total cash needed
- —
Loan-product check · same deal, 3 products live
Conventional
25% down · 7.5% · 30yr
- Down + closing
- —
- Monthly P&I
- —
- Monthly cashflow
- —
- DSCR
- —
- Eligible?
- —
Personal DTI + credit; lowest rate.
DSCR
20% down · 8.5% · 30yr
- Down + closing
- —
- Monthly P&I
- —
- Monthly cashflow
- —
- DSCR
- —
- Eligible?
- —
No personal income docs; deal must DSCR.
Hard money
10% down · 12.0% · 12mo
- Down + closing
- —
- Monthly P&I
- —
- Monthly cashflow
- —
- DSCR
- —
- Eligible?
- —
Short-term bridge; refi at stabilization.
HOA detail
- Monthly dues
- $600 · $7,200/yr
- Likely covers
- electric
Listing history 17 events
-
2026-06-18days on market $125,000 Active 22 DOM
-
2026-06-17days on market $125,000 Active 21 DOM
-
2026-06-16days on market $125,000 Active 20 DOM
-
2026-06-15days on market $125,000 Active 19 DOM
-
2026-06-14days on market $125,000 Active 17 DOM
-
2026-06-13days on market $125,000 Active 16 DOM
-
2026-06-10days on market $125,000 Active 14 DOM
-
2026-06-09days on market $125,000 Active 13 DOM
-
2026-06-08days on market $125,000 Active 12 DOM
-
2026-06-07days on market $125,000 Active 11 DOM
-
2026-06-03days on market $125,000 Active 7 DOM
-
2026-06-02days on market $125,000 Active 6 DOM
-
2026-06-01days on market $125,000 Active 5 DOM
-
2026-05-31days on market $125,000 Active 4 DOM
-
2026-05-30days on market $125,000 Active 3 DOM
-
2026-05-19$125,000 Active
-
2014-11-01$63,000
ⓘ Source: listings_history table (triggers on properties + properties_extension) + one-shot
backfill from property_details.listing_events for pre-trigger history.
Tax reassessment forecast PA · Partial reset (capped growth)
- Current annual tax
- $1,345 · $112/mo
- Projected year-2 tax
- $1,660 · $138/mo
- Expected delta
- +$315/yr (+$26/mo · 23.4%)
ⓘ Screening estimate from a state-policy table — verify with the county assessor before closing.
Climate risk First Street
- Flood 7/10 Severe FEMA zone X (unshaded) · 59% chance over 30 yrs
- Wildfire 1/10 Low
- Heat 2/10 Low 7 d/yr ≥90°F today · 16 d/yr by 30 yrs out
- Wind 3/10 Moderate 4% chance of damaging wind over 30 yrs
- Air quality 2/10 Low 1 unhealthy d/yr today · 2 by 30 yrs out
Nearby sold comps map
Loading sold comps map…
Walkable amenities ~0.75 mi
Loading nearby amenities…
Taxation est. · year 1
- Rental income
- $22,647
- − Mortgage interest
- −$7,002
- − Property taxes
- −$1,345
- − Insurance
- −$1,422
- − Repairs & maintenance
- −$1,812
- − Management
- −$1,812
- − HOA
- −$7,200
- − Depreciation
- −$3,636
- Taxable loss
- −$1,583
- Est. tax savings @ 24.0%
- +$380
- After-tax cash flow
- $437/yr
For passive investors: Depreciation is non-cash, so a rental often shows a tax loss while cash-flowing — sheltering income. Rental losses are passive: they offset passive income freely, and up to $25,000/yr can offset ordinary (W-2) income if you actively participate and your MAGI is under $100k (phasing out to $0 by $150k); unused losses carry forward. On sale, claimed depreciation is recaptured at up to 25%, and gains may owe capital-gains tax (a 1031 exchange can defer both). Figures are a year-1 estimate at your 24.0% rate — not tax advice; consult a CPA.
Schools (NCES district)
- District
- Western Wayne SD
- NCES district ID
- 4226070
- Math proficiency
- 39% ▼ -12.00%
- Reading proficiency
- 63% ▼ -6.00%
- Median HH income
- $51,358
- Composite
- 43.65/100
- National rank
- #2964
- State rank
- #165 of 539 in PA
Livability — Salem
No livability data for this city. (Only ~50 U.S. cities are tracked.)
Census & demographics
- Population (ZIP)
- 13,681
Population outlook (Wayne County) Hauer SSP2
- Today (2025)
- 47,924 people
- By 2030
- 46,191 · -3.6%
- By 2040
- 42,815 · -10.7%
- By 2050
- 39,873 · -16.8%
- By 2075
- 34,556 · -27.9%
- By 2100
- 28,358 · -40.8%
Race, ethnicity, and origin ACS 2023
- Neighborhood character
- Predominantly White (91%)
- Race & ethnicity
- White 91% Two or more races 6% Hispanic / Latino 3%
- Common ancestry
- Romanian 16% Scotch-Irish 4% Slovak 2%
- Foreign-born
- 1% · Canada, South Korea
- Languages at home
- 97% English-only · Spanish 2% Russian/Polish/Slavic 1%
Political lean MEDSL · Wayne
- 2024 margin
- Solid R (+37.1) · D 31.1% · R 68.2%
- 2008→2024 swing
- -24.8pp toward R · 2008: -12.3pp · 2024: -37.1pp
- All cycles
- 2024: R+37.1 2020: R+33.6 2016: R+39.7 2012: R+20.9 2008: R+12.3
Not yet ingested
- Civics
- —
Market trends
- HPI YoY
- ▲ 85.51%
- Current HPI
- 428.8661
- Rent YoY
- —
- Metro
- —
- State GDP YoY
- ▲ 1.68%
- F500 in state
- 34
Industry mix (Fortune 500 HQ in PA)
| Industry | F500 HQs | Revenue |
|---|---|---|
| Healthcare | 2 | $309B |
|
||
| Insurance | 2 | $27B |
|
||
| Telecommunications / Media | 1 | $124B |
|
||
| Industrial Distribution | 1 | $22B |
|
||
| Financial Services | 1 | $20B |
|
||
| Chemicals / Materials | 1 | $18B |
|
||
Price history
+98.4% since first listed2 events — show timeline
- 2026-05-19 Listed $125,000 PWMLS
- 2014-11-01 Listed $63,000 GSBR as distributed by MLS GRID
Property tax history
+0.0%/yrLatest (2026): $1,345 · +3.1% YoY. Source: county tax records.
Cash-flow waterfall
monthlySold comps — $/sqft
last 12 mo · ≤1 miLoading sold comps…