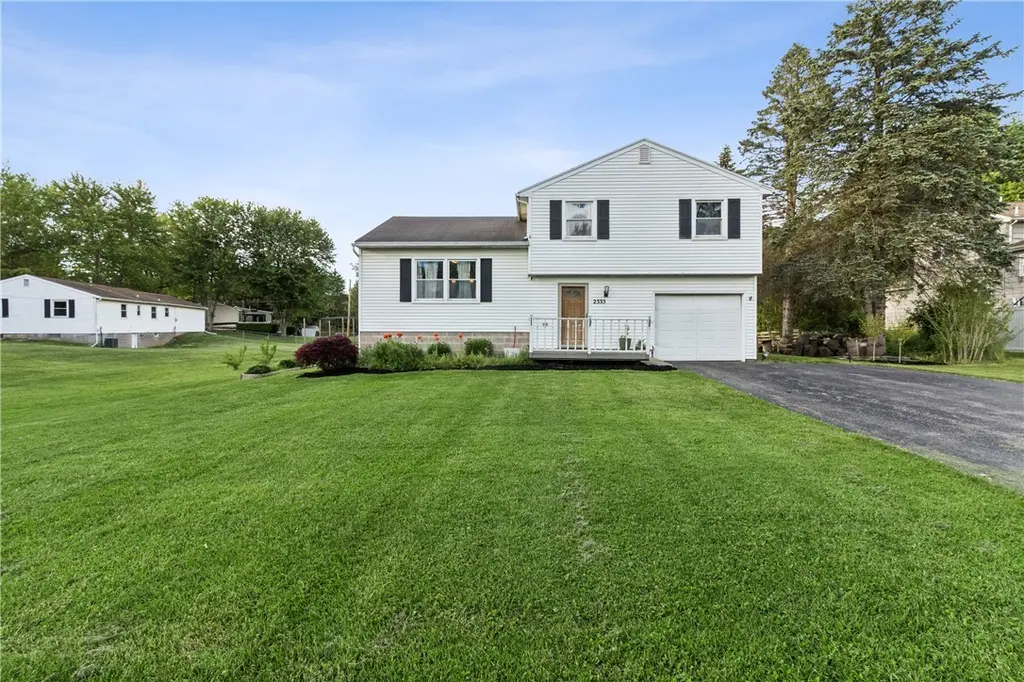
2333 Cornwall Dr · Gananda, NY
Flood risk No data
- FEMA flood zone
- —
- Chance of flooding over 30 yrs
- —
- Est. flood insurance / yr
- —
Fire risk No data
- Est. fire insurance / yr
- —
Heat risk No data
- Hot days now (above threshold)
- —
- Hot days in 30 yrs
- —
Wind risk No data
- Chance of severe wind over 30 yrs
- —
Air-quality risk No data
- Unhealthy air days now
- —
- Unhealthy air days in 30 yrs
- —
Risk factors via First Street. Map © Google.
Why this score? — see what drove the D+ grade
The composite is a weighted blend of 9 inputs, each scored 0–100. Each bar is that input's sub-score; the figure is the points it added to the 100-point composite (weight × sub-score).
- Cash flow +21.8/30.0
- 1% rule +7.1/10.0
- DSCR +7.0/10.0
- Schools +4.0/10.0
- Rent growth +2.5/5.0
- Livability +2.5/5.0
- Condition / age +2.5/5.0
- ARV discount +0.0/15.0
- Appreciation +0.0/10.0
$179,900
🖨 Deal sheet 📄 Offer letter ✓ Due diligence
Listing remarks MLS
1st OPEN HOUSE SUNDAY JULY 23RD 1-3 PM! charming four-level split loaded with upgrades and charm! Immaculate throughout, this home offers a lovely winter white custom kitchen with center island, stainless steel appliances and black granite countertops. Wide plank woodgrain laminate flooring and cermaic tile flooring in the one and one half baths. Vinyl clad thermopane windows, a spacious family room and sliding glass door to the privacy rear deck area. Updated forced air gas heating. Central air and new electrical service Located minutes from Walmart and Lowes this home is minutes to the expressway. Delayed showings as of July 23rd and offers being presented July 26th at 6pm.
Key facts
- Laminate flooring
- Rustic island
- Fresh landscaping
Tags
Property features AI
Finance
- Other: Basement: full basement with sump pump; Total rooms: 8; Below-grade finished area included (312); Lot: irregular residential lot on a city street, dimensions approximately 101 x 204, about 0.45 acres
Exterior
- Parking: Attached garage with 1 parking space; Underground parking access; Garage door opener; Electricity to garage
- Utilities: Public water connected; Septic tank sewer; Water connected
- Home design: Single-story home; Entry level at grade; Resale property
- Construction: Vinyl siding; Asphalt shingle roof; Block foundation; Built as existing (year built details listed as existing)
- Exterior features: Blacktop driveway; Deck
Interior
- Kitchen: Granite counters; Electric oven; Electric range; Microwave; Dishwasher; Refrigerator
- Bedrooms: Includes bedroom(s) (see room count)
- Flooring: Ceramic tile; Laminate; Varies
- Bathrooms: 1 full bathroom; 1 half bathroom; One main-level bathroom
- Heating & cooling: Gas forced-air heating; Central air conditioning
- Interior features: Ceiling fans; Separate/formal living room; Granite counters; Sliding glass doors; Programmable thermostat; Thermal windows; Sliding doors
- Laundry & utility: Washer and dryer included; Laundry located in basement; Gas water heater
Neighborhood map
What this means for you Summary
Snapshot
- This is a 3-bed/1.5-bath single-family listed at $180k.
Deal economics
- At list price, monthly cash flow is $278 ($3k/yr) — positive.
- The deal already cash-flows at list — no discount required.
- Meets the 1% rule at list price ($2k rent vs $180k).
- Cap rate 8.2% vs local median 3.2% in Gananda — top-decile yield for the area; either an underpriced asset or a hidden risk that comps aren't pricing in. Stress-test before assuming the spread holds.
Location & tenants
- Location reads: area grade D — affects rentability + tenant quality, not the cash-flow math above.
- Palmyra-Macedon Central School District (town): math 41% / reading 51% proficiency, ranked #443 of 590 in NY (top 75%) — families likely to look elsewhere, expect single-tenant / working-renter base with shorter leases.
- Market conditions: 49 active listings in the ZIP; 259 units permitted in Wayne County in 2024 (90 in 5+ unit buildings).
Forward outlook
- Local home prices are declining (-3.0%/yr); year-one equity from $1k of loan paydown is wiped out by about $5k of value loss. Plan a longer hold.
- Wayne County population projected at -24% by 2050 — secular population decline; favor cash flow + early exit over multi-decade hold.
Negotiation context
- Only 10 days on market — expect competitive offers; lowballing is unlikely to land.
- 4 sale attempts since 16y ago; this cycle's ask has dropped $20k (10%) from the opening price — seller is motivated, your offer sets the floor, not the list.
Risks & watch-outs
- Watch-outs: property tax is 2.8% of price.
Questions for the listing agent
- Built in 1973 — when were the roof, HVAC, electrical panel, plumbing, and water heater last replaced?
- Property tax is high relative to price — has the assessment been appealed recently, and will the sale trigger a re-assessment?
- Is there a deadline driving the sale (1031 exchange, divorce, estate, relocation)? That informs how much negotiation room exists.
- The area grade is low — what's the realistic commute time and amenity access for the typical tenant pool here? Any planned neighborhood developments (good or bad) we should know about?
- What's the average days-on-market for RENTAL listings here right now (not sales)? A rising rental-DOM trend means longer vacancies and softer asking-rent achievability than the comps imply.
- What's the recent tenant-quality profile in this submarket — average credit score on applications, eviction rate, late-payment / NSF rate, and stable-employment percentage? A property-management company in the area should have these aggregated.
- How much new for-sale + rental construction is in the pipeline within 1–3 miles? Heavy new supply typically softens prices + rents 12–24 months out; constrained supply supports both.
Investment metrics
- 1% rule
- 1.21% ✓
- Cap rate
- 8.15%
- Cash-on-cash
- 6.63%
- DSCR
- 1.30
- GRM
- 6.9
CMA / ARV
- ARV (on-the-fly)
- $136,552
- Comps found
- 1
Show comp detail 1 sale within ~0.75 mi
| Address | Dist | Beds/Ba | Sqft | Sold | Price | $/sf | Match |
|---|---|---|---|---|---|---|---|
| 580 Quaker Rd | 0.33mi | 3/1.0 | 1,532 (+13%) | 18mo | $155,000 | $101 | 45 |
Match score weights: distance 35% · size 25% · config 20% · recency 20%. Top-matched comps best support the ARV.
Projected returns pro-forma
-3.0% appreciation · 3.0% rent growth · sell at horizon
- IRR
- -6.0%
- Equity multiple
- 0.78×
- Total profit
- $-11,266
- Equity at exit
- $26,824
- IRR
- 3.7%
- Equity multiple
- 1.27×
- Total profit
- $13,646
- Equity at exit
- $15,554
Cash invested: $50,372 (down + closing). Projections, not guarantees.
Landlord ↔ Tenant lean methodology
- Overall (STATE)
- 15 Strongly Tenant-Friendly
- State New York
- 15 Strongly Tenant-Friendly · D+10
- County
- — inherits STATE
- City
- — inherits STATE
ZIP-level market 14502
- Home prices YoY
- -26.0%
- Active inventory
- 49
- Price-to-rent
- 6.9×
Monthly cashflow live
- Estimated rent
- $2,174 medium interval (Pro) →
- Mortgage (P&I)
- −$943
- Tax from tax record
- −$421 /mo · $5,052/yr
- Insurance
- −$75
- HOA
- −$0
- Vacancy / Maint / Mgmt
- −$457
- Net cashflow
- $278
Break-even live
UW: 25.0% down · 7.5% · 30yr · 1.5% tax · 5.0% vac · 8.0% maint · 8.0% mgmt
Financing live
Cash to close
- Down payment
- $44,975
- Closing costs
- $5,397
- Reserves months
- —
- Total cash needed
- —
Loan-product check · same deal, 3 products live
Conventional
25% down · 7.5% · 30yr
- Down + closing
- —
- Monthly P&I
- —
- Monthly cashflow
- —
- DSCR
- —
- Eligible?
- —
Personal DTI + credit; lowest rate.
DSCR
20% down · 8.5% · 30yr
- Down + closing
- —
- Monthly P&I
- —
- Monthly cashflow
- —
- DSCR
- —
- Eligible?
- —
No personal income docs; deal must DSCR.
Hard money
10% down · 12.0% · 12mo
- Down + closing
- —
- Monthly P&I
- —
- Monthly cashflow
- —
- DSCR
- —
- Eligible?
- —
Short-term bridge; refi at stabilization.
Listing history 7 events
-
2026-06-09statusdays on market $179,900 Pending 10 DOM
-
2026-06-07days on market $179,900 Active 9 DOM
-
2026-06-05days on market $179,900 Active 6 DOM
-
2026-06-03days on market $179,900 Active 5 DOM
-
2026-06-03days on market $179,900 Active 4 DOM
-
2026-06-01days on market $179,900 Active 3 DOM
-
2026-05-31days on market $179,900 Active 2 DOM
ⓘ Source: listings_history table (triggers on properties + properties_extension) + one-shot
backfill from property_details.listing_events for pre-trigger history.
Tax reassessment forecast NY · Partial reset (capped growth)
- Current annual tax
- $5,052 · $421/mo
- Projected year-2 tax
- $5,052 · $421/mo
- Expected delta
- $0/yr ($0/mo · 0.0%)
ⓘ Screening estimate from a state-policy table — verify with the county assessor before closing.
Nearby sold comps map
Loading sold comps map…
Walkable amenities ~0.75 mi
Loading nearby amenities…
Taxation est. · year 1
- Rental income
- $26,094
- − Mortgage interest
- −$10,077
- − Property taxes
- −$5,052
- − Insurance
- −$900
- − Repairs & maintenance
- −$2,087
- − Management
- −$2,087
- − Depreciation
- −$5,233
- Taxable income
- $656
- Est. tax owed @ 24.0%
- −$157
- After-tax cash flow
- $3,183/yr
For passive investors: Depreciation is non-cash, so a rental often shows a tax loss while cash-flowing — sheltering income. Rental losses are passive: they offset passive income freely, and up to $25,000/yr can offset ordinary (W-2) income if you actively participate and your MAGI is under $100k (phasing out to $0 by $150k); unused losses carry forward. On sale, claimed depreciation is recaptured at up to 25%, and gains may owe capital-gains tax (a 1031 exchange can defer both). Figures are a year-1 estimate at your 24.0% rate — not tax advice; consult a CPA.
Schools (NCES district)
- District
- Palmyra-Macedon Central School District
- NCES district ID
- 3622380
- Math proficiency
- 41% ▼ -5.00%
- Reading proficiency
- 51% ▲ 10.00%
- Median HH income
- $52,190
- Composite
- 39.65/100
- National rank
- #3915
- State rank
- #443 of 590 in NY
Livability — Gananda
No livability data for this city. (Only ~50 U.S. cities are tracked.)
Census & demographics
- Population (ZIP)
- 10,515
Population outlook (Wayne County) Hauer SSP2
- Today (2025)
- 85,662 people
- By 2030
- 81,945 · -4.3%
- By 2040
- 73,735 · -13.9%
- By 2050
- 65,029 · -24.1%
- By 2075
- 47,451 · -44.6%
- By 2100
- 31,574 · -63.1%
Race, ethnicity, and origin ACS 2023
- Neighborhood character
- Predominantly White (88%)
- Race & ethnicity
- White 88% Two or more races 6% Asian 3% Black 1% Hispanic / Latino 1%
- Common ancestry
- Iranian 8% Romanian 7% Lithuanian 3%
- Foreign-born
- 4% · China, South Korea
- Languages at home
- 94% English-only · Russian/Polish/Slavic 2% Other Indo-European 2% Chinese 1%
Political lean MEDSL · Wayne
- 2024 margin
- Strong R (+23.1) · D 38.5% · R 61.5%
- 2008→2024 swing
- -13.2pp toward R · 2008: -9.9pp · 2024: -23.1pp
- All cycles
- 2024: R+23.1 2020: R+19.6 2016: R+26.1 2012: R+9.3 2008: R+9.9
Not yet ingested
- Civics
- —
Market trends
- HPI YoY
- ▼ -85.25%
- Current HPI
- 242.5682
- Rent YoY
- —
- Metro
- —
- State GDP YoY
- ▲ 2.60%
- F500 in state
- 92
Industry mix (Fortune 500 HQ in NY)
| Industry | F500 HQs | Revenue |
|---|---|---|
| Financial Services | 10 | $950B |
|
||
| Consumer Goods | 9 | $162B |
|
||
| Insurance | 4 | $225B |
|
||
| Telecommunications | 2 | $144B |
|
||
| Pharmaceuticals | 2 | $112B |
|
||
| Media / Entertainment | 2 | $69B |
|
||
Price history
+56.4% since first listed17 events — show timeline
- 2026-05-29 Price Changed $179,900 UNYREIS
- 2026-05-29 Listed $199,900 UNYREIS
- 2022-08-31 Sold (Public Records) $189,900 Public Records
- 2022-08-24 Pending — UNYREIS
- 2022-08-19 Sold (MLS) $179,900 UNYREIS
- 2022-07-28 Pending — UNYREIS
- 2022-07-27 Price Changed $189,900 UNYREIS
- 2022-07-21 Listed $194,900 UNYREIS
- 2021-03-31 Sold (Public Records) $171,000 Public Records
- 2021-03-30 Sold (MLS) $171,000 UNYREIS
- 2021-03-22 Pending — UNYREIS
- 2021-02-16 Pending — UNYREIS
- 2021-02-11 Listed $159,000 UNYREIS
- 2010-07-30 Sold (Public Records) $116,500 Public Records
- 2010-07-28 Sold (MLS) $116,500 UNYREIS
- 2010-04-07 Listed $119,900 UNYREIS
- 2003-11-24 Sold (Public Records) $115,000 Public Records
Property tax history
+3.4%/yrLatest (2025): $5,052 · +2.0% YoY. Source: county tax records.
Cash-flow waterfall
monthlySold comps — $/sqft
last 12 mo · ≤1 miLoading sold comps…