13409 Noble Garnet Ln · Ruskin, FL
Flood risk No data
- FEMA flood zone
- —
- Chance of flooding over 30 yrs
- —
- Est. flood insurance / yr
- —
Fire risk No data
- Est. fire insurance / yr
- —
Heat risk No data
- Hot days now (above threshold)
- —
- Hot days in 30 yrs
- —
Wind risk No data
- Chance of severe wind over 30 yrs
- —
Air-quality risk No data
- Unhealthy air days now
- —
- Unhealthy air days in 30 yrs
- —
Risk factors via First Street. Map © Google.
Why this score? — see what drove the B- grade
The composite is a weighted blend of 9 inputs, each scored 0–100. Each bar is that input's sub-score; the figure is the points it added to the 100-point composite (weight × sub-score).
- Cash flow +24.8/30.0
- ARV discount +11.9/15.0
- DSCR +8.0/10.0
- 1% rule +6.4/10.0
- Schools +4.4/10.0
- Condition / age +4.0/5.0
- Livability +3.6/5.0
- Rent growth +2.3/5.0
- Appreciation +0.0/10.0
$246,240
🖨 Deal sheet 📄 Offer letter ✓ Due diligence
Listing remarks
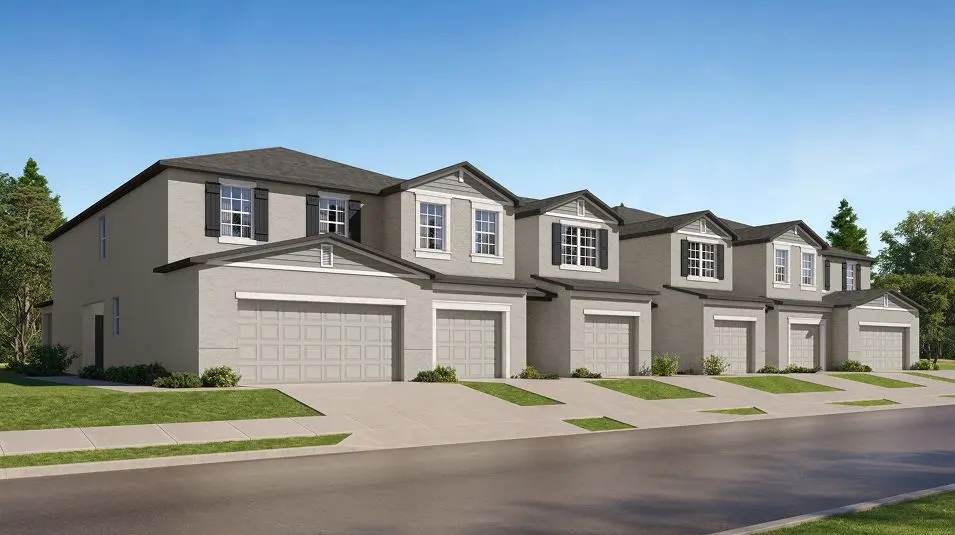
This two-story townhome has plenty of shared living and entertaining spaces. The first floor showcases an open layout that flows from the kitchen to the dining room and family room and out to a covered porch. Upstairs is a central loft, surrounded by all three bedrooms including the owner's suite with private bathroom and walk-in closet.
Key facts
- Covered porch
- Central loft
- Walk-in closet
Tags
Property features AI
Finance
- Financial info: List price $235,740
Exterior
- Parking: 1 garage space (1 total parking space)
- Home design: Single-family home (Bimini plan); Active listing
- Exterior features: Address: 13409 Noble Garnet Ln, Parrish, FL 34219
Interior
- Bedrooms: 3 bedrooms
- Bathrooms: 2 full bathrooms and 1 half bathroom (2.5 total)
- Interior features: Spec home (Bimini plan); Living area approximately 1993
Neighborhood map
What this means for you Summary
Snapshot
- This is a 3-bed/2.5-bath townhouse listed at $246k. Condition is rated good.
Deal economics
- At list price, monthly cash flow is $519 ($6k/yr) — positive.
- The deal already cash-flows at list — no discount required.
- Meets the 1% rule at list price ($3k rent vs $246k).
- Recommended offer: $243k (1.5% below list) — sets the bar for market timing.
- Cap rate 8.8% vs local median 4.7% in Ruskin — top-decile yield for the area; either an underpriced asset or a hidden risk that comps aren't pricing in. Stress-test before assuming the spread holds.
Location & tenants
- Location reads 71/100 on livability (#392 in FL) — a middle-class / working-renter tenant base. Strengths: cost of living A+, housing A+, commute B+; Watch: schools F, amenities F, health & safety F.
- Manatee (suburban): math 54% / reading 50% proficiency, ranked #26 of 73 in FL (top 36%) — acceptable for families but not a draw, mixed tenant base, ~2y average lease.
- Market conditions: Rents soft (-0.9%/yr); 2170 active listings in the ZIP; 3 comparable units currently listed for rent nearby; rentals leasing fast (median 4d on market — plan ~1-2 weeks tenant-placement turnaround); high-income renter base; 7,472 units permitted in Manatee County in 2024 (1,782 in 5+ unit buildings).
Forward outlook
- Local home prices are declining (-3.0%/yr); year-one equity from $2k of loan paydown is wiped out by about $7k of value loss. Plan a longer hold.
- Manatee County population projected at +43% by 2050 — long-run rental-demand tailwind backs the buy-and-hold thesis.
Negotiation context
- It's been on market 27 days — a 2% lower offer ($243k) is reasonable based on typical stale-listing flexibility.
Questions for the listing agent
- Is there a deadline driving the sale (1031 exchange, divorce, estate, relocation)? That informs how much negotiation room exists.
- Schools are F-rated, which usually means shorter tenancies and higher turnover. Who's the typical renter profile here, and what's been the actual vacancy rate?
- What's the average days-on-market for RENTAL listings here right now (not sales)? A rising rental-DOM trend means longer vacancies and softer asking-rent achievability than the comps imply.
- What's the recent tenant-quality profile in this submarket — average credit score on applications, eviction rate, late-payment / NSF rate, and stable-employment percentage? A property-management company in the area should have these aggregated.
- How much new for-sale + rental construction is in the pipeline within 1–3 miles? Heavy new supply typically softens prices + rents 12–24 months out; constrained supply supports both.
Investment metrics
- 1% rule
- 1.14% ✓
- Cap rate
- 8.82%
- Cash-on-cash
- 9.04%
- DSCR
- 1.40
- GRM
- 7.3
CMA / ARV
- ARV (on-the-fly)
- $273,041
- Comps found
- 12
Show comp detail 12 sales within ~0.75 mi
| Address | Dist | Beds/Ba | Sqft | Sold | Price | $/sf | Match |
|---|---|---|---|---|---|---|---|
| 12751 Crystal Jade Way | 0.10mi | 3/2.5 | 1,993 (0%) | 10mo | $255,540 | $128 | 87 |
| 13518 White Gold Run | 0.11mi | 3/2.5 | 1,993 (0%) | 10mo | $262,340 | $132 | 86 |
| 13575 White Gold Run | 0.15mi | 3/2.5 | 2,002 (+0%) | 7mo | $253,250 | $126 | 86 |
| 13535 White Gold Run | 0.14mi | 3/2.5 | 1,993 (0%) | 10mo | $274,990 | $138 | 85 |
| 13523 White Gold Run | 0.14mi | 3/2.5 | 1,993 (0%) | 11mo | $269,900 | $135 | 84 |
| 12680 Peaceful Peridot Way | 0.07mi | 3/3.0 | 1,747 (-12%) | 1mo | $238,000 | $136 | 73 |
| 12676 Peaceful Peridot Way | 0.08mi | 3/2.5 | 1,714 (-14%) | 3mo | $235,000 | $137 | 71 |
| 12636 Peaceful Peridto Way | 0.10mi | 4/2.5 (+1) | 2,158 (+8%) | 8mo | $325,900 | $151 | 70 |
| 13510 White Gold Run | 0.11mi | 4/2.5 (+1) | 2,162 (+8%) | 10mo | $272,790 | $126 | 68 |
| 12628 Peaceful Peridot Way Unit na | 0.11mi | 3/2.0 | 1,747 (-12%) | 8mo | $241,500 | $138 | 66 |
| 13526 White Gold Run | 0.11mi | 3/2.5 | 1,747 (-12%) | 11mo | $249,900 | $143 | 65 |
| 13204 Stable Pl | 0.50mi | 3/2.5 | 1,704 (-14%) | 7mo | $299,999 | $176 | 47 |
Match score weights: distance 35% · size 25% · config 20% · recency 20%. Top-matched comps best support the ARV.
Projected returns pro-forma
-3.0% appreciation · 0.0% rent growth · sell at horizon
- IRR
- -6.1%
- Equity multiple
- 0.78×
- Total profit
- $-15,025
- Equity at exit
- $36,715
- IRR
- -0.5%
- Equity multiple
- 0.97×
- Total profit
- $-2,166
- Equity at exit
- $21,290
Cash invested: $68,947 (down + closing). Projections, not guarantees.
Landlord ↔ Tenant lean methodology
- Overall (STATE)
- 87 Strongly Landlord-Friendly
- State Florida
- 87 Strongly Landlord-Friendly · R+3
- County
- — inherits STATE
- City
- — inherits STATE
ZIP-level market 34219
- Home prices YoY
- -23.7%
- Rents YoY
- -0.9%
- Active inventory
- 2170
- Price-to-rent
- 7.3×
Monthly cashflow live
- Estimated rent
- $2,811 medium interval (Pro) →
- Mortgage (P&I)
- −$1,291
- Tax est. 1.5%
- −$308 /mo · $3,694/yr
- Insurance
- −$103
- HOA
- −$0
- Vacancy / Maint / Mgmt
- −$590
- Net cashflow
- $519
Break-even live
UW: 25.0% down · 7.5% · 30yr · 1.5% tax · 5.0% vac · 8.0% maint · 8.0% mgmt
Financing live
Cash to close
- Down payment
- $61,560
- Closing costs
- $7,387
- Reserves months
- —
- Total cash needed
- —
Loan-product check · same deal, 3 products live
Conventional
25% down · 7.5% · 30yr
- Down + closing
- —
- Monthly P&I
- —
- Monthly cashflow
- —
- DSCR
- —
- Eligible?
- —
Personal DTI + credit; lowest rate.
DSCR
20% down · 8.5% · 30yr
- Down + closing
- —
- Monthly P&I
- —
- Monthly cashflow
- —
- DSCR
- —
- Eligible?
- —
No personal income docs; deal must DSCR.
Hard money
10% down · 12.0% · 12mo
- Down + closing
- —
- Monthly P&I
- —
- Monthly cashflow
- —
- DSCR
- —
- Eligible?
- —
Short-term bridge; refi at stabilization.
Rent comps 3 comps
| Address | Beds | Baths | Sqft | Rent | $/sqft | DOM | Units | Dist |
|---|---|---|---|---|---|---|---|---|
| 13420 Noble Garnet Ln Parrish, FL | 3.0 | 2.5 | 1767 | $2,250 | $1.27 | 3d | 1 | 0.03mi |
| 12805 Crystal Jade Way Parrish, FL | 4.0 | 2.5 | 2162 | $2,800 | $1.30 | 3d | 1 | 0.08mi |
| 12215 Radiant Gem Trl Parrish, FL | 4.0 | 2.5 | 2584 | $3,000 | $1.16 | 16d | 1 | 0.44mi |
Listing history 9 events
-
2026-06-18days on market $246,240 Active 27 DOM
-
2026-06-18price $246,240 Active 26 DOM
-
2026-06-17days on market $245,240 Active 26 DOM
-
2026-06-16days on market $245,240 Active 25 DOM
-
2026-06-15days on market $245,240 Active 24 DOM
-
2026-06-13days on market $245,240 Active 22 DOM
-
2026-06-13price $245,240 Active 21 DOM
-
2026-06-01days on market $235,740 Active 21 DOM
-
2026-05-31days on market $235,740 Active 20 DOM
ⓘ Source: listings_history table (triggers on properties + properties_extension) + one-shot
backfill from property_details.listing_events for pre-trigger history.
Nearby sold comps map
Loading sold comps map…
Walkable amenities ~0.75 mi
Loading nearby amenities…
Taxation est. · year 1
- Rental income
- $33,736
- − Mortgage interest
- −$13,793
- − Property taxes
- −$3,694
- − Insurance
- −$1,231
- − Repairs & maintenance
- −$2,699
- − Management
- −$2,699
- − Depreciation
- −$7,163
- Taxable income
- $2,457
- Est. tax owed @ 24.0%
- −$590
- After-tax cash flow
- $5,642/yr
For passive investors: Depreciation is non-cash, so a rental often shows a tax loss while cash-flowing — sheltering income. Rental losses are passive: they offset passive income freely, and up to $25,000/yr can offset ordinary (W-2) income if you actively participate and your MAGI is under $100k (phasing out to $0 by $150k); unused losses carry forward. On sale, claimed depreciation is recaptured at up to 25%, and gains may owe capital-gains tax (a 1031 exchange can defer both). Figures are a year-1 estimate at your 24.0% rate — not tax advice; consult a CPA.
Condition & rehab AI · 12 photos
This two-story townhome is in excellent condition with modern finishes and a good layout. It is move-in ready and would benefit from some exterior painting and landscaping to further enhance its curb appeal and value.
Value-add opportunities
- Both Painting exterior siding — Enhances curb appeal and value
- Both Landscaping improvements — Enhances curb appeal and value
- Both Add a smart home system — Improves convenience and energy efficiency
Renovation cost estimate screening
Value-add ROI direction
- Both Painting exterior siding — Enhances curb appeal and value ↑
- Both Landscaping improvements — Enhances curb appeal and value ↑
- Both Add a smart home system — Improves convenience and energy efficiency ↑
ⓘ Cost ranges are severity-bucket heuristics (US national rule-of-thumb). Get contractor quotes + a written scope before underwriting a rehab budget.
Schools (NCES district)
- District
- Manatee
- NCES district ID
- 1201230
- Math proficiency
- 54% ▼ -6.00%
- Reading proficiency
- 50% ▼ -2.00%
- Median HH income
- $49,607
- Composite
- 44.43/100
- National rank
- #2806
- State rank
- #26 of 73 in FL
Livability — Ruskin
- Score
- 71/100
- State rank
- #392
- US rank
- #6879
Category grades
Schools grade is shown separately in the Schools card above.
Census & demographics
- County
- Manatee County · 416,364 people
- City population
- 33,319
- Metro
- North Port-Sarasota-Bradenton, FL
- Population (ZIP)
- 33,296
- Household income
- $113,773
- Rent vs Own
- Severe rent burden
- 219.0
Population outlook (Manatee County) Hauer SSP2
- Today (2025)
- 447,342 people
- By 2030
- 488,911 · +9.3%
- By 2040
- 567,934 · +27.0%
- By 2050
- 637,995 · +42.6%
- By 2075
- 781,970 · +74.8%
- By 2100
- 848,272 · +89.6%
Race, ethnicity, and origin ACS 2023
- Neighborhood character
- Predominantly White (75%)
- Race & ethnicity
- White 75% Hispanic / Latino 11% Two or more races 8% Black 8% Asian 2%
- Hispanic origin (detail)
- Mexican 2% Puerto Rican 3%
- Common ancestry
- Romanian 4% Hispanic 2% Russian 2%
- Foreign-born
- 10% · Canada, Dominican Republic, Jamaica
- Languages at home
- 88% English-only · Spanish 7% French/Haitian/Cajun 2% Other Asian/Pacific 1%
Political lean MEDSL · Manatee
- 2024 margin
- Strong R (+23.5) · D 37.9% · R 61.4%
- 2008→2024 swing
- -16.5pp toward R · 2008: -7.0pp · 2024: -23.5pp
- All cycles
- 2024: R+23.5 2020: R+16.1 2016: R+17.1 2012: R+12.5 2008: R+7.0
Not yet ingested
- Civics
- —
Market trends
- HPI YoY
- ▼ -84.45%
- Current HPI
- 271.7131
- Rent YoY
- ▼ -0.95%
- Metro
- North Port-Sarasota-Bradenton, FL
- State GDP YoY
- ▲ 3.28%
- F500 in state
- 36
Industry mix (Fortune 500 HQ in FL)
| Industry | F500 HQs | Revenue |
|---|---|---|
| Industrial Technology | 2 | $29B |
|
||
| Insurance | 2 | $17B |
|
||
| Retail | 1 | $60B |
|
||
| Technology Distribution | 1 | $58B |
|
||
| Homebuilding | 1 | $35B |
|
||
| Technology Manufacturing | 1 | $35B |
|
||
Cash-flow waterfall
monthlySold comps — $/sqft
last 12 mo · ≤1 miLoading sold comps…