1975 Shepard · Opdyke, IL
Flood risk 1/10 · Minimal
- FEMA flood zone
- X (unshaded)
- Chance of flooding over 30 yrs
- 0.0%
- Est. flood insurance / yr
- $473 – $860
Fire risk 1/10 · Minimal
- Est. fire insurance / yr
- $804 – $1,492
Heat risk 4/10 · Minor
- Hot days now (above 106°F)
- 7 days/yr
- Hot days in 30 yrs
- 20 days/yr
Wind risk 2/10 · Minimal
- Chance of severe wind over 30 yrs
- 3.0%
Air-quality risk 1/10 · Minimal
- Unhealthy air days now
- 0 days/yr
- Unhealthy air days in 30 yrs
- 0 days/yr
Risk factors via First Street. Map © Google.
Why this score? — see what drove the D+ grade
The composite is a weighted blend of 9 inputs, each scored 0–100. Each bar is that input's sub-score; the figure is the points it added to the 100-point composite (weight × sub-score).
- Cash flow +15.0/30.0
- ARV discount +7.4/15.0
- 1% rule +5.0/10.0
- DSCR +5.0/10.0
- Appreciation +5.0/10.0
- Livability +3.0/5.0
- Rent growth +2.5/5.0
- Schools +1.2/10.0
- Condition / age +1.0/5.0
$26,000
🖨 Deal sheet 📄 Offer letter ✓ Due diligence
Listing remarks
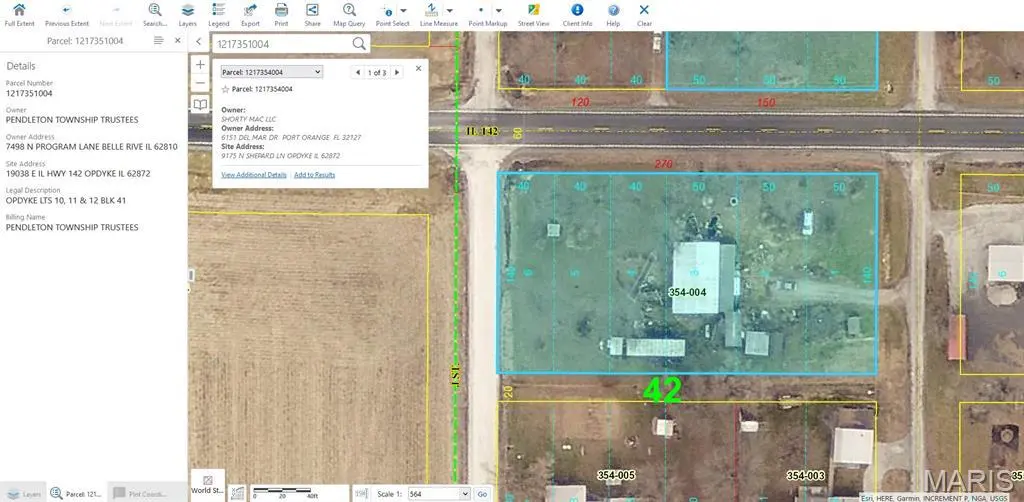
Home sold as is. Location: Opdyke, IL (Jefferson County) Property Type: Single-family residential. Context: Situated in a residential area of N Shepherd Ln.
Key facts
- Built 1975
- Listed 9 days
Property features AI
Exterior
- Utilities: Private water source; Single phase electric; Cable available
- Home design: Residential single family home; One story
- Construction: Constructed with other materials
- Exterior features: Open lot
Interior
- Bedrooms: 6 total bedrooms; 3 bedrooms on the main level; 3 bedrooms on the lower level
- Bathrooms: 1 full bathroom (main level)
- Heating & cooling: No heating system specified; Cooling: Other
- Interior features: One level living
Neighborhood map
What this means for you Summary
Snapshot
- This is a 6-bed/1.0-bath single-family listed at $26k. Condition is rated poor.
Deal economics
- At list price, monthly cash flow is $796 ($10k/yr) — positive.
- The deal already cash-flows at list — no discount required.
- Meets the 1% rule at list price ($1k rent vs $26k).
Location & tenants
- Location reads 60/100 on livability (#948 in IL) — a middle-class / working-renter tenant base. Strengths: cost of living A+, employment B+; Watch: schools C-, crime D-, amenities F.
- Mt Vernon Twp Hsd 201 (town): math 13% / reading 16% proficiency, ranked #532 of 620 in IL (top 86%) — low school quality limits family demand, transient renter base, plan for 1-2y turnover.
- Market conditions: 4 active listings in the ZIP; 6 units permitted in Jefferson County in 2024 (0 in 5+ unit buildings).
Forward outlook
- In year one you build about $960 of equity ($180 loan paydown + $780 appreciation (3.0% local appreciation)).
- Jefferson County population projected at -14% by 2050 — secular population decline; favor cash flow + early exit over multi-decade hold.
- At projected returns (3.0% appreciation + 3.0% rent growth), your $7k cash investment doubles in ~1 year — after that, you're playing with house money.
Negotiation context
- Only 9 days on market — expect competitive offers; lowballing is unlikely to land.
Questions for the listing agent
- Have any recent inspections been done? Can we get a copy of the seller's disclosures and any deferred-maintenance estimates?
- Built in 1975 — when were the roof, HVAC, electrical panel, plumbing, and water heater last replaced?
- Is there a deadline driving the sale (1031 exchange, divorce, estate, relocation)? That informs how much negotiation room exists.
- Crime grade is D in this area — have there been break-ins, vandalism, or insurance claims at this property in the last 3 years? What carrier currently insures it and at what premium?
- The area grade is low — what's the realistic commute time and amenity access for the typical tenant pool here? Any planned neighborhood developments (good or bad) we should know about?
- What's the average days-on-market for RENTAL listings here right now (not sales)? A rising rental-DOM trend means longer vacancies and softer asking-rent achievability than the comps imply.
- What's the recent tenant-quality profile in this submarket — average credit score on applications, eviction rate, late-payment / NSF rate, and stable-employment percentage? A property-management company in the area should have these aggregated.
- How much new for-sale + rental construction is in the pipeline within 1–3 miles? Heavy new supply typically softens prices + rents 12–24 months out; constrained supply supports both.
Investment metrics
- 1% rule
- 4.75% ✓
- Cap rate
- 43.01%
- Cash-on-cash
- 131.14%
- DSCR
- 6.83
- GRM
- 1.8
CMA / ARV
- ARV (on-the-fly)
- $25,920
- Comps found
- 1
Show comp detail 1 sale within ~0.75 mi
| Address | Dist | Beds/Ba | Sqft | Sold | Price | $/sf | Match |
|---|---|---|---|---|---|---|---|
| 1975 Shepard | 0.00mi | 6/1.0 | 1,440 (0%) | 1mo | $26,000 | $18 | 99 |
Match score weights: distance 35% · size 25% · config 20% · recency 20%. Top-matched comps best support the ARV.
Projected returns pro-forma
3.0% appreciation · 3.0% rent growth · sell at horizon
- IRR
- —
- Equity multiple
- 8.39×
- Total profit
- $53,821
- Equity at exit
- $11,691
- IRR
- —
- Equity multiple
- 17.57×
- Total profit
- $120,615
- Equity at exit
- $18,017
Cash invested: $7,280 (down + closing). Projections, not guarantees.
Landlord ↔ Tenant lean methodology
- Overall (STATE)
- 43 Moderately Tenant-Leaning
- State Illinois
- 43 Moderately Tenant-Leaning · D+7
- County
- — inherits STATE
- City
- — inherits STATE
ZIP-level market 62872
- Active inventory
- 4
- Price-to-rent
- 1.8×
Monthly cashflow live
- Estimated rent
- $1,234 medium interval (Pro) →
- Mortgage (P&I)
- −$136
- Tax est. 1.5%
- −$32 /mo · $390/yr
- Insurance
- −$11
- HOA
- −$0
- Vacancy / Maint / Mgmt
- −$259
- Net cashflow
- $796
Break-even live
UW: 25.0% down · 7.5% · 30yr · 1.5% tax · 5.0% vac · 8.0% maint · 8.0% mgmt
Financing live
Cash to close
- Down payment
- $6,500
- Closing costs
- $780
- Reserves months
- —
- Total cash needed
- —
Loan-product check · same deal, 3 products live
Conventional
25% down · 7.5% · 30yr
- Down + closing
- —
- Monthly P&I
- —
- Monthly cashflow
- —
- DSCR
- —
- Eligible?
- —
Personal DTI + credit; lowest rate.
DSCR
20% down · 8.5% · 30yr
- Down + closing
- —
- Monthly P&I
- —
- Monthly cashflow
- —
- DSCR
- —
- Eligible?
- —
No personal income docs; deal must DSCR.
Hard money
10% down · 12.0% · 12mo
- Down + closing
- —
- Monthly P&I
- —
- Monthly cashflow
- —
- DSCR
- —
- Eligible?
- —
Short-term bridge; refi at stabilization.
Listing history 2 events
-
2026-05-01status Pending
-
2026-04-22$26,000 Active
ⓘ Source: listings_history table (triggers on properties + properties_extension) + one-shot
backfill from property_details.listing_events for pre-trigger history.
Climate risk First Street
- Flood 1/10 Low FEMA zone X (unshaded) · 0% chance over 30 yrs
- Wildfire 1/10 Low
- Heat 4/10 Moderate 7 d/yr ≥106°F today · 20 d/yr by 30 yrs out
- Wind 2/10 Low 3% chance of damaging wind over 30 yrs
- Air quality 1/10 Low 0 unhealthy d/yr today · 0 by 30 yrs out
Nearby sold comps map
Loading sold comps map…
Walkable amenities ~0.75 mi
Loading nearby amenities…
Taxation est. · year 1
- Rental income
- $14,814
- − Mortgage interest
- −$1,456
- − Property taxes
- −$390
- − Insurance
- −$130
- − Repairs & maintenance
- −$1,185
- − Management
- −$1,185
- − Depreciation
- −$756
- Taxable income
- $9,711
- Est. tax owed @ 24.0%
- −$2,331
- After-tax cash flow
- $7,216/yr
For passive investors: Depreciation is non-cash, so a rental often shows a tax loss while cash-flowing — sheltering income. Rental losses are passive: they offset passive income freely, and up to $25,000/yr can offset ordinary (W-2) income if you actively participate and your MAGI is under $100k (phasing out to $0 by $150k); unused losses carry forward. On sale, claimed depreciation is recaptured at up to 25%, and gains may owe capital-gains tax (a 1031 exchange can defer both). Figures are a year-1 estimate at your 24.0% rate — not tax advice; consult a CPA.
Condition & rehab AI · 13 photos
This property requires extensive repairs and stabilization, including structural work, landscaping, and interior improvements. Significant investment is needed to make it habitable and attractive for resale or rental.
Repairs flagged
- Major Roof — Significant damage and missing shingles.
- Major Exterior walls — Structurally compromised and in poor condition.
- Major Flooring — Damaged and unstable, likely unsafe to walk on.
- Major Interior walls and paint — Paint peeling and walls damaged, requiring extensive repair or replacement.
- Major Landscaping — Overgrown and unkempt, with debris scattered around the property, requiring significant work to improve curb appeal.
Value-add opportunities
- Both Structural repairs and stabilization — Essential for safety and to stabilize the property, improving both resale and rental value.
- Both Landscaping and curb appeal improvements — Enhances the property's visual appeal, attracting more buyers and renters.
- Both Interior cleaning and organization — Improves the property's presentation, making it more attractive to potential buyers and renters.
- Both Painting and repairs to interior walls — Enhances the property's appearance and can increase its value by making it more attractive to buyers and renters.
- Both Roof repair and replacement — Essential for safety and to improve the property's overall condition, increasing its value for both resale and rental purposes.
Renovation cost estimate screening
| Repair item | Severity | Est. cost |
|---|---|---|
| Roof · Significant damage and missing shingles. | Major | $15,000–50,000 |
| Exterior walls · Structurally compromised and in poor condition. | Major | $15,000–50,000 |
| Flooring · Damaged and unstable, likely unsafe to walk on. | Major | $15,000–50,000 |
| Interior walls and paint · Paint peeling and walls damaged, requiring extensive repair or replacement. | Major | $15,000–50,000 |
| Landscaping · Overgrown and unkempt, with debris scattered around the property, requiring significant work to improve curb appeal. | Major | $15,000–50,000 |
| Total estimated repair cost · 5 items | $75,000–250,000 |
Value-add ROI direction
- Both Structural repairs and stabilization — Essential for safety and to stabilize the property, improving both resale and rental value. ↑
- Both Landscaping and curb appeal improvements — Enhances the property's visual appeal, attracting more buyers and renters. ↑
- Both Interior cleaning and organization — Improves the property's presentation, making it more attractive to potential buyers and renters. ↑
- Both Painting and repairs to interior walls — Enhances the property's appearance and can increase its value by making it more attractive to buyers and renters. ↑
- Both Roof repair and replacement — Essential for safety and to improve the property's overall condition, increasing its value for both resale and rental purposes. ↑
ⓘ Cost ranges are severity-bucket heuristics (US national rule-of-thumb). Get contractor quotes + a written scope before underwriting a rehab budget.
Schools (NCES district)
- District
- Mt Vernon Twp Hsd 201
- NCES district ID
- 1727360
- Math proficiency
- 13% ▼ -8.00%
- Reading proficiency
- 16% ▼ -8.00%
- Median HH income
- $38,188
- Composite
- 12.22/100
- National rank
- #9648
- State rank
- #532 of 620 in IL
Livability — Opdyke
- Score
- 60/100
- State rank
- #948
- US rank
- #18551
Category grades
Schools grade is shown separately in the Schools card above.
Census & demographics
- Census place
- Opdyke, IL
- Population (ZIP)
- 1,142
Population outlook (Jefferson County) Hauer SSP2
- Today (2025)
- 36,818 people
- By 2030
- 35,764 · -2.9%
- By 2040
- 33,649 · -8.6%
- By 2050
- 31,557 · -14.3%
- By 2075
- 26,055 · -29.2%
- By 2100
- 19,237 · -47.8%
Race, ethnicity, and origin ACS 2023
- Neighborhood character
- Predominantly White (88%)
- Race & ethnicity
- White 88% Two or more races 12%
- Common ancestry
- Iranian 6% Polish 6% Italian 6%
- Languages at home
- 78% English-only · German/W. Germanic 21% Spanish 1%
Political lean MEDSL · Jefferson
- 2024 margin
- Solid R (+47.8) · D 25.5% · R 73.3% · Other 1.3%
- 2008→2024 swing
- -37.0pp toward R · 2008: -10.7pp · 2024: -47.8pp
- All cycles
- 2024: R+47.8 2020: R+45.1 2016: R+43.2 2012: R+22.9 2008: R+10.7
Not yet ingested
- Civics
- —
Market trends
- HPI YoY
- —
- Current HPI
- —
- Rent YoY
- —
- Metro
- —
- State GDP YoY
- ▲ 1.59%
- F500 in state
- 60
Industry mix (Fortune 500 HQ in IL)
| Industry | F500 HQs | Revenue |
|---|---|---|
| Insurance | 4 | $201B |
|
||
| Consumer Goods | 4 | $87B |
|
||
| Industrial Machinery | 3 | $64B |
|
||
| Healthcare | 2 | $55B |
|
||
| Retail / Pharmacy | 1 | $148B |
|
||
| Agriculture / Food | 1 | $86B |
|
||
Price history
2 events — show timeline
- 2026-05-01 Pending — MARIS as Distributed by MLS Grid
- 2026-04-22 Listed $26,000 MARIS as Distributed by MLS Grid
Cash-flow waterfall
monthlySold comps — $/sqft
last 12 mo · ≤1 miLoading sold comps…