3424 N EL Vista Ave · Peoria, IL
Flood risk 1/10 · Minimal
- FEMA flood zone
- X
- Chance of flooding over 30 yrs
- 0.0%
- Est. flood insurance / yr
- $507 – $1,088
Fire risk 1/10 · Minimal
- Est. fire insurance / yr
- $804 – $1,492
Heat risk 3/10 · Minor
- Hot days now (above 105°F)
- 7 days/yr
- Hot days in 30 yrs
- 18 days/yr
Wind risk 2/10 · Minimal
- Chance of severe wind over 30 yrs
- 1.0%
Air-quality risk 3/10 · Minor
- Unhealthy air days now
- 1 days/yr
- Unhealthy air days in 30 yrs
- 3 days/yr
Risk factors via First Street. Map © Google.
Why this score? — see what drove the B- grade
The composite is a weighted blend of 9 inputs, each scored 0–100. Each bar is that input's sub-score; the figure is the points it added to the 100-point composite (weight × sub-score).
- Cash flow +30.0/30.0
- DSCR +10.0/10.0
- 1% rule +8.4/10.0
- ARV discount +7.5/15.0
- Livability +3.7/5.0
- Rent growth +3.1/5.0
- Condition / age +2.5/5.0
- Schools +1.1/10.0
- Appreciation +0.0/10.0
$59,900
🖨 Deal sheet 📄 Offer letter ✓ Due diligence
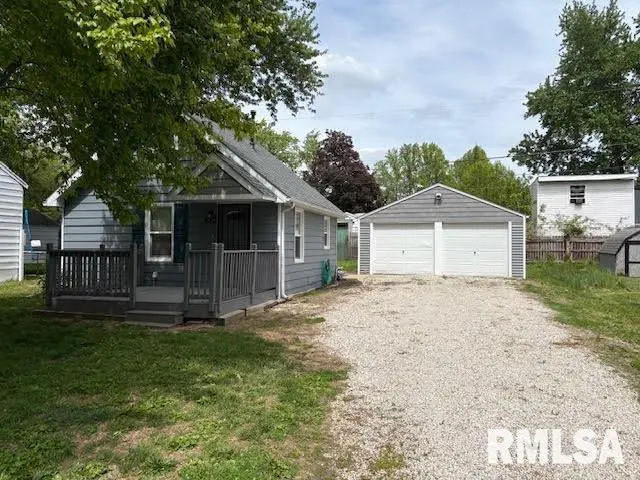
Listing remarks
Move in ready! Great 1 bed 1 bath home with a nice oversized 2 stall garage. A ton of updates including roof-2 years, windows-1 year, vinyl siding on garage, exterior doors, gutters, pex plumbing, and refrigerator. This is definitely cheaper than renting!
Key facts
- 6,500 sq ft lot
- 2 garage spots
- Built 1940
Property features AI
Exterior
- Parking: Detached 2-car garage
- Utilities: Public water; Public sewer; Gas water heater (utility)
- Home design: Single family residence; Shingle roof; Built in 1940
- Construction: Crawl space foundation
- Exterior features: Level lot; Paved road access
Interior
- Kitchen: Kitchen on main level (approximately 10' x 10')
- Bedrooms: 1 bedroom (main level, approximately 10' x 9')
- Flooring: Vinyl flooring in bedrooms, living room and kitchen
- Bathrooms: 1 full bathroom
- Heating & cooling: Forced air heating; Window unit(s) for cooling
- Interior features: Microwave; Refrigerator; Crawl space basement; No fireplaces
- Laundry & utility: Gas water heater
Neighborhood map
What this means for you Summary
Snapshot
- This is a 1-bed/1.0-bath single-family listed at $60k.
Deal economics
- At list price, monthly cash flow is $228 ($3k/yr) — positive.
- The deal already cash-flows at list — no discount required.
- Meets the 1% rule at list price ($803 rent vs $60k).
- Cap rate 10.9% vs local median 5.6% in Peoria — top-decile yield for the area; either an underpriced asset or a hidden risk that comps aren't pricing in. Stress-test before assuming the spread holds.
Location & tenants
- Location reads 73/100 on livability (#270 in IL) — a middle-class / working-renter tenant base. Strengths: commute A+, cost of living A+, housing A+; Watch: employment D+, crime F.
- Peoria SD 150 (urban): math 11% / reading 14% proficiency, ranked #554 of 620 in IL (top 89%) — low school quality limits family demand, transient renter base, plan for 1-2y turnover; 70% free/reduced lunch — lower-income household profile, screen leases tightly.
- Zoned schools: Dr Maude A Sanders Primary School (math 2% / reading 2%, grade F, #1,927 of 2,056 statewide, top 100%, 396 students, 0% FRL); Sterling Middle School (math 0% / reading 4%, grade F, #664 of 665 statewide, top 100%, 385 students, 0% FRL); Peoria High School (math 4% / reading 7%, grade F, #609 of 693 statewide, top 88%, 1,447 students, 0% FRL) — zoned schools average 0% FRL vs 70% district-wide (70 pts lower); this property's tenant base skews higher-income than the district average.
- Market conditions: Rents rising (+2.3%/yr); 180 active listings in the ZIP; 73 units permitted in Peoria County in 2024 (0 in 5+ unit buildings).
Forward outlook
- Local home prices are declining (-3.0%/yr); year-one equity from $414 of loan paydown is wiped out by about $2k of value loss. Plan a longer hold.
- Peoria County population projected at -11% by 2050 — secular population decline; favor cash flow + early exit over multi-decade hold.
- At projected returns (-3.0% appreciation + 2.3% rent growth), your $17k cash investment doubles in ~8 years — after that, you're playing with house money.
Negotiation context
- Only 7 days on market — expect competitive offers; lowballing is unlikely to land.
Risks & watch-outs
- Watch-outs: built in 1940 — expect roof / HVAC / electrical / plumbing capex.
Questions for the listing agent
- Built in 1940 — when were the roof, HVAC, electrical panel, plumbing, and water heater last replaced?
- Is there a deadline driving the sale (1031 exchange, divorce, estate, relocation)? That informs how much negotiation room exists.
- Schools are F-rated, which usually means shorter tenancies and higher turnover. Who's the typical renter profile here, and what's been the actual vacancy rate?
- Crime grade is F in this area — have there been break-ins, vandalism, or insurance claims at this property in the last 3 years? What carrier currently insures it and at what premium?
- What's the average days-on-market for RENTAL listings here right now (not sales)? A rising rental-DOM trend means longer vacancies and softer asking-rent achievability than the comps imply.
- What's the recent tenant-quality profile in this submarket — average credit score on applications, eviction rate, late-payment / NSF rate, and stable-employment percentage? A property-management company in the area should have these aggregated.
- How much new for-sale + rental construction is in the pipeline within 1–3 miles? Heavy new supply typically softens prices + rents 12–24 months out; constrained supply supports both.
Investment metrics
- 1% rule
- 1.34% ✓
- Cap rate
- 10.87%
- Cash-on-cash
- 16.34%
- DSCR
- 1.73
- GRM
- 6.2
CMA / ARV
- ARV (median comp)
- $31,879
- List price
- $59,900
- Delta
- 87.90%
- Verdict
- OVERPRICED
- Comps
- 7 within 1.0 mi
Show comp detail 3 sales within ~0.75 mi
| Address | Dist | Beds/Ba | Sqft | Sold | Price | $/sf | Match |
|---|---|---|---|---|---|---|---|
| 3424 N EL Vista Ave | 0.00mi | 1/1.0 | 400 (0%) | 0mo | $53,000 | $133 | 100 |
| 3336 N Sterling Ave | 0.15mi | 1/1.0 | 440 (+10%) | 10mo | $31,000 | $70 | 68 |
| 2232 W Albany St | 0.27mi | 1/1.0 | 440 (+10%) | 14mo | $25,000 | $57 | 60 |
Match score weights: distance 35% · size 25% · config 20% · recency 20%. Top-matched comps best support the ARV.
Projected returns pro-forma
-3.0% appreciation · 2.3% rent growth · sell at horizon
- IRR
- 6.6%
- Equity multiple
- 1.26×
- Total profit
- $4,282
- Equity at exit
- $8,931
- IRR
- 15.3%
- Equity multiple
- 2.21×
- Total profit
- $20,212
- Equity at exit
- $5,179
Cash invested: $16,772 (down + closing). Projections, not guarantees.
Landlord ↔ Tenant lean methodology
- Overall (STATE)
- 43 Moderately Tenant-Leaning
- State Illinois
- 43 Moderately Tenant-Leaning · D+7
- County
- — inherits STATE
- City
- — inherits STATE
ZIP-level market 61604
- Home prices YoY
- -24.6%
- Rents YoY
- 2.3%
- Active inventory
- 180
- Price-to-rent
- 6.2×
Monthly cashflow live
- Estimated rent
- $803 medium interval (Pro) →
- Mortgage (P&I)
- −$314
- Tax from tax record
- −$67 /mo · $804/yr
- Insurance
- −$25
- HOA
- −$0
- Vacancy / Maint / Mgmt
- −$169
- Net cashflow
- $228
Break-even live
UW: 25.0% down · 7.5% · 30yr · 1.5% tax · 5.0% vac · 8.0% maint · 8.0% mgmt
Financing live
Cash to close
- Down payment
- $14,975
- Closing costs
- $1,797
- Reserves months
- —
- Total cash needed
- —
Loan-product check · same deal, 3 products live
Conventional
25% down · 7.5% · 30yr
- Down + closing
- —
- Monthly P&I
- —
- Monthly cashflow
- —
- DSCR
- —
- Eligible?
- —
Personal DTI + credit; lowest rate.
DSCR
20% down · 8.5% · 30yr
- Down + closing
- —
- Monthly P&I
- —
- Monthly cashflow
- —
- DSCR
- —
- Eligible?
- —
No personal income docs; deal must DSCR.
Hard money
10% down · 12.0% · 12mo
- Down + closing
- —
- Monthly P&I
- —
- Monthly cashflow
- —
- DSCR
- —
- Eligible?
- —
Short-term bridge; refi at stabilization.
Listing history 2 events
-
2026-05-14status Pending 258-char remark
-
2026-05-07$59,900 Active 258-char remark
ⓘ Source: listings_history table (triggers on properties + properties_extension) + one-shot
backfill from property_details.listing_events for pre-trigger history.
Tax reassessment forecast IL · Partial reset (capped growth)
- Current annual tax
- $804 · $67/mo
- Projected year-2 tax
- $1,082 · $90/mo
- Expected delta
- +$278/yr (+$23/mo · 34.6%)
ⓘ Screening estimate from a state-policy table — verify with the county assessor before closing.
Climate risk First Street
- Flood 1/10 Low FEMA zone X · 0% chance over 30 yrs
- Wildfire 1/10 Low
- Heat 3/10 Moderate 7 d/yr ≥105°F today · 18 d/yr by 30 yrs out
- Wind 2/10 Low 100% chance of damaging wind over 30 yrs
- Air quality 3/10 Moderate 1 unhealthy d/yr today · 3 by 30 yrs out
Nearby sold comps map
Loading sold comps map…
Walkable amenities ~0.75 mi
Loading nearby amenities…
Taxation est. · year 1
- Rental income
- $9,636
- − Mortgage interest
- −$3,355
- − Property taxes
- −$804
- − Insurance
- −$300
- − Repairs & maintenance
- −$771
- − Management
- −$771
- − Depreciation
- −$1,743
- Taxable income
- $1,893
- Est. tax owed @ 24.0%
- −$454
- After-tax cash flow
- $2,286/yr
For passive investors: Depreciation is non-cash, so a rental often shows a tax loss while cash-flowing — sheltering income. Rental losses are passive: they offset passive income freely, and up to $25,000/yr can offset ordinary (W-2) income if you actively participate and your MAGI is under $100k (phasing out to $0 by $150k); unused losses carry forward. On sale, claimed depreciation is recaptured at up to 25%, and gains may owe capital-gains tax (a 1031 exchange can defer both). Figures are a year-1 estimate at your 24.0% rate — not tax advice; consult a CPA.
Schools (NCES district)
- District
- Peoria SD 150
- NCES district ID
- 1731230
- Math proficiency
- 11% ▼ -5.00%
- Reading proficiency
- 14% ▼ -4.00%
- Median HH income
- $41,951
- Composite
- 10.92/100
- National rank
- #9751
- State rank
- #554 of 620 in IL
Livability — Peoria
- Score
- 73/100
- State rank
- #270
- US rank
- #5096
Category grades
Schools grade is shown separately in the Schools card above.
Census & demographics
- Census place
- Peoria, IL
- County
- Peoria County · 120,495 people
- City population
- 114,670
- Metro
- Peoria, IL
- Population (ZIP)
- 28,313
- Household income
- $52,414
- Rent vs Own
- Severe rent burden
- 815.0
Population outlook (Peoria County) Hauer SSP2
- Today (2025)
- 183,007 people
- By 2030
- 179,643 · -1.8%
- By 2040
- 171,782 · -6.1%
- By 2050
- 163,508 · -10.7%
- By 2075
- 140,178 · -23.4%
- By 2100
- 114,493 · -37.4%
Race, ethnicity, and origin ACS 2023
- Neighborhood character
- Diverse neighborhood (Simpson 0.61)
- Race & ethnicity
- White 55% Black 29% Two or more races 10% Hispanic / Latino 7% Asian 2%
- Hispanic origin (detail)
- Mexican 5%
- Common ancestry
- Italian 2% Slovak 1% Iranian 1%
- Foreign-born
- 6% · Canada, China
- Languages at home
- 92% English-only · Spanish 4% Chinese 1% French/Haitian/Cajun 1%
Political lean MEDSL · Peoria
- 2024 margin
- Toss-up / Even · D 51.5% · R 46.9% · Other 1.6%
- 2008→2024 swing
- -9.2pp toward R · 2008: 13.9pp · 2024: 4.7pp
- All cycles
- 2024: D+4.7 2020: D+6.3 2016: D+2.8 2012: D+4.4 2008: D+13.9
Not yet ingested
- Civics
- —
Market trends
- HPI YoY
- ▼ -54.15%
- Current HPI
- 165.8838
- Rent YoY
- ▲ 2.30%
- Metro
- Peoria, IL
- State GDP YoY
- ▲ 1.59%
- F500 in state
- 60
Industry mix (Fortune 500 HQ in IL)
| Industry | F500 HQs | Revenue |
|---|---|---|
| Insurance | 4 | $201B |
|
||
| Consumer Goods | 4 | $87B |
|
||
| Industrial Machinery | 3 | $64B |
|
||
| Healthcare | 2 | $55B |
|
||
| Retail / Pharmacy | 1 | $148B |
|
||
| Agriculture / Food | 1 | $86B |
|
||
Price history
-11.5% since first listed4 events — show timeline
- 2026-06-10 Sold (Public Records) $53,000 Public Records
- 2026-06-08 Sold (MLS) $53,000 RMLSA as Distributed by MLS Grid
- 2026-05-14 Pending — RMLSA as Distributed by MLS Grid
- 2026-05-07 Listed $59,900 RMLSA as Distributed by MLS Grid
Property tax history
-0.4%/yrLatest (2025): $804 · +6.4% YoY. Source: county tax records.
Cash-flow waterfall
monthlySold comps — $/sqft
last 12 mo · ≤1 miLoading sold comps…