 Multi-family
181 N Mendocino Ct · Goddard, KS
Flood risk No data
- FEMA flood zone
- —
- Chance of flooding over 30 yrs
- —
- Est. flood insurance / yr
- —
Fire risk No data
- Est. fire insurance / yr
- —
Heat risk No data
- Hot days now (above threshold)
- —
- Hot days in 30 yrs
- —
Wind risk No data
- Chance of severe wind over 30 yrs
- —
Air-quality risk No data
- Unhealthy air days now
- —
- Unhealthy air days in 30 yrs
- —
Risk factors via First Street. Map © Google.
Why this score? — see what drove the D grade
The composite is a weighted blend of 9 inputs, each scored 0–100. Each bar is that input's sub-score; the figure is the points it added to the 100-point composite (weight × sub-score).
- Cash flow +13.1/30.0
- ARV discount +7.5/15.0
- Condition / age +5.0/5.0
- 1% rule +4.1/10.0
- DSCR +3.9/10.0
- Schools +3.9/10.0
- Livability +3.7/5.0
- Rent growth +2.5/5.0
- Appreciation +0.0/10.0
$240,000
🖨 Deal sheet (PDF) 📄 Offer letter ✓ Due diligence
Multi-family units
County records classify this as Multi-Family (2-4 Unit). Listing-text estimate: 1 unit. estimate disagrees with records
Key facts
- 9,147 sq ft lot
- 2 garage spots
- Built 2026
Property features AI
Finance
- HOA & community: Has association; Association fee $840 (includes lawn service)
Exterior
- Parking: 2-car garage
- Utilities: Natural gas available; Public water; Sewer available
- Home design: Duplex
- Construction: No foundation details provided
- Exterior features: One-and-one-half story; Composition roof
Interior
- Bathrooms: 2 full bathrooms
- Heating & cooling: Central air conditioning; Forced air heating
- Interior features: One fireplace; No basement
- Laundry & utility: Laundry on the main floor
Neighborhood map
What this means for you Summary
Snapshot
- This is a 4-bed/2.0-bath multifamily listed at $240k. Condition is rated excellent.
Deal economics
- At list price, monthly cash flow is $-9 ($-109/yr) — negative.
- To cash-flow at today's rent, offer at most $239k (0.5% below list).
- To meet the 1% rule (rent ≥ 1% of price), the offer needs to be $218k (9.3% below list).
- Recommended offer: $218k (9.3% below list) — sets the bar for 1% rule.
Location & tenants
- Location reads 73/100 on livability (#91 in KS) — a middle-class / working-renter tenant base. Strengths: crime A+, employment A+, cost of living A+; Watch: amenities F, commute F, health & safety F.
- Goddard (rural): math 38% / reading 46% proficiency, ranked #18 of 169 in KS (top 11%) — families likely to look elsewhere, expect single-tenant / working-renter base with shorter leases; only 17% free/reduced lunch — higher-income household profile.
- Zoned schools: Explorer Elementary School (math 47% / reading 62%, grade C, #107 of 684 statewide, top 18%, 472 students, 27% FRL); Dwight D. Eisenhower Middle School (math 45% / reading 40%, grade D-, #17 of 219 statewide, top 7%, 614 students, 16% FRL); Eisenhower High School (math 29% / reading 40%, grade F, #32 of 327 statewide, top 13%, 1,002 students, 23% FRL) — zoned schools at 22% FRL track the district average.
- Market conditions: 410 active listings in the ZIP; 1 comparable units currently listed for rent nearby; solid renter incomes; 2,613 units permitted in Sedgwick County in 2024 (258 in 5+ unit buildings).
Forward outlook
- Local home prices are declining (-3.0%/yr); year-one equity from $2k of loan paydown is wiped out by about $7k of value loss. Plan a longer hold.
- Sedgwick County population projected at +5% by 2050 — modest demand growth; plan on rents tracking national, not racing it.
Negotiation context
- It's been on market 46 days — a 3% lower offer ($233k) is reasonable based on typical stale-listing flexibility.
Questions for the listing agent
- What do current leases actually rent for vs. the listed asking? Can we see a recent rent roll and the last 12 months of T-12 income?
- It's been on market 46 days. Have you received any prior offers? Is the seller open to a 9% concession, seller financing, or rate buy-down credit?
- What does the HOA fee cover, when was the last increase, and are there any pending special assessments or reserve-fund shortfalls?
- Is there a deadline driving the sale (1031 exchange, divorce, estate, relocation)? That informs how much negotiation room exists.
- The area grade is low — what's the realistic commute time and amenity access for the typical tenant pool here? Any planned neighborhood developments (good or bad) we should know about?
- What's the average days-on-market for RENTAL listings here right now (not sales)? A rising rental-DOM trend means longer vacancies and softer asking-rent achievability than the comps imply.
- What's the recent tenant-quality profile in this submarket — average credit score on applications, eviction rate, late-payment / NSF rate, and stable-employment percentage? A property-management company in the area should have these aggregated.
- How much new apartment / multifamily construction is in the pipeline within 1–3 miles? Heavy new supply (>2% of stock underway) typically softens rents 12–24 months out; light construction supports rent growth.
Investment metrics
- 1% rule
- 0.91% ✗
- Cap rate
- 6.25%
- Cash-on-cash
- -0.16%
- DSCR
- 0.99
- GRM
- 9.2
CMA / ARV
No comps found within radius.
Projected returns pro-forma
-3.0% appreciation · 3.0% rent growth · sell at horizon
- IRR
- -16.5%
- Equity multiple
- 0.41×
- Total profit
- $-39,395
- Equity at exit
- $35,785
- IRR
- -8.2%
- Equity multiple
- 0.48×
- Total profit
- $-34,743
- Equity at exit
- $20,751
Cash invested: $67,200 (down + closing). Projections, not guarantees.
Landlord ↔ Tenant lean methodology
- Overall (STATE)
- 83 Strongly Landlord-Friendly
- State Kansas
- 83 Strongly Landlord-Friendly · R+10
- County
- — inherits STATE
- City
- — inherits STATE
ZIP-level market 67052
- Home prices YoY
- -17.1%
- Active inventory
- 410
- Price-to-rent
- 9.2×
Monthly cashflow live
- Estimated rent
- $2,177 medium interval (Pro) →
- Mortgage (P&I)
- −$1,259
- Tax est. 1.5%
- −$300 /mo · $3,600/yr
- Insurance
- −$100
- HOA
- −$70
- Vacancy / Maint / Mgmt
- −$457
- Net cashflow
- $-9
Break-even live
Sensitivity live
| Price | -10% $157 | -5% $74 | +0% $-9 | +5% $-92 | +10% $-175 |
|---|---|---|---|---|---|
| Rent | -10% $-181 | -5% $-95 | +0% $-9 | +5% $77 | +10% $163 |
| Rate | -1.0pp $112 | -0.5pp $52 | base $-9 | +0.5pp $-71 | +1.0pp $-135 |
UW: 25.0% down · 7.5% · 30yr · 1.5% tax · 5.0% vac · 8.0% maint · 8.0% mgmt
Financing live
Cash to close
- Down payment
- $60,000
- Closing costs
- $7,200
- Reserves months
- —
- Total cash needed
- —
Loan-product check · same deal, 3 products live
Conventional
25% down · 7.5% · 30yr
- Down + closing
- —
- Monthly P&I
- —
- Monthly cashflow
- —
- DSCR
- —
- Eligible?
- —
Personal DTI + credit; lowest rate.
DSCR
20% down · 8.5% · 30yr
- Down + closing
- —
- Monthly P&I
- —
- Monthly cashflow
- —
- DSCR
- —
- Eligible?
- —
No personal income docs; deal must DSCR.
Hard money
10% down · 12.0% · 12mo
- Down + closing
- —
- Monthly P&I
- —
- Monthly cashflow
- —
- DSCR
- —
- Eligible?
- —
Short-term bridge; refi at stabilization.
Rent comps 1 comps
| Address | Beds | Baths | Sqft | Rent | $/sqft | DOM | Units | Dist |
|---|---|---|---|---|---|---|---|---|
| 127 S 167th St W Goddard, KS | 3.0–5.0 | 2.0–3.0 | 1543 | $1,845 | $1.20 | 15d | 1 | 0.12mi |
HOA detail
- Monthly dues
- $70 · $840/yr
Listing history 17 events
-
2026-06-21days on market $240,000 Active 46 DOM
-
2026-06-18days on market $240,000 Active 43 DOM
-
2026-06-17days on market $240,000 Active 42 DOM
-
2026-06-16days on market $240,000 Active 41 DOM
-
2026-06-15days on market $240,000 Active 40 DOM
-
2026-06-14days on market $240,000 Active 38 DOM
-
2026-06-13days on market $240,000 Active 37 DOM
-
2026-06-10days on market $240,000 Active 35 DOM
-
2026-06-09days on market $240,000 Active 34 DOM
-
2026-06-08days on market $240,000 Active 33 DOM
-
2026-06-07days on market $240,000 Active 32 DOM
-
2026-06-03days on market $240,000 Active 28 DOM
-
2026-06-02days on market $240,000 Active 27 DOM
-
2026-06-01days on market $240,000 Active 26 DOM
-
2026-05-31days on market $240,000 Active 25 DOM
-
2026-05-30days on market $240,000 Active 24 DOM
-
2026-05-06$240,000 Active
ⓘ Source: listings_history table (triggers on properties + properties_extension) + one-shot
backfill from property_details.listing_events for pre-trigger history.
Nearby sold comps map
Loading sold comps map…
Walkable amenities ~0.75 mi
Loading nearby amenities…
Taxation est. · year 1
- Rental income
- $26,119
- − Mortgage interest
- −$13,444
- − Property taxes
- −$3,600
- − Insurance
- −$1,200
- − Repairs & maintenance
- −$2,089
- − Management
- −$2,089
- − HOA
- −$840
- − Depreciation
- −$6,982
- Taxable loss
- −$4,126
- Est. tax savings @ 24.0%
- +$990
- After-tax cash flow
- $881/yr
For passive investors: Depreciation is non-cash, so a rental often shows a tax loss while cash-flowing — sheltering income. Rental losses are passive: they offset passive income freely, and up to $25,000/yr can offset ordinary (W-2) income if you actively participate and your MAGI is under $100k (phasing out to $0 by $150k); unused losses carry forward. On sale, claimed depreciation is recaptured at up to 25%, and gains may owe capital-gains tax (a 1031 exchange can defer both). Figures are a year-1 estimate at your 24.0% rate — not tax advice; consult a CPA.
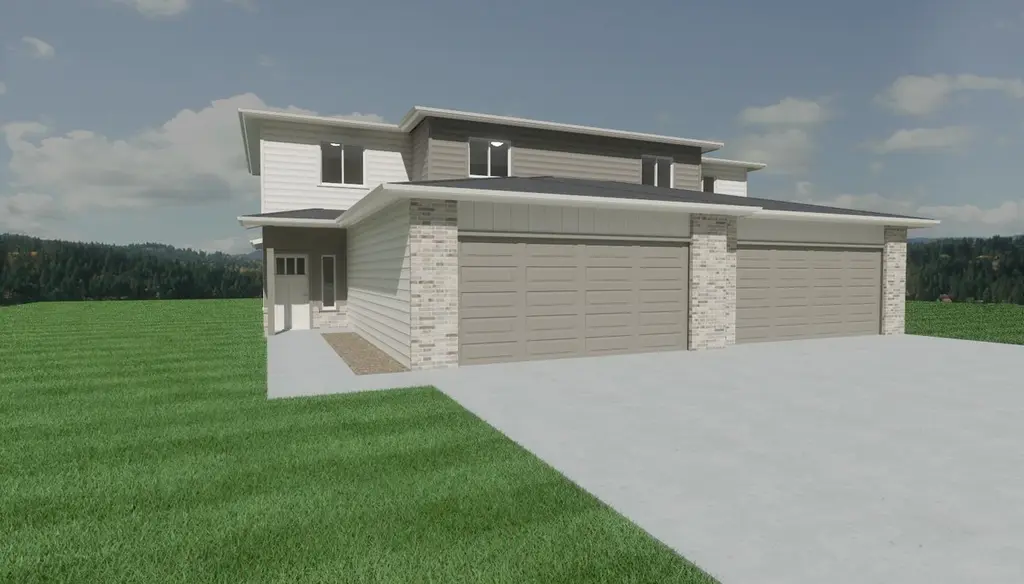
Condition & rehab AI · 1 photo
This multi-family home is in excellent condition with no visible repairs needed. It has a good curb appeal and interior, making it a strong candidate for both resale and rental.
Value-add opportunities
- Both Landscaping — Enhances curb appeal and adds value
- Both Interior paint — Fresh paint can make the home more appealing
- Both Lighting — Improved lighting can make the home more inviting
Renovation cost estimate screening
Value-add ROI direction
- Both Landscaping — Enhances curb appeal and adds value ↑
- Both Interior paint — Fresh paint can make the home more appealing ↑
- Both Lighting — Improved lighting can make the home more inviting ↑
ⓘ Cost ranges are severity-bucket heuristics (US national rule-of-thumb). Get contractor quotes + a written scope before underwriting a rehab budget.
Schools (NCES district)
- District
- Goddard
- NCES district ID
- 2006540
- Math proficiency
- 38% ▼ -4.00%
- Reading proficiency
- 46% ▼ -2.00%
- Median HH income
- $80,167
- Composite
- 39.01/100
- National rank
- #4067
- State rank
- #18 of 169 in KS
Livability — Goddard
- Score
- 73/100
- State rank
- #91
- US rank
- #5252
Category grades
Schools grade is shown separately in the Schools card above.
Census & demographics
- County
- Sedgwick County · 432,957 people
- City population
- 9,262
- Metro
- Wichita, KS
- Population (ZIP)
- 9,262
- Household income
- $103,148
- Rent vs Own
- Severe rent burden
- 43.0
Population outlook (Sedgwick County) Hauer SSP2
- Today (2025)
- 537,014 people
- By 2030
- 546,984 · +1.9%
- By 2040
- 559,141 · +4.1%
- By 2050
- 562,027 · +4.7%
- By 2075
- 557,255 · +3.8%
- By 2100
- 513,383 · -4.4%
Race, ethnicity, and origin ACS 2023
- Neighborhood character
- Predominantly White (88%)
- Race & ethnicity
- White 88% Hispanic / Latino 8% Two or more races 6%
- Hispanic origin (detail)
- Mexican 6%
- Common ancestry
- Iranian 2% Romanian 2% Lithuanian 2%
- Foreign-born
- 1% · China, Canada
- Languages at home
- 95% English-only · Spanish 4%
Political lean MEDSL · Sedgwick
- 2024 margin
- R (+13.8) · D 42.3% · R 56.1% · Other 1.6%
- 2008→2024 swing
- -1.1pp toward R · 2008: -12.7pp · 2024: -13.8pp
- All cycles
- 2024: R+13.8 2020: R+12.6 2016: R+19.1 2012: R+19.7 2008: R+12.7
Not yet ingested
- Civics
- —
Market trends
- HPI YoY
- ▼ -54.44%
- Current HPI
- 264.1893
- Rent YoY
- —
- Metro
- Wichita, KS
- State GDP YoY
- —
- F500 in state
- 0
Price history
1 event — show timeline
- 2026-05-06 Listed $240,000 SCKMLS as Distributed by MLS Grid
Cash-flow waterfall
monthlySold comps — $/sqft
last 12 mo · ≤1 miLoading sold comps…