 🏷️ Likely Rental
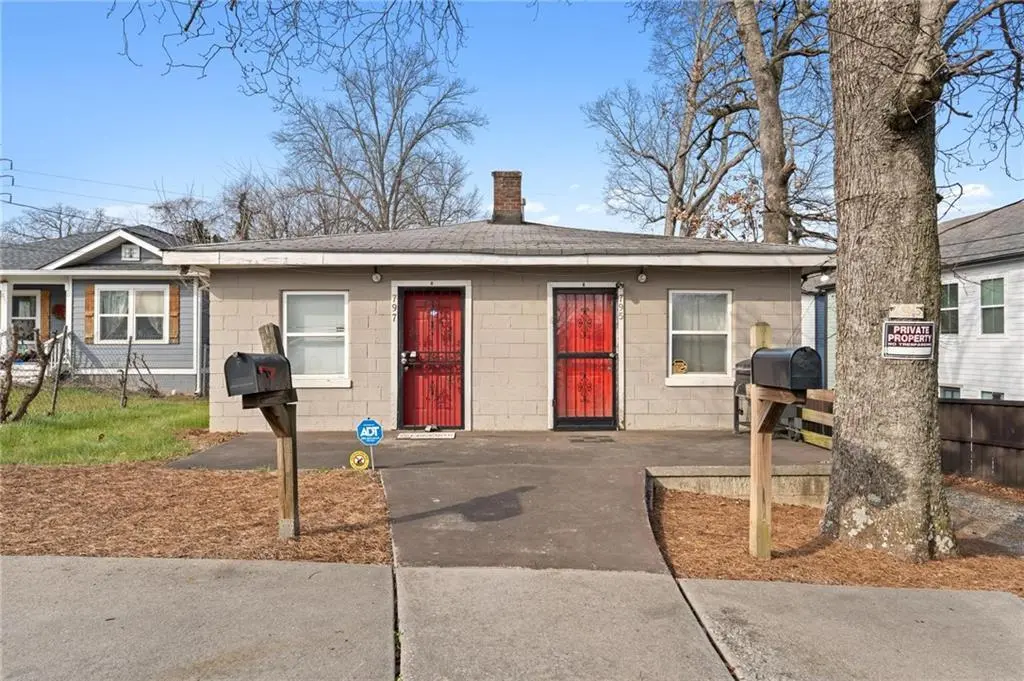
797 Beryl St SW · Atlanta, GA
Flood risk 1/10 · Minimal
- FEMA flood zone
- X (unshaded)
- Chance of flooding over 30 yrs
- 0.0%
- Est. flood insurance / yr
- $507 – $1,088
Fire risk 1/10 · Minimal
- Est. fire insurance / yr
- $963 – $1,789
Heat risk 5/10 · Moderate
- Hot days now (above 104°F)
- 7 days/yr
- Hot days in 30 yrs
- 18 days/yr
Wind risk 4/10 · Minor
- Chance of severe wind over 30 yrs
- 22.0%
Air-quality risk 4/10 · Minor
- Unhealthy air days now
- 4 days/yr
- Unhealthy air days in 30 yrs
- 6 days/yr
Risk factors via First Street. Map © Google.
Why this score? — see what drove the C+ grade
The composite is a weighted blend of 9 inputs, each scored 0–100. Each bar is that input's sub-score; the figure is the points it added to the 100-point composite (weight × sub-score).
- Cash flow +23.6/30.0
- ARV discount +15.0/15.0
- DSCR +7.6/10.0
- 1% rule +5.9/10.0
- Livability +4.2/5.0
- Rent growth +3.2/5.0
- Schools +2.7/10.0
- Condition / age +2.5/5.0
- Appreciation +0.0/10.0
$250,000
🖨 Deal sheet 📄 Offer letter ✓ Due diligence
Multi-family units
County records classify this as Multi-Family (2-4 Unit). Listing-text estimate: 2 units. confirmed
Listing remarks MLS
Welcome to 797 Beryl St, a fully occupied duplex producing $2,150/month in total rental income from day one. This is a turnkey opportunity for investors looking for immediate cash flow in a high-demand, in-town location. Situated just minutes from Downtown and Midtown Atlanta, this property benefits from strong rental demand and long-term upside as the surrounding area continues to grow. Both units are currently occupied, making this an ideal buy-and-hold investment with consistent income and minimal downtime.Tenant occupied - Please do not disturb the tenants.
Key facts
- Strong rental demand
- Total rental income
- Long-term upside
Tags
Neighborhood map
What this means for you Summary
Snapshot
- This is a 2 × 2-bed/2.0-bath units multifamily listed at $250k.
Deal economics
- At list price, monthly cash flow is $474 ($6k/yr) — positive. Per door: $237/mo.
- The deal already cash-flows at list — no discount required.
- Meets the 1% rule at list price ($3k rent vs $250k).
- Recommended offer: $228k (9.0% below list) — sets the bar for market timing.
- Cap rate 8.6% vs local median 3.1% in Atlanta — top-decile yield for the area; either an underpriced asset or a hidden risk that comps aren't pricing in. Stress-test before assuming the spread holds.
Location & tenants
- Location reads 83/100 on livability (#6 in GA, #919 nationally) — a professional / high-income tenant draw. Strengths: amenities A+, commute A+, housing A+; Watch: schools C-, cost of living C-.
- Atlanta Public Schools (urban): math 28% / reading 35% proficiency, ranked #80 of 174 in GA (top 46%) — families likely to look elsewhere, expect single-tenant / working-renter base with shorter leases; 71% free/reduced lunch — lower-income household profile, screen leases tightly.
- Market conditions: Rents rising (+2.8%/yr); 452 active listings in the ZIP; 40 comparable units currently listed for rent nearby; rentals at typical pace (median 18d on market — plan ~3-4 weeks tenant-placement turnaround); 11,565 units permitted in Fulton County in 2024 (8,159 in 5+ unit buildings).
- At $2,725/mo this rent would consume 62% of the median local household income ($53k/yr) (locally 1676% of renters already pay >50% of income on rent) — very limited rent-growth headroom before tenants either downsize or default.
Forward outlook
- Local home prices are declining (-3.0%/yr); year-one equity from $2k of loan paydown is wiped out by about $8k of value loss. Plan a longer hold.
- Fulton County population projected at +38% by 2050 — long-run rental-demand tailwind backs the buy-and-hold thesis.
Negotiation context
- It's been on market 117 days — a 9% lower offer ($228k) is reasonable based on typical stale-listing flexibility.
- 2 sale attempts with the ask held roughly flat each time — persistent listings suggest the price (not the market) is what's stuck; bring a comps-based counter.
- Current owner paid $25k; list at $250k implies a 900% gain — meaningful room to come down on a strong offer.
Risks & watch-outs
- Watch-outs: built in 1950 — expect roof / HVAC / electrical / plumbing capex.
- Climate carrying-cost: extreme-heat days projected 7→18/yr by 2055 (HVAC capex compounding) — expect insurance premiums to compound above CPI over the hold.
Questions for the listing agent
- It's been on market 117 days. Have you received any prior offers? Is the seller open to a 9% concession, seller financing, or rate buy-down credit?
- Can we see the unit-by-unit rent roll, current vacancy, and any below-market leases? What's the average tenancy length?
- What capital expenditures (roof, boiler, parking lot, exteriors) have been made in the last 5 years, and what's planned in the next 2?
- Built in 1950 — when were the roof, HVAC, electrical panel, plumbing, and water heater last replaced?
- Why hasn't it sold? Are there any deal-killer items the seller is aware of (foundation, flood, title, zoning, code violations)?
- Is there a deadline driving the sale (1031 exchange, divorce, estate, relocation)? That informs how much negotiation room exists.
- What's the average days-on-market for RENTAL listings here right now (not sales)? A rising rental-DOM trend means longer vacancies and softer asking-rent achievability than the comps imply.
- What's the recent tenant-quality profile in this submarket — average credit score on applications, eviction rate, late-payment / NSF rate, and stable-employment percentage? A property-management company in the area should have these aggregated.
- How much new apartment / multifamily construction is in the pipeline within 1–3 miles? Heavy new supply (>2% of stock underway) typically softens rents 12–24 months out; light construction supports rent growth.
Investment metrics
- 1% rule
- 1.09% ✓
- Cap rate
- 8.57%
- Cash-on-cash
- 8.12%
- DSCR
- 1.36
- GRM
- 7.6
CMA / ARV
- ARV (median comp)
- $440,452
- List price
- $250,000
- Delta
- -43.24%
- Verdict
- UNDERPRICED
- Comps
- 5 within 2.0 mi
Projected returns pro-forma
-3.0% appreciation · 2.77% rent growth · sell at horizon
- IRR
- -4.2%
- Equity multiple
- 0.84×
- Total profit
- $-10,968
- Equity at exit
- $37,276
- IRR
- 5.2%
- Equity multiple
- 1.38×
- Total profit
- $26,763
- Equity at exit
- $21,615
Cash invested: $70,000 (down + closing). Projections, not guarantees.
Landlord ↔ Tenant lean methodology
- Overall (STATE)
- 90 Strongly Landlord-Friendly
- State Georgia
- 90 Strongly Landlord-Friendly · R+3
- County
- — inherits STATE
- City
- — inherits STATE
ZIP-level market 30310
- Home prices YoY
- -32.8%
- Rents YoY
- 2.8%
- Active inventory
- 452
- Price-to-rent
- 15.3×
Monthly cashflow live
- Estimated rent
- $2,725 medium interval (Pro) →
- Mortgage (P&I)
- −$1,311
- Tax from tax record
- −$264 /mo · $3,168/yr
- Insurance
- −$104
- HOA
- −$0
- Vacancy / Maint / Mgmt
- −$572
- Net cashflow
- $474
Break-even live
2-unit breakdown (identical units grouped — click to expand)
| Units | Beds | Baths | Est. rent |
|---|---|---|---|
| 2× units | 2 | 2 | $2,726 |
| #1 | 2 | 2 | $1,363 |
| #2 | 2 | 2 | $1,363 |
| Total (2 units) | $2,725 | ||
UW: 25.0% down · 7.5% · 30yr · 1.5% tax · 5.0% vac · 8.0% maint · 8.0% mgmt
Financing live
Cash to close
- Down payment
- $62,500
- Closing costs
- $7,500
- Reserves months
- —
- Total cash needed
- —
Loan-product check · same deal, 3 products live
Conventional
25% down · 7.5% · 30yr
- Down + closing
- —
- Monthly P&I
- —
- Monthly cashflow
- —
- DSCR
- —
- Eligible?
- —
Personal DTI + credit; lowest rate.
DSCR
20% down · 8.5% · 30yr
- Down + closing
- —
- Monthly P&I
- —
- Monthly cashflow
- —
- DSCR
- —
- Eligible?
- —
No personal income docs; deal must DSCR.
Hard money
10% down · 12.0% · 12mo
- Down + closing
- —
- Monthly P&I
- —
- Monthly cashflow
- —
- DSCR
- —
- Eligible?
- —
Short-term bridge; refi at stabilization.
Rent comps 40 comps
| Address | Beds | Baths | Sqft | Rent | $/sqft | DOM | Units | Dist |
|---|---|---|---|---|---|---|---|---|
| 776 Metropolitan Pkwy SW Atlanta, GA | 2.0–3.0 | 2.0–3.0 | 1212 | $2,165 | $1.79 | 1d | 6 | 0.06mi |
| 806 Murphy Ave SW Atlanta, GA | 1.0–2.0 | 1.0 | 825 | $1,254 | $1.52 | 24d | 8 | 0.28mi |
| 806 Murphy Ave SW Atlanta, GA | 1.0 | 1.0 | 731 | $1,254 | $1.72 | 7d | 3 | 0.28mi |
| 710 McDaniel St SW Unit 1 Atlanta, GA | 1.0 | 1.0 | 600 | $1,100 | $1.83 | 24d | 1 | 0.36mi |
| 840 Smith St SW Unit A Atlanta, GA | 2.0 | 1.5 | 910 | $1,550 | $1.70 | 16d | 1 | 0.36mi |
| 404 Bass St SW Atlanta, GA | 3.0 | 2.0 | 1080 | $1,850 | $1.71 | 16d | 1 | 0.38mi |
| 717 Lee St SW Atlanta, GA | 1.0–2.0 | 1.0 | 768 | $1,416 | $1.84 | 2d | 5 | 0.48mi |
| 565 Northside Dr SW Atlanta, GA | 1.0 | 1.0 | 675 | $1,700 | $2.52 | 3d | 6 | 0.51mi |
| 725 Catherine St SW Unit 1 Atlanta, GA | 1.0 | 1.0 | 651 | $1,400 | $2.15 | 15d | 1 | 0.54mi |
| 725 Catherine St SW Unit 1 Atlanta, GA | 1.0 | 1.0 | 600 | $1,195 | $1.99 | 24d | 1 | 0.54mi |
| 600 Mayland Ave SW Atlanta, GA | 3.0 | 2.0 | 1100 | $2,300 | $2.09 | 24d | 1 | 0.58mi |
| 1133 Mayland Cir SW Atlanta, GA | 3.0 | 2.0 | 1120 | $3,600 | $3.21 | 24d | 1 | 0.62mi |
| 801 Joseph E Lowery Blvd SW #2 Atlanta, GA | 1.0 | 1.0 | 560 | $1,450 | $2.59 | 24d | 1 | 0.63mi |
| 420 Rawson St SW Atlanta, GA | 1.0 | 1.0 | 700 | $950 | $1.36 | 24d | 1 | 0.72mi |
| 510 Whitehall St SW Unit 103 Atlanta, GA | 1.0 | 1.0 | 748 | $1,645 | $2.20 | 7d | 1 | 0.72mi |
| 574 Cooper St SW Atlanta, GA | 1.0 | 1.0 | 800 | $900 | $1.12 | 20d | 1 | 0.73mi |
| 1180 Sims St SW Atlanta, GA | 2.0 | 1.0 | 772 | $1,100 | $1.42 | 24d | 1 | 0.75mi |
| 818 Peeples St SW Atlanta, GA | 2.0 | 1.0 | 936 | $1,500 | $1.60 | 24d | 1 | 0.76mi |
| 561 Formwalt St SW Atlanta, GA | 2.0 | 2.0 | 1000 | $1,600 | $1.60 | 24d | 1 | 0.77mi |
| 396 Rawson St SW Unit 12 Atlanta, GA | 2.0 | 1.0 | 675 | $2,100 | $3.11 | 4d | 1 | 0.77mi |
| 1187 McDaniel St SW Unit B Atlanta, GA | 2.0 | 1.0 | 1038 | $1,025 | $0.99 | 12d | 1 | 0.79mi |
| 1178 Garibaldi St SW Atlanta, GA | 1.0 | 1.0 | 650 | $950 | $1.46 | 24d | 1 | 0.84mi |
| 1148 Booker Ave SW Atlanta, GA | 1.0 | 1.0 | 1012 | $900 | $0.89 | 16d | 1 | 0.86mi |
| 346 Peters St SW #208 Atlanta, GA | 1.0 | 1.0 | 756 | $2,050 | $2.71 | 16d | 1 | 0.86mi |
| 346 Peters St SW #102 Atlanta, GA | 2.0 | 1.0 | 1080 | $3,150 | $2.92 | 18d | 1 | 0.86mi |
| 1246 Allene Ave SW Atlanta, GA | 2.0 | 1.0–2.0 | 896 | $2,110 | $2.35 | 1d | 23 | 0.88mi |
| 600 Greensferry Ave SW Atlanta, GA | 1.0–3.0 | 1.0–2.0 | 949 | $1,262 | $1.33 | 7d | 16 | 0.91mi |
| 502 Pryor St SW #317 Atlanta, GA | 1.0 | 1.0 | 750 | $1,350 | $1.80 | 24d | 1 | 0.94mi |
| 518 Erin Ave SW Atlanta, GA | 2.0 | 1.0 | 1075 | $2,500 | $2.33 | 18d | 1 | 0.94mi |
| 23 Larkin Pl SW Atlanta, GA | 1.0–2.0 | 1.0–2.0 | 1011 | $2,129 | $2.10 | 1d | 14 | 0.96mi |
| 2159 M L King Jr DR SW Atlanta, GA | 1.0 | 1.0 | 1050 | $800 | $0.76 | 3d | 1 | 0.97mi |
| 973 Lawton St SW Atlanta, GA | 3.0 | 1.0 | 912 | $1,575 | $1.73 | 7d | 1 | 1.01mi |
| 825 Erin Ave SW Atlanta, GA | 2.0 | 1.0 | 776 | $3,000 | $3.87 | 24d | 1 | 1.04mi |
| 865 Hank Aaron Dr SE Unit 103 Atlanta, GA | 2.0 | 1.0 | 650 | $1,250 | $1.92 | 24d | 1 | 1.08mi |
| 238 Walker St SW Atlanta, GA | 1.0–2.0 | 1.0–2.5 | 1550 | $2,685 | $1.73 | 13d | 2 | 1.09mi |
| 875 Hank Aaron Dr SW Atlanta, GA | 1.0–3.0 | 1.0–2.0 | 916 | $1,460 | $1.59 | 24d | 1 | 1.10mi |
| 210 Walker St SW #1 Atlanta, GA | 1.0 | 1.0 | 650 | $1,500 | $2.31 | 4d | 1 | 1.13mi |
| 1084 Cordova St SW Atlanta, GA | 2.0 | 1.0 | 750 | $1,295 | $1.73 | 18d | 1 | 1.13mi |
| 1180 Richland Rd SW Atlanta, GA | 3.0 | 2.0 | 1082 | $2,800 | $2.59 | 24d | 1 | 1.13mi |
| 210 Peters St SW Atlanta, GA | 1.0–2.0 | 1.0–2.0 | 1033 | $2,321 | $2.25 | 2d | 21 | 1.14mi |
Listing history 11 events
-
2026-06-04days on market $250,000 Active 117 DOM
-
2026-06-03days on market $250,000 Active 116 DOM
-
2026-06-02days on market $250,000 Active 115 DOM
-
2026-06-01days on market $250,000 Active 114 DOM
-
2026-05-31days on market $250,000 Active 113 DOM
-
2026-03-04price $250,000 570-char remark
Show marketing remark (570 chars)
Welcome to 797 Beryl St, a fully occupied duplex producing $2,150/month in total rental income from day one. This is a turnkey opportunity for investors looking for immediate cash flow in a high-demand, in-town location. Situated just minutes from Downtown and Midtown Atlanta, this property benefits from strong rental demand and long-term upside as the surrounding area continues to grow. Both units are currently occupied, making this an ideal buy-and-hold investment with consistent income and minimal downtime.Tenant occupied - Please do not disturb the tenants.
-
2026-02-07$260,000 New 570-char remark
Show marketing remark (570 chars)
Welcome to 797 Beryl St, a fully occupied duplex producing $2,150/month in total rental income from day one. This is a turnkey opportunity for investors looking for immediate cash flow in a high-demand, in-town location. Situated just minutes from Downtown and Midtown Atlanta, this property benefits from strong rental demand and long-term upside as the surrounding area continues to grow. Both units are currently occupied, making this an ideal buy-and-hold investment with consistent income and minimal downtime.Tenant occupied - Please do not disturb the tenants.
-
2026-02-07$260,000 Active 570-char remark
Show marketing remark (570 chars)
Welcome to 797 Beryl St, a fully occupied duplex producing $2,150/month in total rental income from day one. This is a turnkey opportunity for investors looking for immediate cash flow in a high-demand, in-town location. Situated just minutes from Downtown and Midtown Atlanta, this property benefits from strong rental demand and long-term upside as the surrounding area continues to grow. Both units are currently occupied, making this an ideal buy-and-hold investment with consistent income and minimal downtime.Tenant occupied - Please do not disturb the tenants.
-
2017-09-26soldstatus $25,000
-
1990-10-22soldstatus $6,000
ⓘ Source: listings_history table (triggers on properties + properties_extension) + one-shot
backfill from property_details.listing_events for pre-trigger history.
Tax reassessment forecast GA · Resets to sale price
- Current annual tax
- $3,168 · $264/mo
- Projected year-2 tax
- $3,168 · $264/mo
- Expected delta
- $0/yr ($0/mo · 0.0%)
ⓘ Screening estimate from a state-policy table — verify with the county assessor before closing.
Climate risk First Street
- Flood 1/10 Low FEMA zone X (unshaded) · 0% chance over 30 yrs
- Wildfire 1/10 Low
- Heat 5/10 Major 7 d/yr ≥104°F today · 18 d/yr by 30 yrs out
- Wind 4/10 Moderate 22% chance of damaging wind over 30 yrs
- Air quality 4/10 Moderate 4 unhealthy d/yr today · 6 by 30 yrs out
Nearby sold comps map
Loading sold comps map…
Walkable amenities ~0.75 mi
Loading nearby amenities…
Taxation est. · year 1
- Rental income
- $32,700
- − Mortgage interest
- −$14,004
- − Property taxes
- −$3,168
- − Insurance
- −$1,250
- − Repairs & maintenance
- −$2,616
- − Management
- −$2,616
- − Depreciation
- −$7,273
- Taxable income
- $1,773
- Est. tax owed @ 24.0%
- −$426
- After-tax cash flow
- $5,257/yr
For passive investors: Depreciation is non-cash, so a rental often shows a tax loss while cash-flowing — sheltering income. Rental losses are passive: they offset passive income freely, and up to $25,000/yr can offset ordinary (W-2) income if you actively participate and your MAGI is under $100k (phasing out to $0 by $150k); unused losses carry forward. On sale, claimed depreciation is recaptured at up to 25%, and gains may owe capital-gains tax (a 1031 exchange can defer both). Figures are a year-1 estimate at your 24.0% rate — not tax advice; consult a CPA.
Schools (NCES district)
- District
- Atlanta Public Schools
- NCES district ID
- 1300120
- Math proficiency
- 28% ▼ -6.00%
- Reading proficiency
- 35% ▼ -2.00%
- Median HH income
- $48,306
- Composite
- 27.27/100
- National rank
- #7006
- State rank
- #80 of 174 in GA
Livability — Atlanta
- Score
- 83/100
- State rank
- #6
- US rank
- #919
Category grades
Schools grade is shown separately in the Schools card above.
Census & demographics
- Census place
- Atlanta, GA
- County
- Fulton County · 1,094,430 people
- City population
- 629,525
- Metro
- Atlanta-Sandy Springs-Alpharetta, GA
- Population (ZIP)
- 27,186
- Household income
- $53,037
- Rent vs Own
- Severe rent burden
- 1676.0
Population outlook (Fulton County) Hauer SSP2
- Today (2025)
- 1,203,707 people
- By 2030
- 1,299,706 · +8.0%
- By 2040
- 1,488,256 · +23.6%
- By 2050
- 1,664,580 · +38.3%
- By 2075
- 2,036,072 · +69.2%
- By 2100
- 2,222,402 · +84.6%
Race, ethnicity, and origin ACS 2023
- Neighborhood character
- Predominantly Black (76%)
- Race & ethnicity
- Black 76% White 14% Two or more races 4% Hispanic / Latino 4% Asian 2%
- Common ancestry
- Lithuanian 1% Slovak 1% Serbian 0%
- Foreign-born
- 5% · Canada, South Korea, Vietnam
- Languages at home
- 92% English-only · Spanish 4% French/Haitian/Cajun 1% Other Indo-European 1%
Political lean MEDSL · Fulton
- 2024 margin
- Solid D (+44.9) · D 71.9% · R 27.0% · Other 1.1%
- 2008→2024 swing
- +9.8pp toward D · 2008: 35.0pp · 2024: 44.9pp
- All cycles
- 2024: D+44.9 2020: D+46.4 2016: D+42.1 2012: D+29.6 2008: D+35.0
Not yet ingested
- Civics
- —
Market trends
- HPI YoY
- ▼ -204.00%
- Current HPI
- 418.7297
- Rent YoY
- ▲ 2.77%
- Metro
- Atlanta-Sandy Springs-Alpharetta, GA
- State GDP YoY
- ▲ 2.66%
- F500 in state
- 28
Industry mix (Fortune 500 HQ in GA)
| Industry | F500 HQs | Revenue |
|---|---|---|
| Paper / Packaging | 2 | $29B |
|
||
| Retail | 1 | $160B |
|
||
| Transportation / Logistics | 1 | $91B |
|
||
| Airlines | 1 | $62B |
|
||
| Consumer Goods | 1 | $47B |
|
||
| Utilities | 1 | $25B |
|
||
Price history
+4066.7% since first listed6 events — show timeline
- 2026-03-04 Price Changed $250,000 GAMLS
- 2026-03-04 Price Changed $250,000 FMLS
- 2026-02-07 Listed $260,000 FMLS
- 2026-02-07 Listed $260,000 GAMLS
- 2017-09-26 Sold (Public Records) $25,000 Public Records
- 1990-10-22 Sold (Public Records) $6,000 Public Records
Property tax history
+12.8%/yrLatest (2025): $3,168 · +6.4% YoY. Source: county tax records.
Cash-flow waterfall
monthlySold comps — $/sqft
last 12 mo · ≤1 miLoading sold comps…