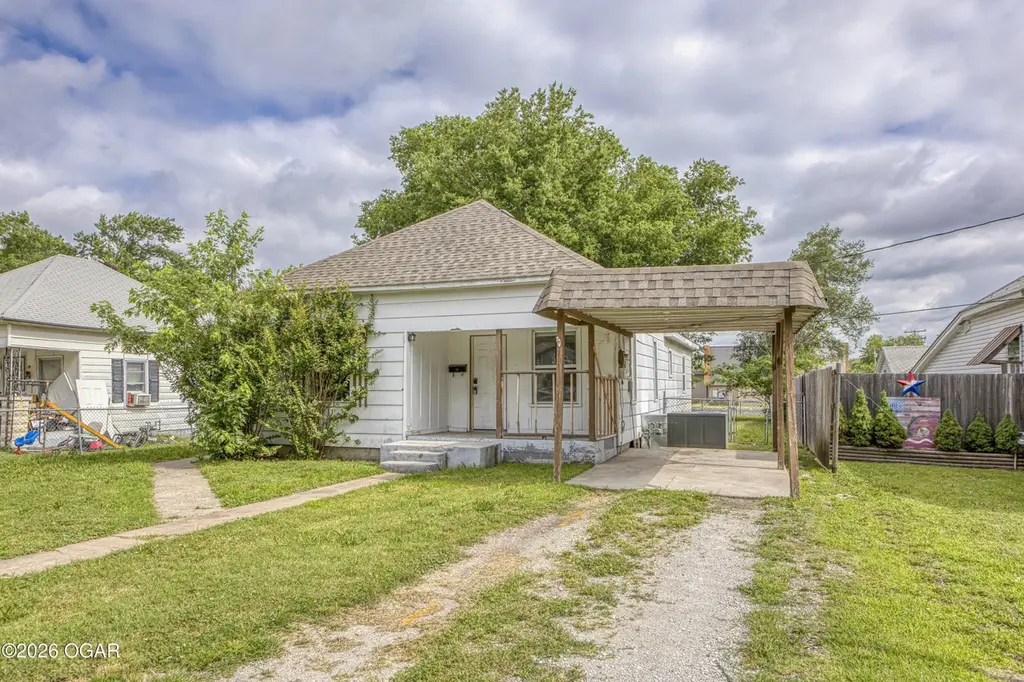
1207 W 7th St · Webb City, MO
Flood risk 1/10 · Minimal
- FEMA flood zone
- X (unshaded)
- Chance of flooding over 30 yrs
- 0.0%
- Est. flood insurance / yr
- $507 – $1,088
Fire risk 3/10 · Minor
- Est. fire insurance / yr
- $1,054 – $1,958
Heat risk 5/10 · Moderate
- Hot days now (above 106°F)
- 7 days/yr
- Hot days in 30 yrs
- 20 days/yr
Wind risk 2/10 · Minimal
- Chance of severe wind over 30 yrs
- 2.0%
Air-quality risk 2/10 · Minimal
- Unhealthy air days now
- 1 days/yr
- Unhealthy air days in 30 yrs
- 1 days/yr
Risk factors via First Street. Map © Google.
Why this score? — see what drove the C grade
The composite is a weighted blend of 9 inputs, each scored 0–100. Each bar is that input's sub-score; the figure is the points it added to the 100-point composite (weight × sub-score).
- Cash flow +23.3/30.0
- DSCR +7.5/10.0
- ARV discount +7.5/15.0
- 1% rule +4.8/10.0
- Schools +4.8/10.0
- Livability +3.9/5.0
- Rent growth +3.1/5.0
- Condition / age +2.5/5.0
- Appreciation +0.0/10.0
$159,900
🖨 Deal sheet 📄 Offer letter ✓ Due diligence
Listing remarks
Welcome home to 1207 W 7th Street! This charming 4-bedroom, 2-bath residence in Webb City offers 1,288 sqft of living space with spacious rooms throughout. Located just minutes from Webb City High School, local restaurants, and with quick access to the highway, convenience is at your doorstep. Whether you're looking for your first home, expanding for more space, or a great investment property, this home combines comfort and location in one great package. Don't miss a chance to see all this home has to offer and schedule a private tour today!
Key facts
- 9,147 sq ft lot
- Parking
- Built 1920
Property features AI
Exterior
- Parking: 1-car attached carport
- Security: Smoke detector(s)
- Utilities: Public sewer
- Home design: Single-family residence (freestanding)
- Construction: Block foundation; Shingle roof; Built area above grade: 1,288
- Exterior features: Covered patio/porch; Patio; Porch; Chain link fencing; Level topography
Interior
- Kitchen: Electric range; Dishwasher
- Bedrooms: Total rooms: 8
- Flooring: Carpet; Laminate
- Bathrooms: 2 full bathrooms
- Heating & cooling: Central heating; Natural gas heating; Ceiling fan cooling
- Interior features: Ceiling fan(s); Smoke detector(s)
Neighborhood map
What this means for you Summary
Snapshot
- This is a 4-bed/2.0-bath other listed at $160k.
Deal economics
- At list price, monthly cash flow is $294 ($4k/yr) — positive.
- The deal already cash-flows at list — no discount required.
- To meet the 1% rule (rent ≥ 1% of price), the offer needs to be $156k (2.4% below list).
- Recommended offer: $156k (2.4% below list) — sets the bar for 1% rule.
Location & tenants
- Location reads 77/100 on livability (#35 in MO, #3,062 nationally) — a middle-class / working-renter tenant base. Strengths: cost of living A+, housing A+, health & safety A+; Watch: employment C-, amenities D-, commute F.
- Webb City R-VII (suburban): math 53% / reading 60% proficiency, ranked #21 of 324 in MO (top 6%) — acceptable for families but not a draw, mixed tenant base, ~2y average lease.
- Zoned schools: Webb City Middle (math 53% / reading 55%, grade B-, #46 of 391 statewide, top 12%, 696 students, 47% FRL).
- Market conditions: Rents rising (+2.5%/yr); 122 active listings in the ZIP; 11 comparable units currently listed for rent nearby; rentals lingering (median 44d on market — plan ~5-8 weeks vacancy on turnover, expect pricing pressure); 73% of comp listings sitting > 30 days — soft ceiling on asking rent; 602 units permitted in Jasper County in 2024 (0 in 5+ unit buildings).
Forward outlook
- Local home prices are declining (-3.0%/yr); year-one equity from $1k of loan paydown is wiped out by about $5k of value loss. Plan a longer hold.
Negotiation context
- Only 4 days on market — expect competitive offers; lowballing is unlikely to land.
- 7 sale attempts since 6y ago with the ask held roughly flat each time — persistent listings suggest the price (not the market) is what's stuck; bring a comps-based counter.
Risks & watch-outs
- Watch-outs: built in 1920 — expect roof / HVAC / electrical / plumbing capex.
- Climate carrying-cost: extreme-heat days projected 7→20/yr by 2055 (HVAC capex compounding) — expect insurance premiums to compound above CPI over the hold.
Questions for the listing agent
- Built in 1920 — when were the roof, HVAC, electrical panel, plumbing, and water heater last replaced?
- Is there a deadline driving the sale (1031 exchange, divorce, estate, relocation)? That informs how much negotiation room exists.
- Schools are B-rated — typically a magnet for longer-tenancy family renters. What's the average tenant stay here, and is there a school-zone premium baked into asking?
- What's the average days-on-market for RENTAL listings here right now (not sales)? A rising rental-DOM trend means longer vacancies and softer asking-rent achievability than the comps imply.
- What's the recent tenant-quality profile in this submarket — average credit score on applications, eviction rate, late-payment / NSF rate, and stable-employment percentage? A property-management company in the area should have these aggregated.
- How much new for-sale + rental construction is in the pipeline within 1–3 miles? Heavy new supply typically softens prices + rents 12–24 months out; constrained supply supports both.
Investment metrics
- 1% rule
- 0.98% ✗
- Cap rate
- 8.50%
- Cash-on-cash
- 7.87%
- DSCR
- 1.35
- GRM
- 8.5
CMA / ARV
No comps found within radius.
Projected returns pro-forma
-3.0% appreciation · 2.49% rent growth · sell at horizon
- IRR
- -4.9%
- Equity multiple
- 0.82×
- Total profit
- $-8,084
- Equity at exit
- $23,842
- IRR
- 4.2%
- Equity multiple
- 1.30×
- Total profit
- $13,489
- Equity at exit
- $13,825
Cash invested: $44,772 (down + closing). Projections, not guarantees.
Landlord ↔ Tenant lean methodology
- Overall (STATE)
- 81 Strongly Landlord-Friendly
- State Missouri
- 81 Strongly Landlord-Friendly · R+10
- County
- — inherits STATE
- City
- — inherits STATE
ZIP-level market 64870
- Home prices YoY
- -8.3%
- Rents YoY
- 2.5%
- Active inventory
- 122
- Price-to-rent
- 8.5×
Monthly cashflow live
- Estimated rent
- $1,561 high interval (Pro) →
- Mortgage (P&I)
- −$839
- Tax from tax record
- −$34 /mo · $409/yr
- Insurance
- −$67
- HOA
- −$0
- Vacancy / Maint / Mgmt
- −$328
- Net cashflow
- $294
Break-even live
UW: 25.0% down · 7.5% · 30yr · 1.5% tax · 5.0% vac · 8.0% maint · 8.0% mgmt
Financing live
Cash to close
- Down payment
- $39,975
- Closing costs
- $4,797
- Reserves months
- —
- Total cash needed
- —
Loan-product check · same deal, 3 products live
Conventional
25% down · 7.5% · 30yr
- Down + closing
- —
- Monthly P&I
- —
- Monthly cashflow
- —
- DSCR
- —
- Eligible?
- —
Personal DTI + credit; lowest rate.
DSCR
20% down · 8.5% · 30yr
- Down + closing
- —
- Monthly P&I
- —
- Monthly cashflow
- —
- DSCR
- —
- Eligible?
- —
No personal income docs; deal must DSCR.
Hard money
10% down · 12.0% · 12mo
- Down + closing
- —
- Monthly P&I
- —
- Monthly cashflow
- —
- DSCR
- —
- Eligible?
- —
Short-term bridge; refi at stabilization.
Rent comps 11 comps
| Address | Beds | Baths | Sqft | Rent | $/sqft | DOM | Units | Dist |
|---|---|---|---|---|---|---|---|---|
| 1407 S Jefferson Ave Webb City, MO | 3.0 | 2.0 | 1424 | $1,650 | $1.16 | 43d | 1 | 0.44mi |
| 1411 S Jefferson Ave Webb City, MO | 3.0 | 2.0 | 1424 | $1,650 | $1.16 | 43d | 1 | 0.44mi |
| 1301 S Jefferson St Webb City, MO | 3.0 | 2.0 | 1424 | $1,650 | $1.16 | 43d | 1 | 0.46mi |
| 1606 S Oronogo St Webb City, MO | 3.0 | 1.0 | 1200 | $1,200 | $1.00 | 43d | 1 | 0.78mi |
| 1613 S Oronogo St Webb City, MO | 3.0 | 2.0 | 1310 | $1,400 | $1.07 | 43d | 1 | 0.83mi |
| 1524 Brewster Ln Webb City, MO | 3.0 | 2.0 | 1310 | $1,450 | $1.11 | 43d | 1 | 0.87mi |
| 214 S Tom St Webb City, MO | 3.0 | 2.0 | 1556 | $1,400 | $0.90 | 20d | 1 | 0.93mi |
| 1405 W Aylor St Webb City, MO | 4.0 | 2.0 | 1460 | $1,450 | $0.99 | 43d | 1 | 1.02mi |
| 737 N Oak St Webb City, MO | 3.0 | 2.0 | 1180 | $1,400 | $1.19 | 43d | 1 | 1.09mi |
| 618 N Hall St Unit A Webb City, MO | 3.0 | 2.0 | 1250 | $1,400 | $1.12 | 20d | 1 | 1.30mi |
| 612 Easton Unit B Webb City, MO | 3.0 | 2.0 | 1560 | $1,300 | $0.83 | 20d | 1 | 1.36mi |
Listing history 4 events
-
2026-06-13statusdays on market $159,900 Pending 4 DOM
-
2026-06-10days on market $159,900 Active 2 DOM
-
2026-06-09remarks 547-char remark
-
2026-06-09$159,900 Active 1 DOM
ⓘ Source: listings_history table (triggers on properties + properties_extension) + one-shot
backfill from property_details.listing_events for pre-trigger history.
Tax reassessment forecast MO · Resets to sale price
- Current annual tax
- $409 · $34/mo
- Projected year-2 tax
- $1,551 · $129/mo
- Expected delta
- +$1,142/yr (+$95/mo · 279.1%)
ⓘ Screening estimate from a state-policy table — verify with the county assessor before closing.
Climate risk First Street
- Flood 1/10 Low FEMA zone X (unshaded) · 0% chance over 30 yrs
- Wildfire 3/10 Moderate
- Heat 5/10 Major 7 d/yr ≥106°F today · 20 d/yr by 30 yrs out
- Wind 2/10 Low 2% chance of damaging wind over 30 yrs
- Air quality 2/10 Low 1 unhealthy d/yr today · 1 by 30 yrs out
Nearby sold comps map
Loading sold comps map…
Walkable amenities ~0.75 mi
Loading nearby amenities…
Taxation est. · year 1
- Rental income
- $18,727
- − Mortgage interest
- −$8,957
- − Property taxes
- −$409
- − Insurance
- −$800
- − Repairs & maintenance
- −$1,498
- − Management
- −$1,498
- − Depreciation
- −$4,652
- Taxable income
- $914
- Est. tax owed @ 24.0%
- −$219
- After-tax cash flow
- $3,304/yr
For passive investors: Depreciation is non-cash, so a rental often shows a tax loss while cash-flowing — sheltering income. Rental losses are passive: they offset passive income freely, and up to $25,000/yr can offset ordinary (W-2) income if you actively participate and your MAGI is under $100k (phasing out to $0 by $150k); unused losses carry forward. On sale, claimed depreciation is recaptured at up to 25%, and gains may owe capital-gains tax (a 1031 exchange can defer both). Figures are a year-1 estimate at your 24.0% rate — not tax advice; consult a CPA.
Schools (NCES district)
- District
- Webb City R-VII
- NCES district ID
- 2931500
- Math proficiency
- 53% ▼ -1.00%
- Reading proficiency
- 60% ▼ -1.00%
- Median HH income
- $45,022
- Composite
- 47.68/100
- National rank
- #2244
- State rank
- #21 of 324 in MO
Livability — Webb City
- Score
- 77/100
- State rank
- #35
- US rank
- #3062
Category grades
Schools grade is shown separately in the Schools card above.
Census & demographics
- Census place
- Webb City, MO
- County
- Jasper County · 79,035 people
- City population
- 16,186
- Metro
- Joplin, MO
- Population (ZIP)
- 16,186
- Household income
- $68,300
- Rent vs Own
- Severe rent burden
- 427.0
Population outlook (Jasper County) Hauer SSP2
- Today (2025)
- 120,033 people
- By 2030
- 120,091 · +0.0%
- By 2040
- 119,297 · -0.6%
- By 2050
- 117,705 · -1.9%
- By 2075
- 110,402 · -8.0%
- By 2100
- 99,719 · -16.9%
Race, ethnicity, and origin ACS 2023
- Neighborhood character
- Predominantly White (86%)
- Race & ethnicity
- White 86% Two or more races 8% Hispanic / Latino 4% Asian 2% Black 2%
- Common ancestry
- Lithuanian 2% Slovak 2% Italian 2%
- Foreign-born
- 2% · Canada, China
- Languages at home
- 98% English-only · Spanish 1%
Political lean MEDSL · Jasper
- 2024 margin
- Solid R (+46.8) · D 25.9% · R 72.7% · Other 1.4%
- 2008→2024 swing
- -13.6pp toward R · 2008: -33.2pp · 2024: -46.8pp
- All cycles
- 2024: R+46.8 2020: R+46.2 2016: R+50.8 2012: R+41.0 2008: R+33.2
Not yet ingested
- Civics
- —
Market trends
- HPI YoY
- ▼ -24.29%
- Current HPI
- 267.5318
- Rent YoY
- ▲ 2.49%
- Metro
- Joplin, MO
- State GDP YoY
- ▲ 1.84%
- F500 in state
- 20
Industry mix (Fortune 500 HQ in MO)
| Industry | F500 HQs | Revenue |
|---|---|---|
| Healthcare | 1 | $163B |
|
||
| Insurance | 1 | $21B |
|
||
| Industrial Technology | 1 | $17B |
|
||
| Retail | 1 | $16B |
|
||
| Industrial Distribution | 1 | $10B |
|
||
| Utilities | 1 | $9B |
|
||
Price history
+77.9% since first listed24 events — show timeline
- 2026-06-08 Listed $159,900 OGAR
- 2025-06-13 Rental Removed $1,250 TENANTTURNER2
- 2025-06-05 Listing Removed — Heartland MLS as Distributed by MLS Grid
- 2025-06-04 Price Changed $1,250 TENANTTURNER2
- 2025-05-03 Price Changed $1,375 TENANTTURNER2
- 2025-05-01 Rental Removed $1,400 APPFOLIO
- 2025-05-01 Listed for Rent $1,400 TENANTTURNER2
- 2025-04-16 Listed for Rent $1,400 APPFOLIO
- 2025-02-27 Price Changed $163,658 OGAR
- 2025-02-27 Price Changed $163,658 Heartland MLS as Distributed by MLS Grid
- 2025-02-27 Price Changed $163,658 NWARMLS
- 2024-12-05 Listed $168,658 Heartland MLS as Distributed by MLS Grid
- 2024-10-22 Listing Removed — Heartland MLS as Distributed by MLS Grid
- 2024-09-25 Listed $168,658 Heartland MLS as Distributed by MLS Grid
- 2022-08-09 Price Changed $1,375 RENT.
- 2022-06-03 Delisted — OGAR
- 2022-06-02 Sold (MLS) — OGAR
- 2022-05-02 Delisted — OGAR
- 2022-04-19 Listed $130,000 OGAR
- 2020-05-05 Sold (Public Records) — Public Records
- 2020-04-30 Sold (MLS) — OGAR
- 2020-03-19 Listed $89,900 OGAR
- 2020-01-10 Sold (Public Records) — Public Records
- 2003-01-02 Sold (Public Records) — Public Records
Property tax history
+2.5%/yrLatest (2025): $409 · +10.7% YoY. Source: county tax records.
Cash-flow waterfall
monthlySold comps — $/sqft
last 12 mo · ≤1 miLoading sold comps…