1121 Plum · Floresville, TX
Flood risk 1/10 · Minimal
- FEMA flood zone
- X (unshaded)
- Chance of flooding over 30 yrs
- 0.0%
- Est. flood insurance / yr
- $507 – $1,088
Fire risk 4/10 · Minor
- Est. fire insurance / yr
- $1,222 – $2,270
Heat risk 8/10 · Major
- Hot days now (above 110°F)
- 7 days/yr
- Hot days in 30 yrs
- 21 days/yr
Wind risk 8/10 · Major
- Chance of severe wind over 30 yrs
- 80.0%
Air-quality risk 1/10 · Minimal
- Unhealthy air days now
- 0 days/yr
- Unhealthy air days in 30 yrs
- 0 days/yr
Risk factors via First Street. Map © Google.
Why this score? — see what drove the C grade
The composite is a weighted blend of 9 inputs, each scored 0–100. Each bar is that input's sub-score; the figure is the points it added to the 100-point composite (weight × sub-score).
- Cash flow +19.9/30.0
- ARV discount +14.4/15.0
- DSCR +6.3/10.0
- 1% rule +5.1/10.0
- Livability +3.2/5.0
- Schools +3.0/10.0
- Rent growth +2.5/5.0
- Condition / age +2.5/5.0
- Appreciation +0.0/10.0
$160,000
🖨 Deal sheet 📄 Offer letter ✓ Due diligence
Listing remarks MLS
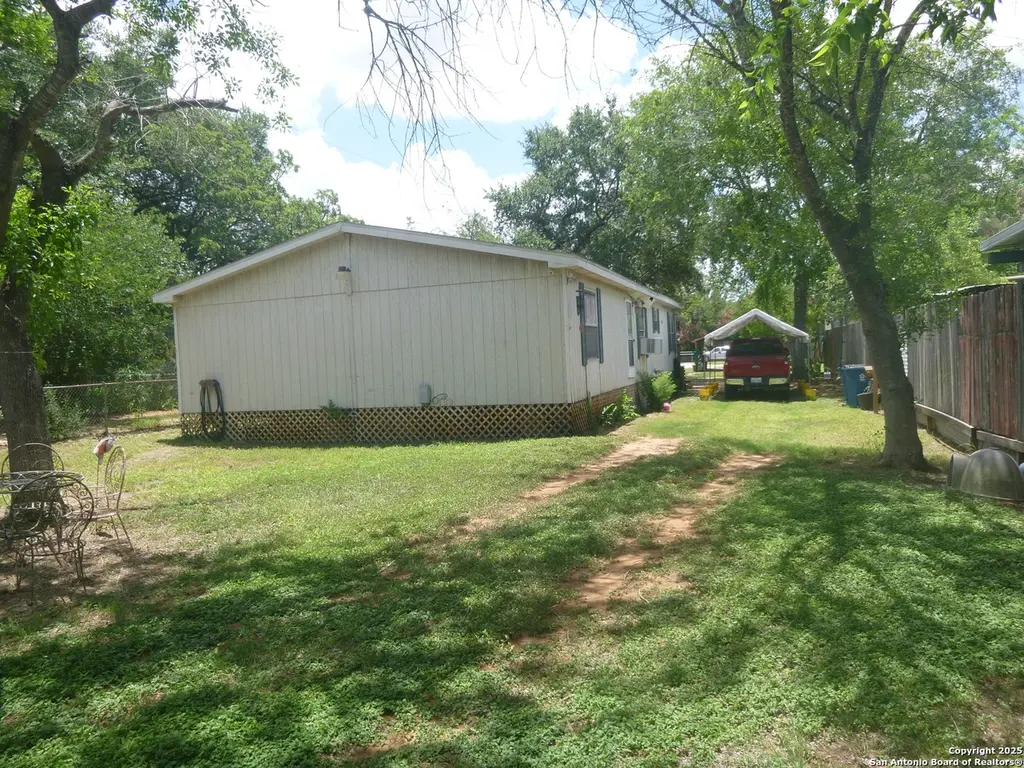
For Those Who Wants To Get Away From The Noisy City Life, Come & Experience The Nice & Quiet Small Town Living, This Well Kept Double Wide Mobile Home Sits On Almost 1/2 An Acre Of Fully Fenced Level Land, Comes With 3 Bedrooms & 2 Full Baths, Gorgeous Kitchen With Center Island Overlooking The Spacious Living Room. Inside Laundry Room , Central A/C -Heating System. Easy Access To Hwy 181, Shopping Mall, Schools & Parks.
Key facts
- Gorgeous kitchen
- Inside laundry room
- Center island
Tags
Neighborhood map
What this means for you Summary
Snapshot
- This is a 3-bed/2.0-bath manufactured listed at $160k.
Deal economics
- At list price, monthly cash flow is $192 ($2k/yr) — positive.
- The deal already cash-flows at list — no discount required.
- Meets the 1% rule at list price ($2k rent vs $160k).
- Recommended offer: $141k (12.0% below list) — sets the bar for market timing.
- Cap rate 7.7% vs local median 2.0% in Floresville — top-decile yield for the area; either an underpriced asset or a hidden risk that comps aren't pricing in. Stress-test before assuming the spread holds.
Location & tenants
- Location reads 65/100 on livability (#681 in TX) — a middle-class / working-renter tenant base. Strengths: cost of living A+, housing A+, crime A-; Watch: employment D+, health & safety D+, amenities F.
- Floresville ISD (town): math 32% / reading 36% proficiency, ranked #504 of 826 in TX (top 61%) — families likely to look elsewhere, expect single-tenant / working-renter base with shorter leases.
- Market conditions: 302 active listings in the ZIP; 7 comparable units currently listed for rent nearby; rentals leasing fast (median 8d on market — plan ~1-2 weeks tenant-placement turnaround); solid renter incomes; 135 units permitted in Wilson County in 2024 (0 in 5+ unit buildings).
Forward outlook
- Local home prices are declining (-3.0%/yr); year-one equity from $1k of loan paydown is wiped out by about $5k of value loss. Plan a longer hold.
- Wilson County population projected at +46% by 2050 — long-run rental-demand tailwind backs the buy-and-hold thesis.
Negotiation context
- It's been on market 356 days — a 12% lower offer ($141k) is reasonable based on typical stale-listing flexibility.
Risks & watch-outs
- Climate carrying-cost: severe wind risk, 80% chance of damaging wind over 30y; extreme-heat days projected 7→21/yr by 2055 (HVAC capex compounding) — expect insurance premiums to compound above CPI over the hold.
Questions for the listing agent
- It's been on market 356 days. Have you received any prior offers? Is the seller open to a 12% concession, seller financing, or rate buy-down credit?
- Why hasn't it sold? Are there any deal-killer items the seller is aware of (foundation, flood, title, zoning, code violations)?
- Is there a deadline driving the sale (1031 exchange, divorce, estate, relocation)? That informs how much negotiation room exists.
- What's the average days-on-market for RENTAL listings here right now (not sales)? A rising rental-DOM trend means longer vacancies and softer asking-rent achievability than the comps imply.
- What's the recent tenant-quality profile in this submarket — average credit score on applications, eviction rate, late-payment / NSF rate, and stable-employment percentage? A property-management company in the area should have these aggregated.
- How much new for-sale + rental construction is in the pipeline within 1–3 miles? Heavy new supply typically softens prices + rents 12–24 months out; constrained supply supports both.
Investment metrics
- 1% rule
- 1.01% ✓
- Cap rate
- 7.73%
- Cash-on-cash
- 5.15%
- DSCR
- 1.23
- GRM
- 8.3
CMA / ARV
- ARV (median comp)
- $188,852
- List price
- $160,000
- Delta
- -15.28%
- Verdict
- UNDERPRICED
- Comps
- 20 within 1.0 mi
Show comp detail 1 sale within ~0.75 mi
| Address | Dist | Beds/Ba | Sqft | Sold | Price | $/sf | Match |
|---|---|---|---|---|---|---|---|
| 1331 Sutherland Spgs | 0.52mi | 3/2.0 | 1,568 (0%) | 6mo | $195,000 | $124 | 71 |
Match score weights: distance 35% · size 25% · config 20% · recency 20%. Top-matched comps best support the ARV.
Projected returns pro-forma
-3.0% appreciation · 3.0% rent growth · sell at horizon
- IRR
- -8.3%
- Equity multiple
- 0.69×
- Total profit
- $-13,672
- Equity at exit
- $23,857
- IRR
- 1.2%
- Equity multiple
- 1.09×
- Total profit
- $3,906
- Equity at exit
- $13,834
Cash invested: $44,800 (down + closing). Projections, not guarantees.
Landlord ↔ Tenant lean methodology
- Overall (STATE)
- 87 Strongly Landlord-Friendly
- State Texas
- 87 Strongly Landlord-Friendly · R+5
- County
- — inherits STATE
- City
- — inherits STATE
ZIP-level market 78114
- Home prices YoY
- -27.3%
- Active inventory
- 302
- Price-to-rent
- 8.3×
Monthly cashflow live
- Estimated rent
- $1,615 high interval (Pro) →
- Mortgage (P&I)
- −$839
- Tax from tax record
- −$178 /mo · $2,137/yr
- Insurance
- −$67
- HOA
- −$0
- Vacancy / Maint / Mgmt
- −$339
- Net cashflow
- $192
Break-even live
UW: 25.0% down · 7.5% · 30yr · 1.5% tax · 5.0% vac · 8.0% maint · 8.0% mgmt
Financing live
Cash to close
- Down payment
- $40,000
- Closing costs
- $4,800
- Reserves months
- —
- Total cash needed
- —
Loan-product check · same deal, 3 products live
Conventional
25% down · 7.5% · 30yr
- Down + closing
- —
- Monthly P&I
- —
- Monthly cashflow
- —
- DSCR
- —
- Eligible?
- —
Personal DTI + credit; lowest rate.
DSCR
20% down · 8.5% · 30yr
- Down + closing
- —
- Monthly P&I
- —
- Monthly cashflow
- —
- DSCR
- —
- Eligible?
- —
No personal income docs; deal must DSCR.
Hard money
10% down · 12.0% · 12mo
- Down + closing
- —
- Monthly P&I
- —
- Monthly cashflow
- —
- DSCR
- —
- Eligible?
- —
Short-term bridge; refi at stabilization.
Rent comps 7 comps
| Address | Beds | Baths | Sqft | Rent | $/sqft | DOM | Units | Dist |
|---|---|---|---|---|---|---|---|---|
| 1224 Plum St Floresville, TX | 3.0 | 2.0 | 1450 | $1,723 | $1.19 | 4d | 1 | 0.17mi |
| 905 4th St Floresville, TX | 2.0 | 1.0 | 1310 | $1,200 | $0.92 | 43d | 1 | 0.22mi |
| 809 8th St Floresville, TX | 3.0 | 1.0 | 1197 | $1,600 | $1.34 | 23d | 1 | 0.41mi |
| 1005 3rd St Floresville, TX | 3.0 | 2.0 | 1198 | $1,550 | $1.29 | 1d | 1 | 0.43mi |
| 925 6th St Floresville, TX | 4.0 | 1.0 | 1329 | $1,850 | $1.39 | 10d | 1 | 0.44mi |
| 1408 8th St Floresville, TX | 3.0 | 1.5 | 1262 | $1,500 | $1.19 | 1d | 1 | 0.93mi |
| 197 Middle Green Loop Floresville, TX | 3.0 | 2.0 | 1600 | $1,995 | $1.25 | 7d | 1 | 1.47mi |
Listing history 15 events
-
2026-06-18days on market $160,000 Active 356 DOM
-
2026-06-17days on market $160,000 Active 355 DOM
-
2026-06-16days on market $160,000 Active 354 DOM
-
2026-06-15days on market $160,000 Active 353 DOM
-
2026-06-13days on market $160,000 Active 351 DOM
-
2026-06-09days on market $160,000 Active 347 DOM
-
2026-06-08days on market $160,000 Active 346 DOM
-
2026-06-07days on market $160,000 Active 345 DOM
-
2026-06-04days on market $160,000 Active 342 DOM
-
2026-06-03days on market $160,000 Active 341 DOM
-
2026-06-02days on market $160,000 Active 340 DOM
-
2026-06-01days on market $160,000 Active 339 DOM
-
2026-05-31days on market $160,000 Active 338 DOM
-
2026-03-26price $160,000 444-char remark
Show marketing remark (444 chars)
For Those Who Wants To Get Away From The Noisy City Life, Come & Experience The Nice & Quiet Small Town Living, This Well Kept Double Wide Mobile Home Sits On Almost 1/2 An Acre Of Fully Fenced Level Land, Comes With 3 Bedrooms & 2 Full Baths, Gorgeous Kitchen With Center Island Overlooking The Spacious Living Room. Inside Laundry Room , Central A/C -Heating System. Easy Access To Hwy 181, Shopping Mall, Schools & Parks.
-
2025-06-27$175,000 New 444-char remark
Show marketing remark (444 chars)
For Those Who Wants To Get Away From The Noisy City Life, Come & Experience The Nice & Quiet Small Town Living, This Well Kept Double Wide Mobile Home Sits On Almost 1/2 An Acre Of Fully Fenced Level Land, Comes With 3 Bedrooms & 2 Full Baths, Gorgeous Kitchen With Center Island Overlooking The Spacious Living Room. Inside Laundry Room , Central A/C -Heating System. Easy Access To Hwy 181, Shopping Mall, Schools & Parks.
ⓘ Source: listings_history table (triggers on properties + properties_extension) + one-shot
backfill from property_details.listing_events for pre-trigger history.
Tax reassessment forecast TX · Resets to sale price
- Current annual tax
- $2,137 · $178/mo
- Projected year-2 tax
- $2,928 · $244/mo
- Expected delta
- +$791/yr (+$66/mo · 37.0%)
ⓘ Screening estimate from a state-policy table — verify with the county assessor before closing.
Climate risk First Street
- Flood 1/10 Low FEMA zone X (unshaded) · 0% chance over 30 yrs
- Wildfire 4/10 Moderate
- Heat 8/10 Severe 7 d/yr ≥110°F today · 21 d/yr by 30 yrs out
- Wind 8/10 Severe 80% chance of damaging wind over 30 yrs
- Air quality 1/10 Low 0 unhealthy d/yr today · 0 by 30 yrs out
Nearby sold comps map
Loading sold comps map…
Walkable amenities ~0.75 mi
Loading nearby amenities…
Taxation est. · year 1
- Rental income
- $19,384
- − Mortgage interest
- −$8,962
- − Property taxes
- −$2,137
- − Insurance
- −$800
- − Repairs & maintenance
- −$1,551
- − Management
- −$1,551
- − Depreciation
- −$4,655
- Taxable loss
- −$272
- Est. tax savings @ 24.0%
- +$65
- After-tax cash flow
- $2,372/yr
For passive investors: Depreciation is non-cash, so a rental often shows a tax loss while cash-flowing — sheltering income. Rental losses are passive: they offset passive income freely, and up to $25,000/yr can offset ordinary (W-2) income if you actively participate and your MAGI is under $100k (phasing out to $0 by $150k); unused losses carry forward. On sale, claimed depreciation is recaptured at up to 25%, and gains may owe capital-gains tax (a 1031 exchange can defer both). Figures are a year-1 estimate at your 24.0% rate — not tax advice; consult a CPA.
Schools (NCES district)
- District
- Floresville ISD
- NCES district ID
- 4819350
- Math proficiency
- 32% ▼ -14.00%
- Reading proficiency
- 36% ▼ -5.00%
- Median HH income
- $59,736
- Composite
- 30.44/100
- National rank
- #6234
- State rank
- #504 of 826 in TX
Livability — Floresville
- Score
- 65/100
- State rank
- #681
- US rank
- #12747
Category grades
Schools grade is shown separately in the Schools card above.
Census & demographics
- Census place
- Floresville, TX
- County
- Wilson County · 24,283 people
- City population
- 24,283
- Metro
- San Antonio-New Braunfels, TX
- Population (ZIP)
- 24,283
- Household income
- $88,087
- Rent vs Own
- Severe rent burden
- 400.0
Population outlook (Wilson County) Hauer SSP2
- Today (2025)
- 58,434 people
- By 2030
- 63,912 · +9.4%
- By 2040
- 74,704 · +27.8%
- By 2050
- 85,024 · +45.5%
- By 2075
- 111,025 · +90.0%
- By 2100
- 126,692 · +116.8%
Race, ethnicity, and origin ACS 2023
- Neighborhood character
- Majority Hispanic (51%)
- Race & ethnicity
- Hispanic / Latino 51% White 44% Two or more races 23% Black 2%
- Hispanic origin (detail)
- Mexican 46%
- Common ancestry
- Romanian 6% Italian 1% Lithuanian 1%
- Foreign-born
- 4% · Canada, Vietnam
- Languages at home
- 71% English-only · Spanish 27% Russian/Polish/Slavic 1%
Political lean MEDSL · Wilson
- 2024 margin
- Solid R (+53.7) · D 22.9% · R 76.6%
- 2008→2024 swing
- -19.8pp toward R · 2008: -33.9pp · 2024: -53.7pp
- All cycles
- 2024: R+53.7 2020: R+48.4 2016: R+47.8 2012: R+43.0 2008: R+33.9
Not yet ingested
- Civics
- —
Market trends
- HPI YoY
- ▼ -79.16%
- Current HPI
- 210.9474
- Rent YoY
- —
- Metro
- San Antonio-New Braunfels, TX
- State GDP YoY
- ▲ 3.95%
- F500 in state
- 110
Industry mix (Fortune 500 HQ in TX)
| Industry | F500 HQs | Revenue |
|---|---|---|
| Energy | 16 | $1,198B |
|
||
| Technology | 5 | $198B |
|
||
| Engineering / Construction | 4 | $72B |
|
||
| Energy Services | 3 | $60B |
|
||
| Utilities | 3 | $41B |
|
||
| Healthcare | 2 | $330B |
|
||
Price history
-8.6% since first listed2 events — show timeline
- 2026-03-26 Price Changed $160,000 LERA
- 2025-06-27 Listed $175,000 LERA
Property tax history
+4.0%/yrLatest (2025): $2,137 · +6.5% YoY. Source: county tax records.
Cash-flow waterfall
monthlySold comps — $/sqft
last 12 mo · ≤1 miLoading sold comps…