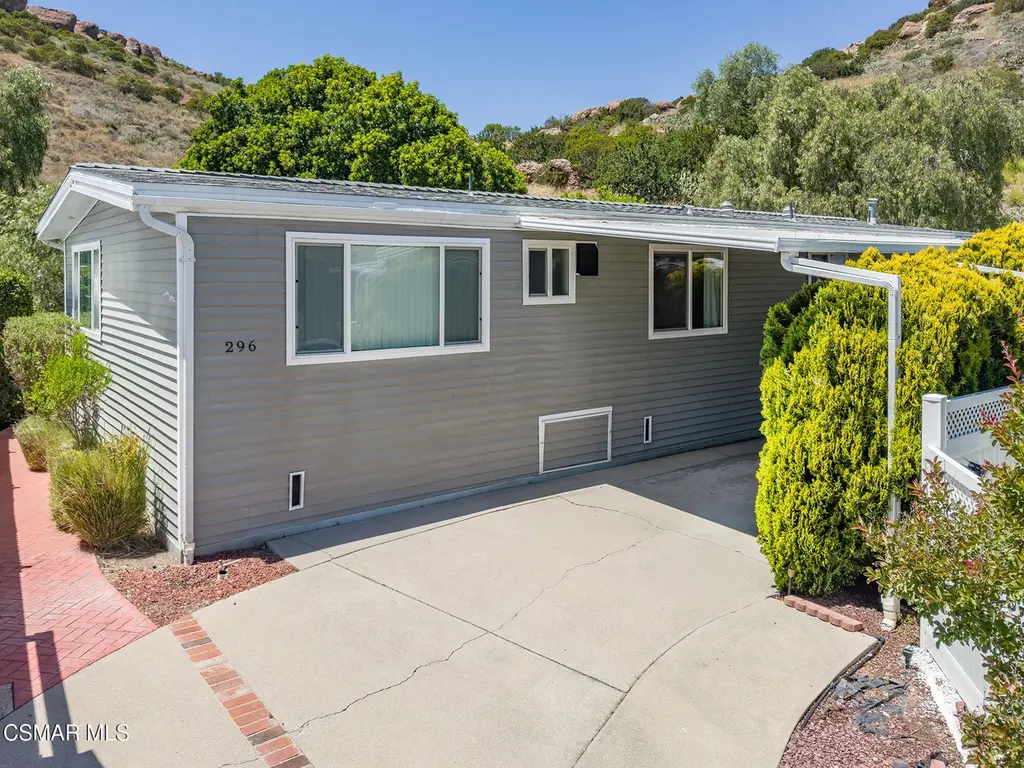
296 Vista Conejo · Thousand Oaks, CA
Flood risk 1/10 · Minimal
- FEMA flood zone
- X (unshaded)
- Chance of flooding over 30 yrs
- 0.0%
- Est. flood insurance / yr
- $507 – $1,088
Fire risk 7/10 · Major
- Est. fire insurance / yr
- $659 – $1,223
Heat risk 3/10 · Minor
- Hot days now (above 93°F)
- 7 days/yr
- Hot days in 30 yrs
- 18 days/yr
Wind risk 1/10 · Minimal
- Chance of severe wind over 30 yrs
- —
Air-quality risk 3/10 · Minor
- Unhealthy air days now
- 4 days/yr
- Unhealthy air days in 30 yrs
- 4 days/yr
Risk factors via First Street. Map © Google.
Why this score? — see what drove the D+ grade
The composite is a weighted blend of 9 inputs, each scored 0–100. Each bar is that input's sub-score; the figure is the points it added to the 100-point composite (weight × sub-score).
- Cash flow +18.6/30.0
- Schools +6.0/10.0
- DSCR +5.9/10.0
- 1% rule +5.0/10.0
- Condition / age +4.0/5.0
- Livability +3.5/5.0
- Rent growth +2.6/5.0
- ARV discount +1.8/15.0
- Appreciation +0.0/10.0
$399,000
🖨 Deal sheet 📄 Offer letter ✓ Due diligence
Listing remarks
Rare 3-Bedroom Home with Privacy, Views & Resort-Style Living in Vallecito 55+ Gated Community Nestled against open space with breathtaking natural views, this rare 3-bedroom, 2-bath home offers approximately 1,440 sq. ft. of comfortable living in the highly desirable Vallecito 55+ gated community. Designed with an open-concept floor plan, the home features laminate flooring throughout, smooth drywall & ceilings, recessed lighting, dual-pane windows, and abundant natural light. The spacious living room showcases a large picture window overlooking the private deck and serene open space beyond, it flows seamlessly into the dining area and beautifully updated kitchen. The kitche
Key facts
- 2 parking spots
- Community pool
- Built 1973
Property features AI
Finance
- Other: Washer, dryer and refrigerator included; Pet restrictions disclosed; Rent control disclosed; Property is Active Under Contract; Possession at close of escrow; Standard listing conditions
- Financial info: Listing accepts Conventional and Cash offers; Land is lease type: lease
- HOA & community: Senior community; Association pet rules
Exterior
- Parking: 2-car carport (not attached)
- Security: Carbon monoxide detector(s); Gated community
- Utilities: Private pool is heated and filtered
- Home design: Manufactured/mobile home (Brookwood model, Bendix); Single-level entry with steps; Facing/entry at ground level with steps
- Construction: Siding exterior (including aluminum and vinyl); Shingle roof; Raised foundation with pier jacks; Built in 1973
- Exterior features: Covered porch; Covered patio; Additional porch/other covered outdoor area; Double-pane windows with screens; Private heated and filtered pool; Spa; Aluminum skirt; Gated community; Community security features; Updated/remodeled condition; Has a view
Interior
- Kitchen: Microwave; Gas range/oven
- Bedrooms: 3 bedrooms
- Bathrooms: 2 full bathrooms
- Heating & cooling: Heating present
- Interior features: Quartz counters; Recessed lighting; French doors
- Laundry & utility: Separate laundry room inside; Washer and dryer included
Neighborhood map
What this means for you Summary
Snapshot
- This is a 3-bed/2.0-bath manufactured listed at $399k. Condition is rated good.
Deal economics
- At list price, monthly cash flow is $390 ($5k/yr) — positive.
- The deal already cash-flows at list — no discount required.
- To meet the 1% rule (rent ≥ 1% of price), the offer needs to be $398k (0.2% below list).
- Recommended offer: $393k (1.5% below list) — sets the bar for market timing.
- Cap rate 7.5% vs local median 2.8% in Thousand Oaks — top-decile yield for the area; either an underpriced asset or a hidden risk that comps aren't pricing in. Stress-test before assuming the spread holds.
Location & tenants
- Location reads 70/100 on livability (#226 in CA) — a middle-class / working-renter tenant base. Strengths: crime A+, commute A+, employment A+; Watch: cost of living F, health & safety F.
- Conejo Valley Unified (urban): math 57% / reading 72% proficiency, ranked #59 of 517 in CA (top 11%) — acceptable for families but not a draw, mixed tenant base, ~2y average lease; only 19% free/reduced lunch — higher-income household profile.
- Market conditions: Rents flat; 144 active listings in the ZIP; 4 comparable units currently listed for rent nearby; rentals lingering (median 44d on market — plan ~5-8 weeks vacancy on turnover, expect pricing pressure); 50% of comp listings sitting > 30 days — soft ceiling on asking rent; high-income renter base; 1,759 units permitted in Ventura County in 2024 (1,196 in 5+ unit buildings).
- This rent runs 32% of the median local income ($149k/yr) — at the standard rent-burdened threshold; future hikes will face affordability resistance.
Forward outlook
- Local home prices are declining (-3.0%/yr); year-one equity from $3k of loan paydown is wiped out by about $12k of value loss. Plan a longer hold.
- Ventura County population projected at +4% by 2050 — modest demand growth; plan on rents tracking national, not racing it.
Negotiation context
- It's been on market 19 days — a 2% lower offer ($393k) is reasonable based on typical stale-listing flexibility.
Risks & watch-outs
- Climate carrying-cost: major wildfire risk — expect insurance premiums to compound above CPI over the hold.
Questions for the listing agent
- Built in 1973 — when were the roof, HVAC, electrical panel, plumbing, and water heater last replaced?
- Is there a deadline driving the sale (1031 exchange, divorce, estate, relocation)? That informs how much negotiation room exists.
- Schools are B-rated — typically a magnet for longer-tenancy family renters. What's the average tenant stay here, and is there a school-zone premium baked into asking?
- The area grade is low — what's the realistic commute time and amenity access for the typical tenant pool here? Any planned neighborhood developments (good or bad) we should know about?
- What's the average days-on-market for RENTAL listings here right now (not sales)? A rising rental-DOM trend means longer vacancies and softer asking-rent achievability than the comps imply.
- What's the recent tenant-quality profile in this submarket — average credit score on applications, eviction rate, late-payment / NSF rate, and stable-employment percentage? A property-management company in the area should have these aggregated.
- How much new for-sale + rental construction is in the pipeline within 1–3 miles? Heavy new supply typically softens prices + rents 12–24 months out; constrained supply supports both.
Investment metrics
- 1% rule
- 1.00% ✗
- Cap rate
- 7.46%
- Cash-on-cash
- 4.19%
- DSCR
- 1.19
- GRM
- 8.3
CMA / ARV
- ARV (on-the-fly)
- $354,240
- Comps found
- 12
Show comp detail 12 sales within ~0.75 mi
| Address | Dist | Beds/Ba | Sqft | Sold | Price | $/sf | Match |
|---|---|---|---|---|---|---|---|
| 296 Vista Conejo | 0.00mi | 3/2.0 | 1,440 (0%) | 1mo | $399,000 | $277 | 99 |
| 10 La Lomita #0 | 0.10mi | 2/2.0 (-1) | 1,440 (0%) | 8mo | $250,000 | $174 | 83 |
| 252 El Gallardo | 0.18mi | 2/2.0 (-1) | 1,428 (-1%) | 3mo | $350,000 | $245 | 83 |
| 249 El Gallardo | 0.19mi | 2/2.0 (-1) | 1,440 (0%) | 6mo | $340,000 | $236 | 81 |
| 277 Monte Vis | 0.11mi | 2/2.0 (-1) | 1,440 (0%) | 11mo | $360,000 | $250 | 81 |
| 238 Vista Conejo | 0.02mi | 3/2.0 | 1,344 (-7%) | 10mo | $334,000 | $249 | 80 |
| 24 La Encina | 0.17mi | 3/2.0 | 1,344 (-7%) | 2mo | $330,000 | $246 | 79 |
| 188 La Reina #188 | 0.06mi | 3/2.0 | 1,344 (-7%) | 10mo | $267,000 | $199 | 78 |
| 272 Monte Vis | 0.13mi | 2/2.0 (-1) | 1,348 (-6%) | 3mo | $372,000 | $276 | 76 |
| 19 La Encina #0 | 0.16mi | 3/2.0 | 1,536 (+7%) | 8mo | $399,000 | $260 | 75 |
| 46 La Encina | 0.19mi | 2/2.0 (-1) | 1,344 (-7%) | 7mo | $190,000 | $141 | 69 |
| 110 La Fortuna #110 | 0.31mi | 2/2.0 (-1) | 1,404 (-2%) | 10mo | $260,000 | $185 | 68 |
Match score weights: distance 35% · size 25% · config 20% · recency 20%. Top-matched comps best support the ARV.
Projected returns pro-forma
-3.0% appreciation · 0.3% rent growth · sell at horizon
- IRR
- -12.8%
- Equity multiple
- 0.55×
- Total profit
- $-50,315
- Equity at exit
- $59,492
- IRR
- -8.6%
- Equity multiple
- 0.53×
- Total profit
- $-52,580
- Equity at exit
- $34,498
Cash invested: $111,720 (down + closing). Projections, not guarantees.
Landlord ↔ Tenant lean methodology
- Overall (STATE)
- 18 Strongly Tenant-Friendly
- State California
- 18 Strongly Tenant-Friendly · D+13
- County
- — inherits STATE
- City
- — inherits STATE
ZIP-level market 91320
- Rents YoY
- 0.3%
- Active inventory
- 144
- Price-to-rent
- 8.3×
Monthly cashflow live
- Estimated rent
- $3,984 medium interval (Pro) →
- Mortgage (P&I)
- −$2,092
- Tax est. 1.5%
- −$499 /mo · $5,985/yr
- Insurance
- −$166
- HOA
- −$0
- Vacancy / Maint / Mgmt
- −$837
- Net cashflow
- $390
Break-even live
UW: 25.0% down · 7.5% · 30yr · 1.5% tax · 5.0% vac · 8.0% maint · 8.0% mgmt
Financing live
Cash to close
- Down payment
- $99,750
- Closing costs
- $11,970
- Reserves months
- —
- Total cash needed
- —
Loan-product check · same deal, 3 products live
Conventional
25% down · 7.5% · 30yr
- Down + closing
- —
- Monthly P&I
- —
- Monthly cashflow
- —
- DSCR
- —
- Eligible?
- —
Personal DTI + credit; lowest rate.
DSCR
20% down · 8.5% · 30yr
- Down + closing
- —
- Monthly P&I
- —
- Monthly cashflow
- —
- DSCR
- —
- Eligible?
- —
No personal income docs; deal must DSCR.
Hard money
10% down · 12.0% · 12mo
- Down + closing
- —
- Monthly P&I
- —
- Monthly cashflow
- —
- DSCR
- —
- Eligible?
- —
Short-term bridge; refi at stabilization.
Rent comps 4 comps
| Address | Beds | Baths | Sqft | Rent | $/sqft | DOM | Units | Dist |
|---|---|---|---|---|---|---|---|---|
| 1194 Vista Canyon Ln Newbury Park, CA | 3.0 | 3.0 | 1384 | $3,800 | $2.75 | 43d | 1 | 0.15mi |
| 1194 Vista Conyon #17 Newbury Park, CA | 3.0 | 2.5 | 1384 | $3,800 | $2.75 | 23d | 1 | 0.15mi |
| 3444 Melvin Ct Newbury Park, CA | 3.0 | 2.0 | 1308 | $3,600 | $2.75 | 10d | 1 | 0.93mi |
| 198 San Vincente Cir Newbury Park, CA | 2.0 | 2.0 | 1334 | $3,500 | $2.62 | 43d | 1 | 1.11mi |
Listing history 2 events
-
2026-05-12historical Active Under Contract
-
2026-05-08$399,000 Active
ⓘ Source: listings_history table (triggers on properties + properties_extension) + one-shot
backfill from property_details.listing_events for pre-trigger history.
Climate risk First Street
- Flood 1/10 Low FEMA zone X (unshaded) · 0% chance over 30 yrs
- Wildfire 7/10 Severe
- Heat 3/10 Moderate 7 d/yr ≥93°F today · 18 d/yr by 30 yrs out
- Wind 1/10 Low
- Air quality 3/10 Moderate 4 unhealthy d/yr today · 4 by 30 yrs out
Nearby sold comps map
Loading sold comps map…
Walkable amenities ~0.75 mi
Loading nearby amenities…
Taxation est. · year 1
- Rental income
- $47,803
- − Mortgage interest
- −$22,350
- − Property taxes
- −$5,985
- − Insurance
- −$1,995
- − Repairs & maintenance
- −$3,824
- − Management
- −$3,824
- − Depreciation
- −$11,607
- Taxable loss
- −$1,783
- Est. tax savings @ 24.0%
- +$428
- After-tax cash flow
- $5,104/yr
For passive investors: Depreciation is non-cash, so a rental often shows a tax loss while cash-flowing — sheltering income. Rental losses are passive: they offset passive income freely, and up to $25,000/yr can offset ordinary (W-2) income if you actively participate and your MAGI is under $100k (phasing out to $0 by $150k); unused losses carry forward. On sale, claimed depreciation is recaptured at up to 25%, and gains may owe capital-gains tax (a 1031 exchange can defer both). Figures are a year-1 estimate at your 24.0% rate — not tax advice; consult a CPA.
Condition & rehab AI · 12 photos
This home is in good condition with a fresh paint job and updated kitchen. It offers a good investment opportunity with potential for value increase through minor updates.
Value-add opportunities
- Both Paint exterior and interior — Fresh paint enhances curb appeal and interior aesthetics
- Resale Replace countertops — Updated countertops add value and functionality
- Both Install smart home devices — Smart home devices improve convenience and energy efficiency
Renovation cost estimate screening
Value-add ROI direction
- Both Paint exterior and interior — Fresh paint enhances curb appeal and interior aesthetics ↑
- Resale Replace countertops — Updated countertops add value and functionality ↑
- Both Install smart home devices — Smart home devices improve convenience and energy efficiency ↑
ⓘ Cost ranges are severity-bucket heuristics (US national rule-of-thumb). Get contractor quotes + a written scope before underwriting a rehab budget.
Schools (NCES district)
- District
- Conejo Valley Unified
- NCES district ID
- 0609640
- Math proficiency
- 57% ▬ 0.00%
- Reading proficiency
- 72% ▲ 6.00%
- Median HH income
- $100,413
- Composite
- 59.57/100
- National rank
- #914
- State rank
- #59 of 517 in CA
Livability — Thousand Oaks
- Score
- 70/100
- State rank
- #226
- US rank
- #7364
Category grades
Schools grade is shown separately in the Schools card above.
Census & demographics
- Census place
- Thousand Oaks, CA
- County
- Ventura County · 829,955 people
- City population
- 121,704
- Metro
- Oxnard-Thousand Oaks-Ventura, CA
- Population (ZIP)
- 43,472
- Household income
- $148,991
- Rent vs Own
- Severe rent burden
- 756.0
Population outlook (Ventura County) Hauer SSP2
- Today (2025)
- 895,754 people
- By 2030
- 912,134 · +1.8%
- By 2040
- 931,454 · +4.0%
- By 2050
- 934,609 · +4.3%
- By 2075
- 924,899 · +3.3%
- By 2100
- 864,712 · -3.5%
Race, ethnicity, and origin ACS 2023
- Neighborhood character
- Diverse neighborhood (Simpson 0.56)
- Race & ethnicity
- White 63% Hispanic / Latino 19% Two or more races 16% Asian 11% Black 2%
- Hispanic origin (detail)
- Mexican 13%
- Common ancestry
- Italian 4% Romanian 3% Lithuanian 3%
- Foreign-born
- 19% · Canada, China, Vietnam
- Languages at home
- 76% English-only · Spanish 12% Other Indo-European 4% Chinese 2%
Political lean MEDSL · Ventura
- 2024 margin
- D (+15.1) · D 56.1% · R 41.0% · Other 2.9%
- 2008→2024 swing
- +2.8pp toward D · 2008: 12.3pp · 2024: 15.1pp
- All cycles
- 2024: D+15.1 2020: D+21.1 2016: D+16.8 2012: D+5.3 2008: D+12.3
Not yet ingested
- Civics
- —
Market trends
- HPI YoY
- ▼ -917.39%
- Current HPI
- 283.6467
- Rent YoY
- ▲ 0.30%
- Metro
- Oxnard-Thousand Oaks-Ventura, CA
- State GDP YoY
- ▲ 3.21%
- F500 in state
- 116
Industry mix (Fortune 500 HQ in CA)
| Industry | F500 HQs | Revenue |
|---|---|---|
| Technology | 27 | $1,492B |
|
||
| Financial Services | 3 | $174B |
|
||
| Retail | 3 | $44B |
|
||
| Insurance | 3 | $26B |
|
||
| Media / Entertainment | 2 | $115B |
|
||
| Pharmaceuticals / Biotech | 2 | $62B |
|
||
Price history
2 events — show timeline
- 2026-05-12 Contingent — CSMAR
- 2026-05-08 Listed $399,000 CSMAR
Cash-flow waterfall
monthlySold comps — $/sqft
last 12 mo · ≤1 miLoading sold comps…