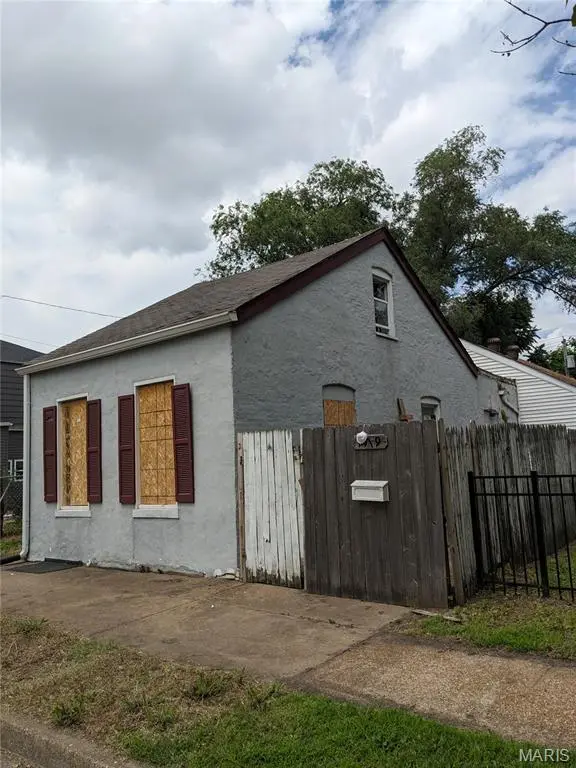
7719 Minnesota Ave · St. Louis, MO
Flood risk 5/10 · Moderate
- FEMA flood zone
- X (unshaded)
- Chance of flooding over 30 yrs
- 0.24%
- Est. flood insurance / yr
- $507 – $1,088
Fire risk 1/10 · Minimal
- Est. fire insurance / yr
- $1,054 – $1,958
Heat risk 6/10 · Moderate
- Hot days now (above 109°F)
- 7 days/yr
- Hot days in 30 yrs
- 21 days/yr
Wind risk 2/10 · Minimal
- Chance of severe wind over 30 yrs
- 1.0%
Air-quality risk 3/10 · Minor
- Unhealthy air days now
- 2 days/yr
- Unhealthy air days in 30 yrs
- 3 days/yr
Risk factors via First Street. Map © Google.
Why this score? — see what drove the B- grade
The composite is a weighted blend of 9 inputs, each scored 0–100. Each bar is that input's sub-score; the figure is the points it added to the 100-point composite (weight × sub-score).
- Cash flow +30.0/30.0
- 1% rule +10.0/10.0
- DSCR +10.0/10.0
- ARV discount +7.5/15.0
- Rent growth +3.3/5.0
- Livability +2.5/5.0
- Condition / age +2.5/5.0
- Schools +1.2/10.0
- Appreciation +0.0/10.0
$40,000
🖨 Deal sheet 📄 Offer letter ✓ Due diligence
Listing remarks
Step into the charm of this traditional 1.5-story home, featuring a classic brick and vinyl exterior set atop a solid stone foundation, and it just needs your loving care. Built in 1892, this home blends timeless character with everyday convenience, including a main-floor laundry and an inviting slider leading to a private back patio. Inside, the home offers 2 bedrooms and 1 full bath, with an unfinished basement ready for storage or future expansion. Outdoors, enjoy an expansive backyard complete with a privacy fence, plus both side and rear patios ideal for relaxing or entertaining. Located just minutes from Highway 55 and public transportation, this home provides easy access while mainta
Key facts
- Unfinished basement
- Private back patio
- Expansive backyard
Tags
Property features AI
Finance
- Other: City lot, level and near public transit; Asphalt road frontage on a city street (25' frontage)
- Financial info: Lease not considered
- HOA & community: Curbs; Sidewalks; Street lights; Public bus access; Nearby restaurants
Exterior
- Parking: On-street parking; Lighted parking
- Utilities: Public water; Public sewer; 220-volt electric; Cable available; Electricity connected; Natural gas connected; Phone available; Water connected; Sewer connected
- Home design: Single family residence; One and one-half stories; Private ownership; Fixer condition
- Construction: Brick, stone and vinyl siding construction; Asphalt shingle pitched roof; Stone foundation; Full unfinished basement
- Exterior features: Private yard; Back yard; Patio; Patio/porch features; Sliding door(s)
Interior
- Kitchen: Eat-in kitchen
- Bedrooms: 2 bedrooms total; 1 bedroom on the main level; 1 bedroom on the upper level
- Flooring: Wood flooring; Other flooring
- Bathrooms: 1 full bathroom (main level)
- Heating & cooling: Forced air heating; Natural gas heating; Other cooling
- Interior features: Eat-in kitchen; Storage; Other interior features
- Laundry & utility: Laundry on the main level
Neighborhood map
What this means for you Summary
Snapshot
- This is a 2-bed/1.0-bath single-family listed at $40k.
Deal economics
- At list price, monthly cash flow is $766 ($9k/yr) — positive.
- The deal already cash-flows at list — no discount required.
- Meets the 1% rule at list price ($1k rent vs $40k).
- Recommended offer: $39k (1.5% below list) — sets the bar for market timing.
- Cap rate 29.3% vs local median 5.0% in St. Louis — top-decile yield for the area; either an underpriced asset or a hidden risk that comps aren't pricing in. Stress-test before assuming the spread holds.
Location & tenants
- Location reads: area grade B — affects rentability + tenant quality, not the cash-flow math above.
- St. Louis City (urban): math 10% / reading 18% proficiency, ranked #312 of 324 in MO (top 96%) — low school quality limits family demand, transient renter base, plan for 1-2y turnover; 80% free/reduced lunch — lower-income household profile, screen leases tightly.
- Zoned schools: Woerner Elem. (math 8% / reading 17%, grade F, #1,007 of 1,115 statewide, top 91%, 362 students, 99% FRL); Roosevelt High (math 2% / reading 8%, grade F, #517 of 521 statewide, top 100%, 460 students, 99% FRL) — zoned schools average 99% FRL vs 80% district-wide (19 pts higher); higher-poverty schools than district average — tighter screening recommended.
- Market conditions: Rents rising (+3.3%/yr); 125 active listings in the ZIP; 22 comparable units currently listed for rent nearby; rentals at typical pace (median 18d on market — plan ~3-4 weeks tenant-placement turnaround); 45% of comp listings sitting > 30 days — soft ceiling on asking rent; 294 units permitted in St. Louis city in 2024 (227 in 5+ unit buildings).
- This rent runs 34% of the median local income ($47k/yr) — at the standard rent-burdened threshold; future hikes will face affordability resistance.
Forward outlook
- Local home prices are declining (-3.0%/yr); year-one equity from $277 of loan paydown is wiped out by about $1k of value loss. Plan a longer hold.
- St. Louis County population projected to shrink 6% by 2050 — rents likely to lag national; underwrite the cash flow, not the appreciation.
- At projected returns (-3.0% appreciation + 3.3% rent growth), your $11k cash investment doubles in ~2 years — after that, you're playing with house money.
Negotiation context
- It's been on market 20 days — a 2% lower offer ($39k) is reasonable based on typical stale-listing flexibility.
- 6 sale attempts since 7y ago with the ask held roughly flat each time — persistent listings suggest the price (not the market) is what's stuck; bring a comps-based counter.
Risks & watch-outs
- Watch-outs: built in 1892 — expect roof / HVAC / electrical / plumbing capex.
- Climate carrying-cost: moderate flood risk; extreme-heat days projected 7→21/yr by 2055 (HVAC capex compounding) — expect insurance premiums to compound above CPI over the hold.
Questions for the listing agent
- Built in 1892 — when were the roof, HVAC, electrical panel, plumbing, and water heater last replaced?
- Is there a deadline driving the sale (1031 exchange, divorce, estate, relocation)? That informs how much negotiation room exists.
- What's the average days-on-market for RENTAL listings here right now (not sales)? A rising rental-DOM trend means longer vacancies and softer asking-rent achievability than the comps imply.
- What's the recent tenant-quality profile in this submarket — average credit score on applications, eviction rate, late-payment / NSF rate, and stable-employment percentage? A property-management company in the area should have these aggregated.
- How much new for-sale + rental construction is in the pipeline within 1–3 miles? Heavy new supply typically softens prices + rents 12–24 months out; constrained supply supports both.
Investment metrics
- 1% rule
- 3.30% ✓
- Cap rate
- 29.27%
- Cash-on-cash
- 82.08%
- DSCR
- 4.65
- GRM
- 2.5
CMA / ARV
- ARV (on-the-fly)
- $187,240
- Comps found
- 12
Show comp detail 12 sales within ~0.75 mi
| Address | Dist | Beds/Ba | Sqft | Sold | Price | $/sf | Match |
|---|---|---|---|---|---|---|---|
| 122 W Courtois St | 0.10mi | 3/2.0 (+1) | 1,625 (+8%) | 3mo | $125,000 | $77 | 72 |
| 7721 Michigan Ave | 0.07mi | 3/2.0 (+1) | 1,658 (+10%) | 3mo | $169,900 | $102 | 69 |
| 212 Espenschied St | 0.50mi | 3/1.5 (+1) | 1,562 (+3%) | 5mo | $119,900 | $77 | 60 |
| 6925 Michigan Ave | 0.53mi | 2/1.5 | 1,436 (-5%) | 8mo | $210,000 | $146 | 58 |
| 6713 Virginia Ave | 0.67mi | 2/1.0 | 1,440 (-5%) | 9mo | $249,000 | $173 | 53 |
| 3637 Roswell Ave | 0.70mi | 3/2.0 (+1) | 1,501 (-1%) | 6mo | $207,900 | $139 | 52 |
| 8309 Minnesota Ave | 0.38mi | 2/1.0 | 1,292 (-14%) | 8mo | $140,000 | $108 | 52 |
| 8523 Idaho Ave | 0.64mi | 3/1.0 (+1) | 1,392 (-8%) | 4mo | $129,900 | $93 | 49 |
| 6951 Alabama Ave | 0.52mi | 2/1.0 | 1,333 (-12%) | 9mo | $165,000 | $124 | 48 |
| 6821 Minnesota Ave | 0.60mi | 3/2.0 (+1) | 1,600 (+6%) | 8mo | $134,900 | $84 | 46 |
| 8111 Southpark Ct | 0.73mi | 3/2.0 (+1) | 1,400 (-7%) | 1mo | $174,900 | $125 | 44 |
| 3621 Blow St | 0.70mi | 3/2.0 (+1) | 1,350 (-11%) | 7mo | $275,000 | $204 | 34 |
Match score weights: distance 35% · size 25% · config 20% · recency 20%. Top-matched comps best support the ARV.
Projected returns pro-forma
-3.0% appreciation · 3.27% rent growth · sell at horizon
- IRR
- 82.7%
- Equity multiple
- 4.81×
- Total profit
- $42,688
- Equity at exit
- $5,964
- IRR
- 86.0%
- Equity multiple
- 10.07×
- Total profit
- $101,559
- Equity at exit
- $3,458
Cash invested: $11,200 (down + closing). Projections, not guarantees.
Landlord ↔ Tenant lean methodology
- Overall (STATE)
- 81 Strongly Landlord-Friendly
- State Missouri
- 81 Strongly Landlord-Friendly · R+10
- County
- — inherits STATE
- City
- — inherits STATE
ZIP-level market 63111
- Rents YoY
- 3.3%
- Active inventory
- 125
- Price-to-rent
- 2.5×
Monthly cashflow live
- Estimated rent
- $1,319 high interval (Pro) →
- Mortgage (P&I)
- −$210
- Tax from tax record
- −$50 /mo · $596/yr
- Insurance
- −$17
- HOA
- −$0
- Vacancy / Maint / Mgmt
- −$277
- Net cashflow
- $766
Break-even live
UW: 25.0% down · 7.5% · 30yr · 1.5% tax · 5.0% vac · 8.0% maint · 8.0% mgmt
Financing live
Cash to close
- Down payment
- $10,000
- Closing costs
- $1,200
- Reserves months
- —
- Total cash needed
- —
Loan-product check · same deal, 3 products live
Conventional
25% down · 7.5% · 30yr
- Down + closing
- —
- Monthly P&I
- —
- Monthly cashflow
- —
- DSCR
- —
- Eligible?
- —
Personal DTI + credit; lowest rate.
DSCR
20% down · 8.5% · 30yr
- Down + closing
- —
- Monthly P&I
- —
- Monthly cashflow
- —
- DSCR
- —
- Eligible?
- —
No personal income docs; deal must DSCR.
Hard money
10% down · 12.0% · 12mo
- Down + closing
- —
- Monthly P&I
- —
- Monthly cashflow
- —
- DSCR
- —
- Eligible?
- —
Short-term bridge; refi at stabilization.
Rent comps 22 comps
| Address | Beds | Baths | Sqft | Rent | $/sqft | DOM | Units | Dist |
|---|---|---|---|---|---|---|---|---|
| 7924 Michigan Ave Unit 2F St. Louis, MO | 3.0 | 2.0 | 1250 | $1,195 | $0.96 | 3d | 1 | 0.18mi |
| 7417 Vermont Ave St. Louis, MO | 1.0–2.0 | 1.0–2.0 | 1144 | $1,600 | $1.40 | 2d | 8 | 0.27mi |
| 7417 Vermont Ave Unit 103 St. Louis, MO | 2.0 | 2.0 | 1069 | $1,500 | $1.40 | 15d | 1 | 0.27mi |
| 8215 Pennsylvania Ave Saint Louis, MO | 1.0 | 2.0 | 1252 | $1,650 | $1.32 | 17d | 1 | 0.36mi |
| 7024 Pennsylvania Ave Unit F St. Louis, MO | 2.0 | 1.0 | 1081 | $930 | $0.86 | 16d | 1 | 0.44mi |
| 6915 Alabama Ave Unit 1st Floor St. Louis, MO | 2.0 | 1.0 | 1248 | $1,200 | $0.96 | 44d | 1 | 0.55mi |
| 6800 Virginia Ave Unit 1 St. Louis, MO | 3.0 | 1.0 | 1500 | $1,475 | $0.98 | 18d | 1 | 0.61mi |
| 6730 Vermont Ave Saint Louis, MO | 3.0 | 2.0 | 1534 | $1,600 | $1.04 | 15d | 1 | 0.61mi |
| 6436 Idaho Ave Saint Louis, MO | 2.0 | 1.0 | 1050 | $995 | $0.95 | 44d | 1 | 0.82mi |
| 3857 Boulevard Heights Ct Saint Louis, MO | 3.0 | 2.5 | 1697 | $2,250 | $1.33 | 2d | 1 | 0.98mi |
| 304 Bayless Ave Saint Louis, MO | 3.0 | 1.0 | 1104 | $1,950 | $1.77 | 2d | 1 | 1.04mi |
| 229 Horn Ave Saint Louis, MO | 2.0 | 1.5 | 1301 | $1,871 | $1.44 | 2d | 1 | 1.06mi |
| 3945 Crosby Dr Saint Louis, MO | 2.0 | 1.0 | 1100 | $2,083 | $1.89 | 2d | 1 | 1.06mi |
| 711 Wilmington Ave Unit NA St. Louis, MO | 2.0 | 1.0 | 1051 | $1,300 | $1.24 | 44d | 1 | 1.19mi |
| 349 Lagro Ave Saint Louis, MO | 3.0 | 1.0 | 1184 | $1,500 | $1.27 | 44d | 1 | 1.21mi |
| 336 Lagro Ave Saint Louis, MO | 2.0 | 2.0 | 1340 | $1,250 | $0.93 | 44d | 1 | 1.22mi |
| 712 Dover Pl Unit 1FL St. Louis, MO | 2.0 | 1.0 | 1100 | $1,000 | $0.91 | 44d | 1 | 1.22mi |
| 712 Dover Pl Saint Louis, MO | 2.0 | 1.0 | 1100 | $900 | $0.82 | 44d | 1 | 1.22mi |
| 736 Dover Pl Unit 1F St. Louis, MO | 2.0 | 1.0 | 1200 | $1,395 | $1.16 | 44d | 1 | 1.23mi |
| 3668 Wilmington Ave Saint Louis, MO | 2.0 | 1.0 | 1214 | $1,350 | $1.11 | 44d | 1 | 1.30mi |
| 3641 Wilmington Ave Saint Louis, MO | 2.0 | 1.0 | 1175 | $1,050 | $0.89 | 44d | 1 | 1.31mi |
| 3668a Wilmington Ave St. Louis, MO | 2.0 | 1.0 | 1212 | $1,295 | $1.07 | 15d | 1 | 1.31mi |
Listing history 13 events
-
2026-06-18days on market $40,000 Active 20 DOM
-
2026-06-17days on market $40,000 Active 19 DOM
-
2026-06-16days on market $40,000 Active 18 DOM
-
2026-06-15days on market $40,000 Active 17 DOM
-
2026-06-13days on market $40,000 Active 15 DOM
-
2026-06-09days on market $40,000 Active 11 DOM
-
2026-06-08days on market $40,000 Active 10 DOM
-
2026-06-07days on market $40,000 Active 9 DOM
-
2026-06-05days on market $40,000 Active 6 DOM
-
2026-06-03days on market $40,000 Active 5 DOM
-
2026-06-02days on market $40,000 Active 4 DOM
-
2026-06-01days on market $40,000 Active 3 DOM
-
2026-05-31days on market $40,000 Active 2 DOM
ⓘ Source: listings_history table (triggers on properties + properties_extension) + one-shot
backfill from property_details.listing_events for pre-trigger history.
Tax reassessment forecast MO · Resets to sale price
- Current annual tax
- $596 · $50/mo
- Projected year-2 tax
- $596 · $50/mo
- Expected delta
- $0/yr ($0/mo · 0.0%)
ⓘ Screening estimate from a state-policy table — verify with the county assessor before closing.
Climate risk First Street
- Flood 5/10 Major FEMA zone X (unshaded) · 24% chance over 30 yrs
- Wildfire 1/10 Low
- Heat 6/10 Major 7 d/yr ≥109°F today · 21 d/yr by 30 yrs out
- Wind 2/10 Low 100% chance of damaging wind over 30 yrs
- Air quality 3/10 Moderate 2 unhealthy d/yr today · 3 by 30 yrs out
Nearby sold comps map
Loading sold comps map…
Walkable amenities ~0.75 mi
Loading nearby amenities…
Taxation est. · year 1
- Rental income
- $15,830
- − Mortgage interest
- −$2,241
- − Property taxes
- −$596
- − Insurance
- −$200
- − Repairs & maintenance
- −$1,266
- − Management
- −$1,266
- − Depreciation
- −$1,164
- Taxable income
- $9,097
- Est. tax owed @ 24.0%
- −$2,183
- After-tax cash flow
- $7,009/yr
For passive investors: Depreciation is non-cash, so a rental often shows a tax loss while cash-flowing — sheltering income. Rental losses are passive: they offset passive income freely, and up to $25,000/yr can offset ordinary (W-2) income if you actively participate and your MAGI is under $100k (phasing out to $0 by $150k); unused losses carry forward. On sale, claimed depreciation is recaptured at up to 25%, and gains may owe capital-gains tax (a 1031 exchange can defer both). Figures are a year-1 estimate at your 24.0% rate — not tax advice; consult a CPA.
Schools (NCES district)
- District
- St. Louis City
- NCES district ID
- 2929280
- Math proficiency
- 10% ▼ -6.00%
- Reading proficiency
- 18% ▼ -3.00%
- Median HH income
- $35,685
- Composite
- 11.54/100
- National rank
- #9699
- State rank
- #312 of 324 in MO
Livability — St. Louis
No livability data for this city. (Only ~50 U.S. cities are tracked.)
Census & demographics
- Census place
- St. Louis, MO
- County
- Saint Louis City · 254,015 people
- City population
- 283,259
- Metro
- St. Louis, MO-IL
- Population (ZIP)
- 18,851
- Household income
- $47,039
- Rent vs Own
- Severe rent burden
- 1364.0
Population outlook (St. Louis County) Hauer SSP2
- Today (2025)
- 315,737 people
- By 2030
- 313,865 · -0.6%
- By 2040
- 305,439 · -3.3%
- By 2050
- 296,529 · -6.1%
- By 2075
- 271,028 · -14.2%
- By 2100
- 255,359 · -19.1%
Race, ethnicity, and origin ACS 2023
- Neighborhood character
- Diverse neighborhood (Simpson 0.65)
- Race & ethnicity
- Black 42% White 41% Two or more races 11% Hispanic / Latino 9% Asian 1%
- Hispanic origin (detail)
- Mexican 6%
- Common ancestry
- Lithuanian 3% Slovak 1% Romanian 1%
- Foreign-born
- 7% · Canada, India
- Languages at home
- 90% English-only · Spanish 7% Other Indo-European 1%
Political lean MEDSL · St. Louis
- 2024 margin
- Solid D (+64.7) · D 81.4% · R 16.7% · Other 2.0%
- 2008→2024 swing
- -3.5pp toward R · 2008: 68.2pp · 2024: 64.7pp
- All cycles
- 2024: D+64.7 2020: D+66.2 2016: D+63.7 2012: D+66.6 2008: D+68.2
Not yet ingested
- Civics
- —
Market trends
- HPI YoY
- ▼ -92.80%
- Current HPI
- 169.4644
- Rent YoY
- ▲ 3.27%
- Metro
- St. Louis, MO-IL
- State GDP YoY
- ▲ 1.84%
- F500 in state
- 20
Industry mix (Fortune 500 HQ in MO)
| Industry | F500 HQs | Revenue |
|---|---|---|
| Healthcare | 1 | $163B |
|
||
| Insurance | 1 | $21B |
|
||
| Industrial Technology | 1 | $17B |
|
||
| Retail | 1 | $16B |
|
||
| Industrial Distribution | 1 | $10B |
|
||
| Utilities | 1 | $9B |
|
||
Price history
+166.7% since first listed23 events — show timeline
- 2026-05-29 Listed $40,000 MARIS as Distributed by MLS Grid
- 2025-02-02 Delisted — MARIS as Distributed by MLS Grid
- 2024-12-16 Contingent — MARIS as Distributed by MLS Grid
- 2024-10-22 Relisted — MARIS as Distributed by MLS Grid
- 2024-10-17 Pending — MARIS as Distributed by MLS Grid
- 2024-10-16 Relisted — MARIS as Distributed by MLS Grid
- 2024-10-16 Price Changed $51,000 MARIS as Distributed by MLS Grid
- 2024-09-25 Delisted — MARIS as Distributed by MLS Grid
- 2024-05-24 Price Changed $65,000 MARIS as Distributed by MLS Grid
- 2024-03-14 Price Changed $80,000 MARIS as Distributed by MLS Grid
- 2024-03-14 Listed $89,900 MARIS as Distributed by MLS Grid
- 2024-01-19 Delisted — MARIS as Distributed by MLS Grid
- 2023-11-28 Listed $89,900 MARIS as Distributed by MLS Grid
- 2020-04-28 Sold (Public Records) $62,000 Public Records
- 2020-04-23 Sold (MLS) — MARIS as Distributed by MLS Grid
- 2020-04-18 Pending — MARIS as Distributed by MLS Grid
- 2020-03-20 Contingent — MARIS as Distributed by MLS Grid
- 2019-12-10 Price Changed $58,900 MARIS as Distributed by MLS Grid
- 2019-11-21 Listed $69,500 MARIS as Distributed by MLS Grid
- 1996-12-06 Sold (Public Records) — Public Records
- 1996-02-27 Sold (Public Records) — Public Records
- 1996-02-26 Sold (Public Records) $18,000 Public Records
- 1991-11-13 Sold (Public Records) $15,000 Public Records
Property tax history
+4.8%/yrLatest (2024): $596 · +4.9% YoY. Source: county tax records.
Cash-flow waterfall
monthlySold comps — $/sqft
last 12 mo · ≤1 miLoading sold comps…