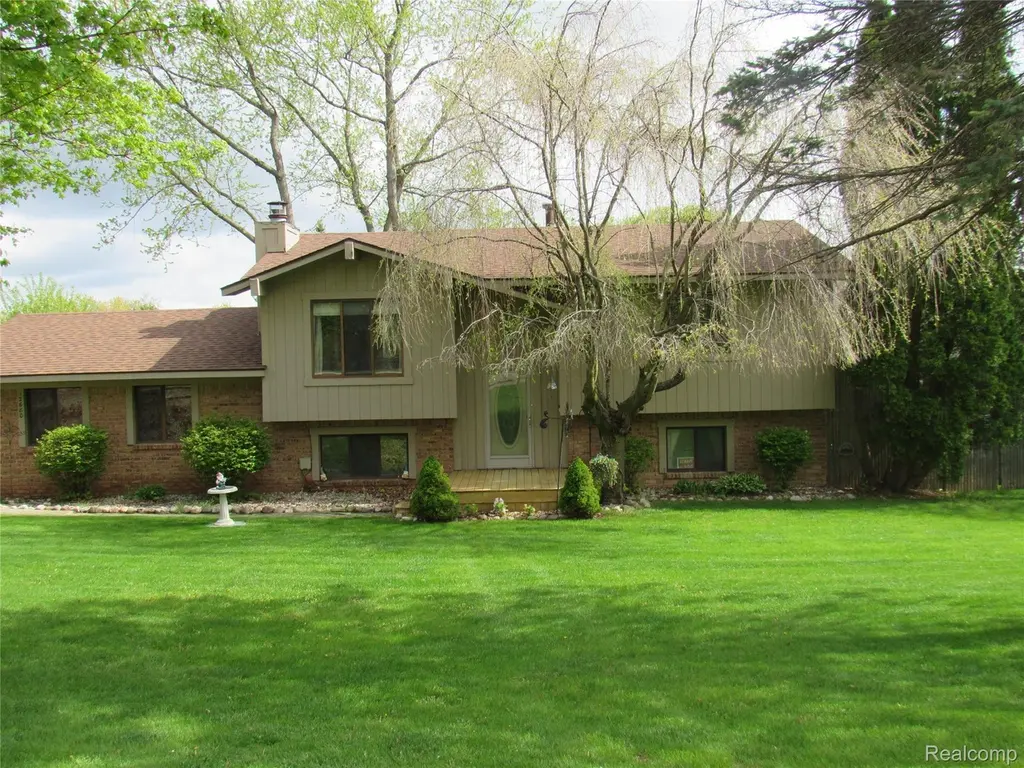
12680 Andersonville Rd · Holly, MI
Flood risk 1/10 · Minimal
- FEMA flood zone
- X (unshaded)
- Chance of flooding over 30 yrs
- 0.0%
- Est. flood insurance / yr
- $473 – $860
Fire risk 3/10 · Minor
- Est. fire insurance / yr
- $784 – $1,456
Heat risk 2/10 · Minimal
- Hot days now (above 96°F)
- 7 days/yr
- Hot days in 30 yrs
- 15 days/yr
Wind risk 2/10 · Minimal
- Chance of severe wind over 30 yrs
- —
Air-quality risk 3/10 · Minor
- Unhealthy air days now
- 2 days/yr
- Unhealthy air days in 30 yrs
- 4 days/yr
Risk factors via First Street. Map © Google.
Why this score? — see what drove the D- grade
The composite is a weighted blend of 9 inputs, each scored 0–100. Each bar is that input's sub-score; the figure is the points it added to the 100-point composite (weight × sub-score).
- ARV discount +15.0/15.0
- Cash flow +6.5/30.0
- Livability +3.8/5.0
- Schools +3.7/10.0
- Rent growth +2.5/5.0
- Condition / age +2.5/5.0
- 1% rule +0.9/10.0
- DSCR +0.8/10.0
- Appreciation +0.0/10.0
$280,000
🖨 Deal sheet 📄 Offer letter ✓ Due diligence
Listing remarks MLS
Beautiful location! Drink your morning coffer out your front porch and watch the sunrise and nature, beautiful blooming trees , and flowers. Walk out to your deck off dining room and watch the sunset. Updated kitchen with new cabinets and granite counter tops. new stainless steel refrigerator, dishwasher and microwave. Finished walk-out basement with gas fireplace. New shingles and wood replaced on roof in 6/25. New furnace and central air and thermostat in 23. Privacy fence in backyard and large shed for your tools.
Key facts
- Front porch
- Gas fireplace
- Privacy fence
Tags
Property features AI
Finance
- Other: Pets allowed
Exterior
- Parking: Attached 2-car garage; Driveway; Garage faces side
- Utilities: Private well water; Septic tank; Electric with circuit breakers
- Home design: Single-family residence; Two levels; Ground-level entry with steps
- Construction: Wood siding; Asphalt roof; Built with a foundation and includes a finished below-grade area
- Exterior features: Deck; Porch; Back yard fenced
Interior
- Kitchen: Free-standing gas range; Microwave; Dishwasher; Free-standing refrigerator; Stainless steel appliances
- Bedrooms: Total of 8 rooms (includes bedrooms and living spaces)
- Bathrooms: 1 full bathroom; 1 half bathroom
- Interior features: Entrance foyer; High-speed internet; Finished walk-out basement; Fireplace in family room (gas)
- Laundry & utility: Laundry room with washer and dryer; Gas water heater; Owned water softener
Neighborhood map
What this means for you Summary
Snapshot
- This is a 2-bed/1.5-bath single-family listed at $280k.
Deal economics
- At list price, monthly cash flow is $-471 ($-6k/yr) — negative.
- To cash-flow at today's rent, offer at most $197k (29.7% below list).
- To meet the 1% rule (rent ≥ 1% of price), the offer needs to be $166k (40.8% below list).
- Recommended offer: $166k (40.8% below list) — sets the bar for 1% rule.
Location & tenants
- Location reads 75/100 on livability (#156 in MI, #3,930 nationally) — a middle-class / working-renter tenant base. Strengths: crime A+, cost of living A+, housing A+; Watch: amenities F, commute F, employment D-.
- Holly Area School District (town): math 31% / reading 52% proficiency, ranked #165 of 540 in MI (top 31%) — families likely to look elsewhere, expect single-tenant / working-renter base with shorter leases.
- Market conditions: 46 active listings in the ZIP; 2,614 units permitted in Oakland County in 2024 (721 in 5+ unit buildings).
Forward outlook
- Local home prices are declining (-3.0%/yr); year-one equity from $2k of loan paydown is wiped out by about $8k of value loss. Plan a longer hold.
- Oakland County population projected at +10% by 2050 — modest demand growth; plan on rents tracking national, not racing it.
Negotiation context
- Only 11 days on market — expect competitive offers; lowballing is unlikely to land.
- 6 sale attempts since 24y ago with the ask held roughly flat each time — persistent listings suggest the price (not the market) is what's stuck; bring a comps-based counter.
- Current owner paid $146k; list at $280k implies a 92% gain — meaningful room to come down on a strong offer.
Questions for the listing agent
- What do current leases actually rent for vs. the listed asking? Can we see a recent rent roll and the last 12 months of T-12 income?
- Built in 1979 — when were the roof, HVAC, electrical panel, plumbing, and water heater last replaced?
- Is there a deadline driving the sale (1031 exchange, divorce, estate, relocation)? That informs how much negotiation room exists.
- The area grade is low — what's the realistic commute time and amenity access for the typical tenant pool here? Any planned neighborhood developments (good or bad) we should know about?
- What's the average days-on-market for RENTAL listings here right now (not sales)? A rising rental-DOM trend means longer vacancies and softer asking-rent achievability than the comps imply.
- What's the recent tenant-quality profile in this submarket — average credit score on applications, eviction rate, late-payment / NSF rate, and stable-employment percentage? A property-management company in the area should have these aggregated.
- How much new for-sale + rental construction is in the pipeline within 1–3 miles? Heavy new supply typically softens prices + rents 12–24 months out; constrained supply supports both.
Investment metrics
- 1% rule
- 0.59% ✗
- Cap rate
- 4.28%
- Cash-on-cash
- -7.20%
- DSCR
- 0.68
- GRM
- 14.1
CMA / ARV
- ARV (median comp)
- $405,705
- List price
- $280,000
- Delta
- -30.98%
- Verdict
- UNDERPRICED
- Comps
- 20 within 1.0 mi
Show comp detail 3 sales within ~0.75 mi
| Address | Dist | Beds/Ba | Sqft | Sold | Price | $/sf | Match |
|---|---|---|---|---|---|---|---|
| 7448 Village Ct | 0.19mi | 3/2.0 (+1) | 1,716 (-4%) | 6mo | $438,900 | $256 | 72 |
| 7460 Village Ct | 0.16mi | 3/2.0 (+1) | 1,650 (-8%) | 4mo | $425,000 | $258 | 70 |
| 12785 Carolyn Way | 0.22mi | 3/2.5 (+1) | 1,710 (-4%) | 16mo | $445,000 | $260 | 61 |
Match score weights: distance 35% · size 25% · config 20% · recency 20%. Top-matched comps best support the ARV.
Projected returns pro-forma
-3.0% appreciation · 3.0% rent growth · sell at horizon
- IRR
- -28.9%
- Equity multiple
- 0.04×
- Total profit
- $-75,413
- Equity at exit
- $41,749
- IRR
- -28.9%
- Equity multiple
- -0.33×
- Total profit
- $-104,547
- Equity at exit
- $24,209
Cash invested: $78,400 (down + closing). Projections, not guarantees.
Landlord ↔ Tenant lean methodology
- Overall (STATE)
- 62 Landlord-Friendly
- State Michigan
- 62 Landlord-Friendly · EVEN
- County
- — inherits STATE
- City
- — inherits STATE
ZIP-level market 48350
- Active inventory
- 46
- Price-to-rent
- 14.1×
Monthly cashflow live
- Estimated rent
- $1,657 medium interval (Pro) →
- Mortgage (P&I)
- −$1,468
- Tax from tax record
- −$195 /mo · $2,336/yr
- Insurance
- −$117
- HOA
- −$0
- Vacancy / Maint / Mgmt
- −$348
- Net cashflow
- $-471
Break-even live
UW: 25.0% down · 7.5% · 30yr · 1.5% tax · 5.0% vac · 8.0% maint · 8.0% mgmt
Financing live
Cash to close
- Down payment
- $70,000
- Closing costs
- $8,400
- Reserves months
- —
- Total cash needed
- —
Loan-product check · same deal, 3 products live
Conventional
25% down · 7.5% · 30yr
- Down + closing
- —
- Monthly P&I
- —
- Monthly cashflow
- —
- DSCR
- —
- Eligible?
- —
Personal DTI + credit; lowest rate.
DSCR
20% down · 8.5% · 30yr
- Down + closing
- —
- Monthly P&I
- —
- Monthly cashflow
- —
- DSCR
- —
- Eligible?
- —
No personal income docs; deal must DSCR.
Hard money
10% down · 12.0% · 12mo
- Down + closing
- —
- Monthly P&I
- —
- Monthly cashflow
- —
- DSCR
- —
- Eligible?
- —
Short-term bridge; refi at stabilization.
Listing history 13 events
-
2026-05-14status Pending 522-char remark
Show marketing remark (522 chars)
Beautiful location! Drink your morning coffer out your front porch and watch the sunrise and nature, beautiful blooming trees , and flowers. Walk out to your deck off dining room and watch the sunset. Updated kitchen with new cabinets and granite counter tops. new stainless steel refrigerator, dishwasher and microwave. Finished walk-out basement with gas fireplace. New shingles and wood replaced on roof in 6/25. New furnace and central air and thermostat in 23. Privacy fence in backyard and large shed for your tools.
-
2026-05-01$280,000 Active 522-char remark
Show marketing remark (522 chars)
Beautiful location! Drink your morning coffer out your front porch and watch the sunrise and nature, beautiful blooming trees , and flowers. Walk out to your deck off dining room and watch the sunset. Updated kitchen with new cabinets and granite counter tops. new stainless steel refrigerator, dishwasher and microwave. Finished walk-out basement with gas fireplace. New shingles and wood replaced on roof in 6/25. New furnace and central air and thermostat in 23. Privacy fence in backyard and large shed for your tools.
-
2006-05-03historical
-
2005-11-07$199,900
-
2003-01-29historical
-
2003-01-27historical
-
2002-09-05historical
-
2002-07-29$169,999
-
2002-07-28$169,899
-
2002-07-28$169,899
-
1999-03-08soldstatus $146,000
ⓘ Source: listings_history table (triggers on properties + properties_extension) + one-shot
backfill from property_details.listing_events for pre-trigger history.
Tax reassessment forecast MI · Partial reset (capped growth)
- Current annual tax
- $2,336 · $195/mo
- Projected year-2 tax
- $3,324 · $277/mo
- Expected delta
- +$988/yr (+$82/mo · 42.3%)
ⓘ Screening estimate from a state-policy table — verify with the county assessor before closing.
Climate risk First Street
- Flood 1/10 Low FEMA zone X (unshaded) · 0% chance over 30 yrs
- Wildfire 3/10 Moderate
- Heat 2/10 Low 7 d/yr ≥96°F today · 15 d/yr by 30 yrs out
- Wind 2/10 Low
- Air quality 3/10 Moderate 2 unhealthy d/yr today · 4 by 30 yrs out
Nearby sold comps map
Loading sold comps map…
Walkable amenities ~0.75 mi
Loading nearby amenities…
Taxation est. · year 1
- Rental income
- $19,885
- − Mortgage interest
- −$15,684
- − Property taxes
- −$2,336
- − Insurance
- −$1,400
- − Repairs & maintenance
- −$1,591
- − Management
- −$1,591
- − Depreciation
- −$8,145
- Taxable loss
- −$10,862
- Est. tax savings @ 24.0%
- +$2,607
- After-tax cash flow
- $-3,040/yr
For passive investors: Depreciation is non-cash, so a rental often shows a tax loss while cash-flowing — sheltering income. Rental losses are passive: they offset passive income freely, and up to $25,000/yr can offset ordinary (W-2) income if you actively participate and your MAGI is under $100k (phasing out to $0 by $150k); unused losses carry forward. On sale, claimed depreciation is recaptured at up to 25%, and gains may owe capital-gains tax (a 1031 exchange can defer both). Figures are a year-1 estimate at your 24.0% rate — not tax advice; consult a CPA.
Schools (NCES district)
- District
- Holly Area School District
- NCES district ID
- 2618450
- Math proficiency
- 31% ▼ -12.00%
- Reading proficiency
- 52% ▼ -7.00%
- Median HH income
- $65,137
- Composite
- 37.1/100
- National rank
- #4496
- State rank
- #165 of 540 in MI
Livability — Holly
- Score
- 75/100
- State rank
- #156
- US rank
- #3930
Category grades
Schools grade is shown separately in the Schools card above.
Census & demographics
- City population
- 22,788
- Population (ZIP)
- 7,866
Population outlook (Oakland County) Hauer SSP2
- Today (2025)
- 1,335,747 people
- By 2030
- 1,375,100 · +2.9%
- By 2040
- 1,435,385 · +7.5%
- By 2050
- 1,469,250 · +10.0%
- By 2075
- 1,531,946 · +14.7%
- By 2100
- 1,450,485 · +8.6%
Race, ethnicity, and origin ACS 2023
- Neighborhood character
- Predominantly White (95%)
- Race & ethnicity
- White 95% Two or more races 3% Hispanic / Latino 2%
- Common ancestry
- Romanian 9% Lithuanian 3% Slovak 2%
- Foreign-born
- 2% · Canada, Vietnam
Political lean MEDSL · Oakland
- 2024 margin
- D (+10.6) · D 54.4% · R 43.8% · Other 1.9%
- 2008→2024 swing
- -3.9pp toward R · 2008: 14.5pp · 2024: 10.6pp
- All cycles
- 2024: D+10.6 2020: D+14.1 2016: D+8.1 2012: D+8.1 2008: D+14.5
Not yet ingested
- Civics
- —
Market trends
- HPI YoY
- ▼ -182.53%
- Current HPI
- 195.1903
- Rent YoY
- —
- Metro
- —
- State GDP YoY
- ▲ 1.37%
- F500 in state
- 28
Industry mix (Fortune 500 HQ in MI)
| Industry | F500 HQs | Revenue |
|---|---|---|
| Automotive Parts | 3 | $48B |
|
||
| Automotive | 2 | $372B |
|
||
| Chemicals | 1 | $45B |
|
||
| Automotive Retail | 1 | $29B |
|
||
| Healthcare / Medical Devices | 1 | $23B |
|
||
| Automotive Technology | 1 | $20B |
|
||
Price history
+91.8% since first listed13 events — show timeline
- 2026-05-14 Pending — MiRealSource-MiMLS
- 2026-05-14 Pending — REALCOMP
- 2026-05-01 Listed $280,000 REALCOMP
- 2026-05-01 Listed $280,000 MiRealSource-MiMLS
- 2006-05-03 Listing Removed — REALCOMP
- 2005-11-07 Listed $199,900 REALCOMP
- 2003-01-29 Listing Removed — REALCOMP
- 2003-01-27 Listing Removed — MiRealSource-MiMLS
- 2002-09-05 Listing Removed — REALCOMP
- 2002-07-29 Listed $169,999 REALCOMP
- 2002-07-28 Listed $169,899 REALCOMP
- 2002-07-28 Listed $169,899 MiRealSource-MiMLS
- 1999-03-08 Sold (Public Records) $146,000 Public Records
Property tax history
+3.3%/yrLatest (2025): $2,336 · +2.7% YoY. Source: county tax records.
Cash-flow waterfall
monthlySold comps — $/sqft
last 12 mo · ≤1 miLoading sold comps…