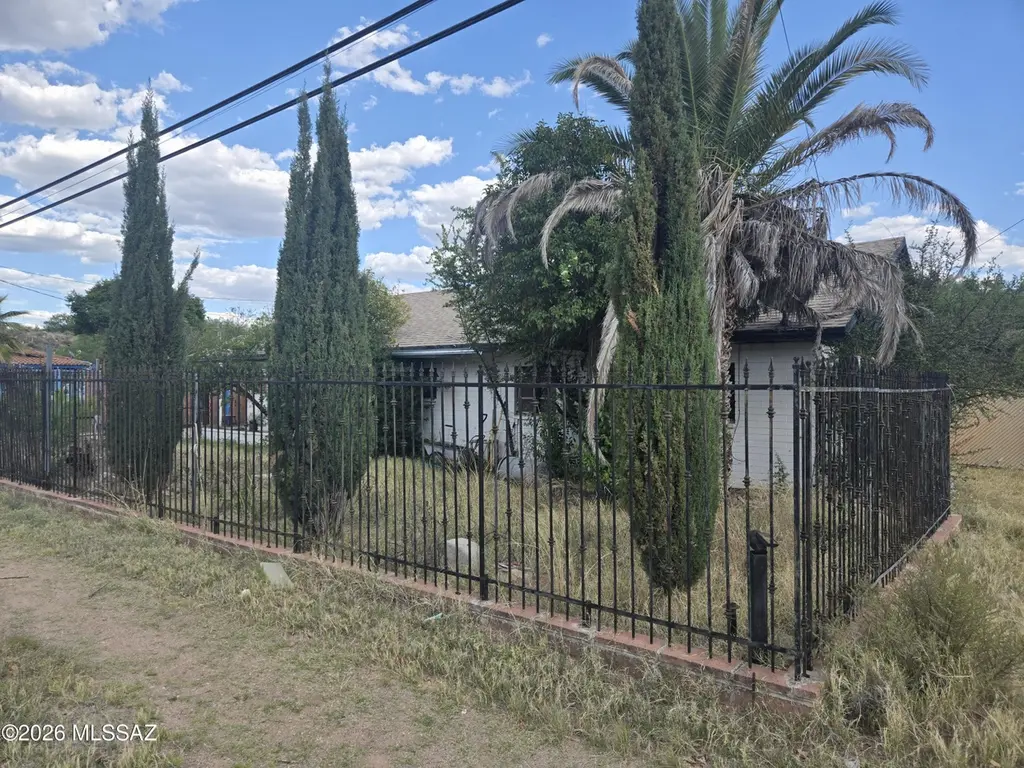
964 Highway 82 · Rio Rico, AZ
Flood risk 1/10 · Minimal
- FEMA flood zone
- X (unshaded)
- Chance of flooding over 30 yrs
- 0.0%
- Est. flood insurance / yr
- $507 – $1,088
Fire risk 7/10 · Major
- Est. fire insurance / yr
- $610 – $1,132
Heat risk 6/10 · Moderate
- Hot days now (above 98°F)
- 7 days/yr
- Hot days in 30 yrs
- 20 days/yr
Wind risk 1/10 · Minimal
- Chance of severe wind over 30 yrs
- —
Air-quality risk 1/10 · Minimal
- Unhealthy air days now
- 0 days/yr
- Unhealthy air days in 30 yrs
- 0 days/yr
Risk factors via First Street. Map © Google.
Why this score? — see what drove the B- grade
The composite is a weighted blend of 9 inputs, each scored 0–100. Each bar is that input's sub-score; the figure is the points it added to the 100-point composite (weight × sub-score).
- Cash flow +25.3/30.0
- Appreciation +10.0/10.0
- DSCR +8.3/10.0
- ARV discount +7.5/15.0
- 1% rule +5.5/10.0
- Schools +4.4/10.0
- Livability +3.2/5.0
- Rent growth +2.5/5.0
- Condition / age +2.5/5.0
$150,000
🖨 Deal sheet 📄 Offer letter ✓ Due diligence
Listing remarks
Spacious 5-bedroom home built in 1960, offering great potential for investors or buyers looking to create their dream property. Situated on a highly desirable main road, this property provides excellent accessibility and visibility. Conveniently located near the Mexican border, making it ideal for those who value proximity for travel or business. This home is a true fixer-upper and will require significant repairs and updates, but with the right vision, it can be transformed into a fantastic residence or income-producing property given a multi-family zone. Generous layout with ample room to reimagine living spaces, bedrooms, and more. Opportunity awaits--bring your tools and creativity to u
Key facts
- Multi-family zone
- Roof was redone
- 9,147 sq ft lot
Tags
Property features AI
Finance
- Other: Property zoning: SCC - CON
Exterior
- Parking: Attached garage; 2 covered/carport spaces; On-site storage
- Security: Window bars; Security screens; Security gate
- Utilities: Water from a water company; Septic tank
- Home design: Single-family home; One story
- Construction: Brick construction; Shingle roof
- Exterior features: Patio; Chain-link and wrought-iron fencing; Shrubs; North/South exposure; Chip-and-seal road access (county maintained)
Interior
- Kitchen: Gas oven
- Flooring: Ceramic tile flooring
- Bathrooms: 2 full bathrooms
- Heating & cooling: Evaporative cooling
- Interior features: Gas oven; Wood-burning fireplace in the living room
- Laundry & utility: Outdoor laundry area
Neighborhood map
What this means for you Summary
Snapshot
- This is a 5-bed/2.0-bath single-family listed at $150k.
Deal economics
- At list price, monthly cash flow is $339 ($4k/yr) — positive.
- The deal already cash-flows at list — no discount required.
- Meets the 1% rule at list price ($2k rent vs $150k).
- Recommended offer: $141k (6.0% below list) — sets the bar for market timing.
- Cap rate 9.0% vs local median 4.1% in Rio Rico — top-decile yield for the area; either an underpriced asset or a hidden risk that comps aren't pricing in. Stress-test before assuming the spread holds.
Location & tenants
- Location reads 63/100 on livability (#115 in AZ) — a middle-class / working-renter tenant base. Strengths: cost of living A+, housing A+; Watch: health & safety C-, employment D+, schools F.
- Santa Cruz Elementary District (4459) (rural): math 45% / reading 55% proficiency, ranked #129 of 501 in AZ (top 26%) — acceptable for families but not a draw, mixed tenant base, ~2y average lease.
- Market conditions: 72 active listings in the ZIP; 340 units permitted in Santa Cruz County in 2024 (0 in 5+ unit buildings).
Forward outlook
- In year one you build about $16k of equity ($1k loan paydown + $15k appreciation (10.0% local appreciation)).
- Santa Cruz County population projected at -22% by 2050 — secular population decline; favor cash flow + early exit over multi-decade hold.
- At projected returns (10.0% appreciation + 3.0% rent growth), your $42k cash investment doubles in ~2 years — after that, you're playing with house money.
- By year 3, paydown + projected appreciation supports a ~$41k cash-out refi (75% LTV) — recoverable capital for the next deal without selling this one.
Negotiation context
- It's been on market 66 days — a 6% lower offer ($141k) is reasonable based on typical stale-listing flexibility.
Risks & watch-outs
- Climate carrying-cost: major wildfire risk; extreme-heat days projected 7→20/yr by 2055 (HVAC capex compounding) — expect insurance premiums to compound above CPI over the hold.
Questions for the listing agent
- It's been on market 66 days. Have you received any prior offers? Is the seller open to a 6% concession, seller financing, or rate buy-down credit?
- Built in 1960 — when were the roof, HVAC, electrical panel, plumbing, and water heater last replaced?
- Why hasn't it sold? Are there any deal-killer items the seller is aware of (foundation, flood, title, zoning, code violations)?
- Is there a deadline driving the sale (1031 exchange, divorce, estate, relocation)? That informs how much negotiation room exists.
- Schools are F-rated, which usually means shorter tenancies and higher turnover. Who's the typical renter profile here, and what's been the actual vacancy rate?
- Crime grade is F in this area — have there been break-ins, vandalism, or insurance claims at this property in the last 3 years? What carrier currently insures it and at what premium?
- What's the average days-on-market for RENTAL listings here right now (not sales)? A rising rental-DOM trend means longer vacancies and softer asking-rent achievability than the comps imply.
- What's the recent tenant-quality profile in this submarket — average credit score on applications, eviction rate, late-payment / NSF rate, and stable-employment percentage? A property-management company in the area should have these aggregated.
- How much new for-sale + rental construction is in the pipeline within 1–3 miles? Heavy new supply typically softens prices + rents 12–24 months out; constrained supply supports both.
Investment metrics
- 1% rule
- 1.05% ✓
- Cap rate
- 9.00%
- Cash-on-cash
- 9.68%
- DSCR
- 1.43
- GRM
- 7.9
CMA / ARV
No comps found within radius.
Projected returns pro-forma
10.0% appreciation · 3.0% rent growth · sell at horizon
- IRR
- 31.3%
- Equity multiple
- 3.46×
- Total profit
- $103,209
- Equity at exit
- $135,132
- IRR
- 27.1%
- Equity multiple
- 7.83×
- Total profit
- $286,861
- Equity at exit
- $291,417
Cash invested: $42,000 (down + closing). Projections, not guarantees.
Landlord ↔ Tenant lean methodology
- Overall (STATE)
- 87 Strongly Landlord-Friendly
- State Arizona
- 87 Strongly Landlord-Friendly · R+3
- County
- — inherits STATE
- City
- — inherits STATE
ZIP-level market 85621
- Home prices YoY
- 16.5%
- Active inventory
- 72
- Price-to-rent
- 7.9×
Monthly cashflow live
- Estimated rent
- $1,578 medium interval (Pro) →
- Mortgage (P&I)
- −$787
- Tax from tax record
- −$59 /mo · $709/yr
- Insurance
- −$62
- HOA
- −$0
- Vacancy / Maint / Mgmt
- −$331
- Net cashflow
- $339
Break-even live
UW: 25.0% down · 7.5% · 30yr · 1.5% tax · 5.0% vac · 8.0% maint · 8.0% mgmt
Financing live
Cash to close
- Down payment
- $37,500
- Closing costs
- $4,500
- Reserves months
- —
- Total cash needed
- —
Loan-product check · same deal, 3 products live
Conventional
25% down · 7.5% · 30yr
- Down + closing
- —
- Monthly P&I
- —
- Monthly cashflow
- —
- DSCR
- —
- Eligible?
- —
Personal DTI + credit; lowest rate.
DSCR
20% down · 8.5% · 30yr
- Down + closing
- —
- Monthly P&I
- —
- Monthly cashflow
- —
- DSCR
- —
- Eligible?
- —
No personal income docs; deal must DSCR.
Hard money
10% down · 12.0% · 12mo
- Down + closing
- —
- Monthly P&I
- —
- Monthly cashflow
- —
- DSCR
- —
- Eligible?
- —
Short-term bridge; refi at stabilization.
Listing history 18 events
-
2026-06-19days on market $150,000 Active 66 DOM
-
2026-06-18days on market $150,000 Active 65 DOM
-
2026-06-17days on market $150,000 Active 64 DOM
-
2026-06-16days on market $150,000 Active 63 DOM
-
2026-06-16price $150,000 Active 62 DOM
-
2026-06-15days on market $160,000 Active 62 DOM
-
2026-06-14days on market $160,000 Active 60 DOM
-
2026-06-12days on market $160,000 Active 59 DOM
-
2026-06-09days on market $160,000 Active 56 DOM
-
2026-06-08days on market $160,000 Active 55 DOM
-
2026-06-07days on market $160,000 Active 54 DOM
-
2026-06-05days on market $160,000 Active 52 DOM
-
2026-06-04days on market $160,000 Active 50 DOM
-
2026-06-02days on market $160,000 Active 49 DOM
-
2026-06-01days on market $160,000 Active 48 DOM
-
2026-05-31days on market $160,000 Active 47 DOM
-
2026-05-31days on market $160,000 Active 46 DOM
-
2026-04-14$160,000 Active
ⓘ Source: listings_history table (triggers on properties + properties_extension) + one-shot
backfill from property_details.listing_events for pre-trigger history.
Tax reassessment forecast AZ · Resets to sale price
- Current annual tax
- $709 · $59/mo
- Projected year-2 tax
- $990 · $82/mo
- Expected delta
- +$281/yr (+$23/mo · 39.7%)
ⓘ Screening estimate from a state-policy table — verify with the county assessor before closing.
Climate risk First Street
- Flood 1/10 Low FEMA zone X (unshaded) · 0% chance over 30 yrs
- Wildfire 7/10 Severe
- Heat 6/10 Major 7 d/yr ≥98°F today · 20 d/yr by 30 yrs out
- Wind 1/10 Low
- Air quality 1/10 Low 0 unhealthy d/yr today · 0 by 30 yrs out
Nearby sold comps map
Loading sold comps map…
Walkable amenities ~0.75 mi
Loading nearby amenities…
Taxation est. · year 1
- Rental income
- $18,939
- − Mortgage interest
- −$8,402
- − Property taxes
- −$709
- − Insurance
- −$750
- − Repairs & maintenance
- −$1,515
- − Management
- −$1,515
- − Depreciation
- −$4,364
- Taxable income
- $1,684
- Est. tax owed @ 24.0%
- −$404
- After-tax cash flow
- $3,660/yr
For passive investors: Depreciation is non-cash, so a rental often shows a tax loss while cash-flowing — sheltering income. Rental losses are passive: they offset passive income freely, and up to $25,000/yr can offset ordinary (W-2) income if you actively participate and your MAGI is under $100k (phasing out to $0 by $150k); unused losses carry forward. On sale, claimed depreciation is recaptured at up to 25%, and gains may owe capital-gains tax (a 1031 exchange can defer both). Figures are a year-1 estimate at your 24.0% rate — not tax advice; consult a CPA.
Schools (NCES district)
- District
- Santa Cruz Elementary District (4459)
- NCES district ID
- 0407500
- Math proficiency
- 45% ▼ -5.00%
- Reading proficiency
- 55% ▬ 0.00%
- Median HH income
- $44,772
- Composite
- 44.28/100
- National rank
- #6166
- State rank
- #129 of 501 in AZ
Livability — Rio Rico
- Score
- 63/100
- State rank
- #115
- US rank
- #15321
Category grades
Schools grade is shown separately in the Schools card above.
Census & demographics
- City population
- 22,118
- Population (ZIP)
- 21,512
Population outlook (Santa Cruz County) Hauer SSP2
- Today (2025)
- 43,796 people
- By 2030
- 42,097 · -3.9%
- By 2040
- 38,235 · -12.7%
- By 2050
- 34,224 · -21.9%
- By 2075
- 26,014 · -40.6%
- By 2100
- 18,165 · -58.5%
Race, ethnicity, and origin ACS 2023
- Neighborhood character
- Predominantly Hispanic (93%)
- Race & ethnicity
- Hispanic / Latino 93% Two or more races 51% White 5%
- Hispanic origin (detail)
- Mexican 91%
- Foreign-born
- 44% · Canada
- Languages at home
- 9% English-only · Spanish 91%
Political lean MEDSL · Santa Cruz
- 2024 margin
- D (+18.6) · D 58.9% · R 40.3%
- 2008→2024 swing
- -12.7pp toward R · 2008: 31.3pp · 2024: 18.6pp
- All cycles
- 2024: D+18.6 2020: D+35.5 2016: D+47.1 2012: D+37.8 2008: D+31.3
Not yet ingested
- Civics
- —
Market trends
- HPI YoY
- ▲ 54.62%
- Current HPI
- 385.6724
- Rent YoY
- —
- Metro
- —
- State GDP YoY
- ▲ 4.54%
- F500 in state
- 20
Industry mix (Fortune 500 HQ in AZ)
| Industry | F500 HQs | Revenue |
|---|---|---|
| Technology | 2 | $13B |
|
||
| Mining / Metals | 1 | $23B |
|
||
| Environmental Services | 1 | $16B |
|
||
| Metals / Steel | 1 | $14B |
|
||
| Technology Distribution | 1 | $9B |
|
||
| Homebuilding | 1 | $8B |
|
||
Price history
1 event — show timeline
- 2026-04-14 Listed $160,000 MLSSAZ
Property tax history
+1.1%/yrLatest (2025): $709 · +5.8% YoY. Source: county tax records.
Cash-flow waterfall
monthlySold comps — $/sqft
last 12 mo · ≤1 miLoading sold comps…