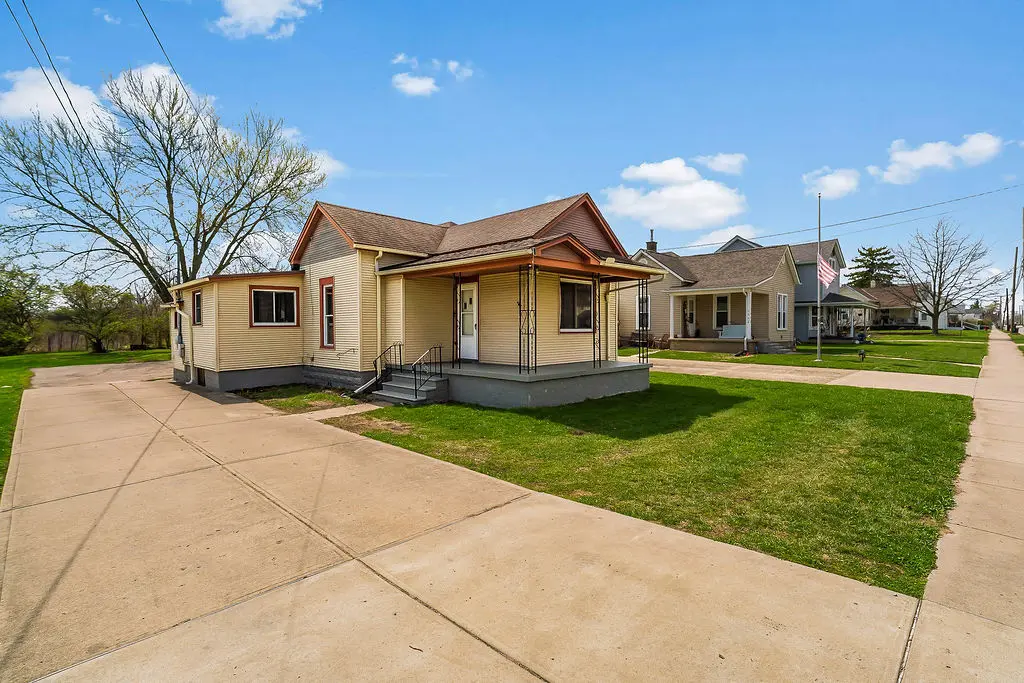
1504 W Main St · New Lebanon, OH
Flood risk 1/10 · Minimal
- FEMA flood zone
- X (unshaded)
- Chance of flooding over 30 yrs
- 0.0%
- Est. flood insurance / yr
- $507 – $1,088
Fire risk 1/10 · Minimal
- Est. fire insurance / yr
- $713 – $1,323
Heat risk 3/10 · Minor
- Hot days now (above 100°F)
- 7 days/yr
- Hot days in 30 yrs
- 19 days/yr
Wind risk 2/10 · Minimal
- Chance of severe wind over 30 yrs
- 1.0%
Air-quality risk 2/10 · Minimal
- Unhealthy air days now
- 1 days/yr
- Unhealthy air days in 30 yrs
- 2 days/yr
Risk factors via First Street. Map © Google.
Why this score? — see what drove the D+ grade
The composite is a weighted blend of 9 inputs, each scored 0–100. Each bar is that input's sub-score; the figure is the points it added to the 100-point composite (weight × sub-score).
- ARV discount +10.2/15.0
- Appreciation +10.0/10.0
- Cash flow +8.7/30.0
- Schools +4.2/10.0
- Livability +3.5/5.0
- 1% rule +3.0/10.0
- Rent growth +2.5/5.0
- Condition / age +2.5/5.0
- DSCR +2.4/10.0
$125,000
🖨 Deal sheet 📄 Offer letter ✓ Due diligence
Listing remarks MLS
Welcome to a charming 2-bedroom, 1-bathroom home offering 816 square feet of comfortable living space. This well-maintained home features a large kitchen, perfect for preparing meals and entertaining. Throughout the house, you'll notice tall ceilings that add a sense of openness and character to each room. Currently rented, this property offers an excellent opportunity for investors looking for reliable rental income. Whether you're starting your homeownership journey or adding to your investment portfolio, 1504 W Main St. is a fantastic option with great potential.
Key facts
- Bright living space
- Spacious yard
- Front porch
Tags
Neighborhood map
What this means for you Summary
Snapshot
- This is a 3-bed/1.0-bath single-family listed at $125k.
Deal economics
- At list price, monthly cash flow is $-105 ($-1k/yr) — negative.
- To cash-flow at today's rent, offer at most $106k (14.8% below list).
- To meet the 1% rule (rent ≥ 1% of price), the offer needs to be $100k (20.0% below list).
- Recommended offer: $100k (20.0% below list) — sets the bar for 1% rule.
Location & tenants
- Location reads 70/100 on livability (#450 in OH) — a middle-class / working-renter tenant base. Strengths: cost of living A+, housing A+, crime A; Watch: employment C-, amenities F, commute F.
- New Lebanon Local (town): math 43% / reading 56% proficiency, ranked #448 of 656 in OH (top 68%) — families likely to look elsewhere, expect single-tenant / working-renter base with shorter leases.
- Market conditions: 20 active listings in the ZIP; 1 comparable units currently listed for rent nearby; solid renter incomes; 907 units permitted in Montgomery County in 2024 (416 in 5+ unit buildings).
- This rent is only 16% of the median local income ($77k/yr) — well below the 30% rent-burden line; pricing power to push rent on renewal without tenant pushback.
Forward outlook
- In year one you build about $13k of equity ($864 loan paydown + $12k appreciation (10.0% local appreciation)).
- Montgomery County population projected at -10% by 2050 — secular population decline; favor cash flow + early exit over multi-decade hold.
- By year 3, paydown + projected appreciation supports a ~$34k cash-out refi (75% LTV) — recoverable capital for the next deal without selling this one.
Negotiation context
- Only 7 days on market — expect competitive offers; lowballing is unlikely to land.
- 3 sale attempts since 2y ago with the ask held roughly flat each time — persistent listings suggest the price (not the market) is what's stuck; bring a comps-based counter.
- Current owner paid $85k; 47% above their basis — modest negotiation headroom, anchor on the comps not their cost.
Risks & watch-outs
- Watch-outs: built in 1904 — expect roof / HVAC / electrical / plumbing capex.
Questions for the listing agent
- What do current leases actually rent for vs. the listed asking? Can we see a recent rent roll and the last 12 months of T-12 income?
- Built in 1904 — when were the roof, HVAC, electrical panel, plumbing, and water heater last replaced?
- Is there a deadline driving the sale (1031 exchange, divorce, estate, relocation)? That informs how much negotiation room exists.
- Schools are B-rated — typically a magnet for longer-tenancy family renters. What's the average tenant stay here, and is there a school-zone premium baked into asking?
- The area grade is low — what's the realistic commute time and amenity access for the typical tenant pool here? Any planned neighborhood developments (good or bad) we should know about?
- What's the average days-on-market for RENTAL listings here right now (not sales)? A rising rental-DOM trend means longer vacancies and softer asking-rent achievability than the comps imply.
- What's the recent tenant-quality profile in this submarket — average credit score on applications, eviction rate, late-payment / NSF rate, and stable-employment percentage? A property-management company in the area should have these aggregated.
- How much new for-sale + rental construction is in the pipeline within 1–3 miles? Heavy new supply typically softens prices + rents 12–24 months out; constrained supply supports both.
Investment metrics
- 1% rule
- 0.80% ✗
- Cap rate
- 5.28%
- Cash-on-cash
- -3.60%
- DSCR
- 0.84
- GRM
- 10.4
CMA / ARV
- ARV (on-the-fly)
- $133,008
- Comps found
- 1
Show comp detail 1 sale within ~0.75 mi
| Address | Dist | Beds/Ba | Sqft | Sold | Price | $/sf | Match |
|---|---|---|---|---|---|---|---|
| 1504 W Main St | 0.00mi | 2/1.0 (-1) | 816 (0%) | 1mo | $133,000 | $163 | 94 |
Match score weights: distance 35% · size 25% · config 20% · recency 20%. Top-matched comps best support the ARV.
Projected returns pro-forma
10.0% appreciation · 3.0% rent growth · sell at horizon
- IRR
- 21.7%
- Equity multiple
- 2.75×
- Total profit
- $61,421
- Equity at exit
- $112,610
- IRR
- 19.6%
- Equity multiple
- 6.32×
- Total profit
- $186,206
- Equity at exit
- $242,848
Cash invested: $35,000 (down + closing). Projections, not guarantees.
Landlord ↔ Tenant lean methodology
- Overall (STATE)
- 73 Landlord-Friendly
- State Ohio
- 73 Landlord-Friendly · R+6
- County
- — inherits STATE
- City
- — inherits STATE
ZIP-level market 45345
- Home prices YoY
- 8.0%
- Active inventory
- 20
- Price-to-rent
- 10.4×
Monthly cashflow live
- Estimated rent
- $1,000 medium interval (Pro) →
- Mortgage (P&I)
- −$656
- Tax from tax record
- −$187 /mo · $2,250/yr
- Insurance
- −$52
- HOA
- −$0
- Vacancy / Maint / Mgmt
- −$210
- Net cashflow
- $-105
Break-even live
UW: 25.0% down · 7.5% · 30yr · 1.5% tax · 5.0% vac · 8.0% maint · 8.0% mgmt
Financing live
Cash to close
- Down payment
- $31,250
- Closing costs
- $3,750
- Reserves months
- —
- Total cash needed
- —
Loan-product check · same deal, 3 products live
Conventional
25% down · 7.5% · 30yr
- Down + closing
- —
- Monthly P&I
- —
- Monthly cashflow
- —
- DSCR
- —
- Eligible?
- —
Personal DTI + credit; lowest rate.
DSCR
20% down · 8.5% · 30yr
- Down + closing
- —
- Monthly P&I
- —
- Monthly cashflow
- —
- DSCR
- —
- Eligible?
- —
No personal income docs; deal must DSCR.
Hard money
10% down · 12.0% · 12mo
- Down + closing
- —
- Monthly P&I
- —
- Monthly cashflow
- —
- DSCR
- —
- Eligible?
- —
Short-term bridge; refi at stabilization.
Rent comps 1 comps
| Address | Beds | Baths | Sqft | Rent | $/sqft | DOM | Units | Dist |
|---|---|---|---|---|---|---|---|---|
| 53 Gloria Ave Unit 53 New Lebanon, OH | 2.0 | 1.0 | 834 | $1,000 | $1.20 | 2d | 1 | 1.31mi |
Listing history 10 events
-
2026-04-10status Pending
-
2026-04-03$125,000 Active
-
2026-04-03$125,000 Active
-
2025-04-25soldstatus $85,000 Closed 572-char remark
Show marketing remark (572 chars)
Welcome to a charming 2-bedroom, 1-bathroom home offering 816 square feet of comfortable living space. This well-maintained home features a large kitchen, perfect for preparing meals and entertaining. Throughout the house, you'll notice tall ceilings that add a sense of openness and character to each room. Currently rented, this property offers an excellent opportunity for investors looking for reliable rental income. Whether you're starting your homeownership journey or adding to your investment portfolio, 1504 W Main St. is a fantastic option with great potential.
-
2025-03-10status Pending 572-char remark
Show marketing remark (572 chars)
Welcome to a charming 2-bedroom, 1-bathroom home offering 816 square feet of comfortable living space. This well-maintained home features a large kitchen, perfect for preparing meals and entertaining. Throughout the house, you'll notice tall ceilings that add a sense of openness and character to each room. Currently rented, this property offers an excellent opportunity for investors looking for reliable rental income. Whether you're starting your homeownership journey or adding to your investment portfolio, 1504 W Main St. is a fantastic option with great potential.
-
2025-01-01price $100,000 572-char remark
Show marketing remark (572 chars)
Welcome to a charming 2-bedroom, 1-bathroom home offering 816 square feet of comfortable living space. This well-maintained home features a large kitchen, perfect for preparing meals and entertaining. Throughout the house, you'll notice tall ceilings that add a sense of openness and character to each room. Currently rented, this property offers an excellent opportunity for investors looking for reliable rental income. Whether you're starting your homeownership journey or adding to your investment portfolio, 1504 W Main St. is a fantastic option with great potential.
-
2024-11-24price $110,000 572-char remark
Show marketing remark (572 chars)
Welcome to a charming 2-bedroom, 1-bathroom home offering 816 square feet of comfortable living space. This well-maintained home features a large kitchen, perfect for preparing meals and entertaining. Throughout the house, you'll notice tall ceilings that add a sense of openness and character to each room. Currently rented, this property offers an excellent opportunity for investors looking for reliable rental income. Whether you're starting your homeownership journey or adding to your investment portfolio, 1504 W Main St. is a fantastic option with great potential.
-
2024-11-14$120,000 Active 572-char remark
Show marketing remark (572 chars)
Welcome to a charming 2-bedroom, 1-bathroom home offering 816 square feet of comfortable living space. This well-maintained home features a large kitchen, perfect for preparing meals and entertaining. Throughout the house, you'll notice tall ceilings that add a sense of openness and character to each room. Currently rented, this property offers an excellent opportunity for investors looking for reliable rental income. Whether you're starting your homeownership journey or adding to your investment portfolio, 1504 W Main St. is a fantastic option with great potential.
-
1995-08-02soldstatus $49,900
-
1991-09-11soldstatus $45,000
ⓘ Source: listings_history table (triggers on properties + properties_extension) + one-shot
backfill from property_details.listing_events for pre-trigger history.
Tax reassessment forecast OH · Partial reset (capped growth)
- Current annual tax
- $2,250 · $187/mo
- Projected year-2 tax
- $2,250 · $187/mo
- Expected delta
- $0/yr ($0/mo · 0.0%)
ⓘ Screening estimate from a state-policy table — verify with the county assessor before closing.
Climate risk First Street
- Flood 1/10 Low FEMA zone X (unshaded) · 0% chance over 30 yrs
- Wildfire 1/10 Low
- Heat 3/10 Moderate 7 d/yr ≥100°F today · 19 d/yr by 30 yrs out
- Wind 2/10 Low 100% chance of damaging wind over 30 yrs
- Air quality 2/10 Low 1 unhealthy d/yr today · 2 by 30 yrs out
Nearby sold comps map
Loading sold comps map…
Walkable amenities ~0.75 mi
Loading nearby amenities…
Taxation est. · year 1
- Rental income
- $12,000
- − Mortgage interest
- −$7,002
- − Property taxes
- −$2,250
- − Insurance
- −$625
- − Repairs & maintenance
- −$960
- − Management
- −$960
- − Depreciation
- −$3,636
- Taxable loss
- −$3,433
- Est. tax savings @ 24.0%
- +$824
- After-tax cash flow
- $-437/yr
For passive investors: Depreciation is non-cash, so a rental often shows a tax loss while cash-flowing — sheltering income. Rental losses are passive: they offset passive income freely, and up to $25,000/yr can offset ordinary (W-2) income if you actively participate and your MAGI is under $100k (phasing out to $0 by $150k); unused losses carry forward. On sale, claimed depreciation is recaptured at up to 25%, and gains may owe capital-gains tax (a 1031 exchange can defer both). Figures are a year-1 estimate at your 24.0% rate — not tax advice; consult a CPA.
Schools (NCES district)
- District
- New Lebanon Local
- NCES district ID
- 3904871
- Math proficiency
- 43% ▼ -19.00%
- Reading proficiency
- 56% ▼ -7.00%
- Median HH income
- $45,363
- Composite
- 41.88/100
- National rank
- #3369
- State rank
- #448 of 656 in OH
Livability — New Lebanon
- Score
- 70/100
- State rank
- #450
- US rank
- #7342
Category grades
Schools grade is shown separately in the Schools card above.
Census & demographics
- Census place
- New Lebanon, OH
- County
- Montgomery · 506,435 people
- City population
- 5,923
- Metro
- Dayton-Kettering-Beavercreek, OH
- Population (ZIP)
- 5,923
- Household income
- $77,279
- Rent vs Own
- Severe rent burden
- 8.9
Population outlook (Montgomery County) Hauer SSP2
- Today (2025)
- 523,241 people
- By 2030
- 514,948 · -1.6%
- By 2040
- 493,378 · -5.7%
- By 2050
- 469,639 · -10.2%
- By 2075
- 418,360 · -20.0%
- By 2100
- 353,315 · -32.5%
Race, ethnicity, and origin ACS 2023
- Neighborhood character
- Predominantly White (92%)
- Race & ethnicity
- White 92% Two or more races 6% Black 2%
- Common ancestry
- Romanian 3% Slovak 1% Scottish 1%
- Foreign-born
- 0% · China
- Languages at home
- 98% English-only · Spanish 1% German/W. Germanic 1%
Political lean MEDSL · Montgomery
- 2024 margin
- Toss-up / Even · D 49.8% · R 49.3%
- 2008→2024 swing
- -5.8pp toward R · 2008: 6.2pp · 2024: 0.5pp
- All cycles
- 2024: D+0.5 2020: D+2.2 2016: R+1.2 2012: D+3.1 2008: D+6.2
Not yet ingested
- Civics
- —
Market trends
- HPI YoY
- ▲ 27.56%
- Current HPI
- 370.29
- Rent YoY
- —
- Metro
- —
- State GDP YoY
- ▲ 1.98%
- F500 in state
- 48
Industry mix (Fortune 500 HQ in OH)
| Industry | F500 HQs | Revenue |
|---|---|---|
| Insurance | 3 | $145B |
|
||
| Industrial Machinery | 3 | $49B |
|
||
| Financial Services | 3 | $24B |
|
||
| Consumer Goods | 2 | $93B |
|
||
| Aerospace / Defense | 2 | $47B |
|
||
| Utilities | 2 | $33B |
|
||
Price history
+177.8% since first listed10 events — show timeline
- 2026-04-10 Pending — Dayton MLS
- 2026-04-03 Listed $125,000 Cincy MLS
- 2026-04-03 Listed $125,000 Dayton MLS
- 2025-04-25 Sold (MLS) $85,000 Dayton MLS
- 2025-03-10 Pending — Dayton MLS
- 2025-01-01 Price Changed $100,000 Dayton MLS
- 2024-11-24 Price Changed $110,000 Dayton MLS
- 2024-11-14 Listed $120,000 Dayton MLS
- 1995-08-02 Sold (Public Records) $49,900 Public Records
- 1991-09-11 Sold (Public Records) $45,000 Public Records
Property tax history
+3.3%/yrLatest (2025): $2,250 · -0.1% YoY. Source: county tax records.
Cash-flow waterfall
monthlySold comps — $/sqft
last 12 mo · ≤1 miLoading sold comps…