22 Sandy Ln · Elmer, LA
Flood risk 1/10 · Minimal
- FEMA flood zone
- X
- Chance of flooding over 30 yrs
- 0.0%
- Est. flood insurance / yr
- $507 – $1,088
Fire risk 6/10 · Moderate
- Est. fire insurance / yr
- $1,269 – $2,357
Heat risk 8/10 · Major
- Hot days now (above 111°F)
- 7 days/yr
- Hot days in 30 yrs
- 19 days/yr
Wind risk 8/10 · Major
- Chance of severe wind over 30 yrs
- 98.0%
Air-quality risk 1/10 · Minimal
- Unhealthy air days now
- 0 days/yr
- Unhealthy air days in 30 yrs
- 0 days/yr
Risk factors via First Street. Map © Google.
Why this score? — see what drove the B+ grade
The composite is a weighted blend of 9 inputs, each scored 0–100. Each bar is that input's sub-score; the figure is the points it added to the 100-point composite (weight × sub-score).
- Cash flow +29.4/30.0
- ARV discount +15.0/15.0
- DSCR +10.0/10.0
- 1% rule +7.7/10.0
- Appreciation +6.0/10.0
- Schools +3.1/10.0
- Rent growth +2.5/5.0
- Livability +2.5/5.0
- Condition / age +2.5/5.0
$100,000
🖨 Deal sheet 📄 Offer letter ✓ Due diligence
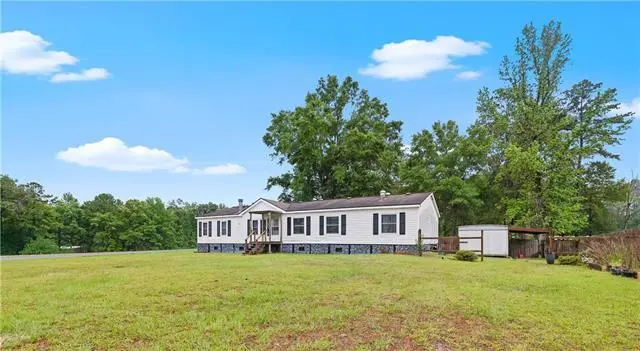
Listing remarks
5-bedroom, 3-bath home nestled in the peaceful countryside on over half an acre. This spacious property features a large back porch, a storage shed, and plenty of room to spread out and make it your own.
Key facts
- 0.66 acre lot
- Built 2000
Property features AI
Finance
- Other: Directions: Hwy 28W to Hwy 121 to Hwy 112 to Sandy Lane on Right. Bounding Streets: Hwy 112
Exterior
- Parking: No designated parking
- Home design: Manufactured home
- Construction: Composition roof; Other construction materials
- Exterior features: Privacy fencing; Other fencing; Workshop on the property
Interior
- Bedrooms: Bedroom 1; Bedroom 2; Bedroom 3; Bedroom 4
- Bathrooms: 3 full bathrooms
- Heating & cooling: Central heating; Central air conditioning
- Interior features: Living room; Dining room
Neighborhood map
What this means for you Summary
Snapshot
- This is a 5-bed/3.0-bath manufactured listed at $100k.
Deal economics
- At list price, monthly cash flow is $356 ($4k/yr) — positive.
- The deal already cash-flows at list — no discount required.
- Meets the 1% rule at list price ($1k rent vs $100k).
Location & tenants
- Location reads: area grade B — affects rentability + tenant quality, not the cash-flow math above.
- Rapides Parish (urban): math 29% / reading 44% proficiency, ranked #31 of 98 in LA (top 32%) — families likely to look elsewhere, expect single-tenant / working-renter base with shorter leases; 64% free/reduced lunch — lower-income household profile, screen leases tightly.
- Market conditions: 7 active listings in the ZIP; 239 units permitted in Rapides Parish in 2024 (0 in 5+ unit buildings).
Forward outlook
- In year one you build about $3k of equity ($691 loan paydown + $2k appreciation (1.9% local appreciation)).
- Rapides County population projected to shrink 6% by 2050 — rents likely to lag national; underwrite the cash flow, not the appreciation.
- At projected returns (1.9% appreciation + 3.0% rent growth), your $28k cash investment doubles in ~4 years — after that, you're playing with house money.
Negotiation context
- Only 1 days on market — expect competitive offers; lowballing is unlikely to land.
- 3 sale attempts since 8y ago with the ask held roughly flat each time — persistent listings suggest the price (not the market) is what's stuck; bring a comps-based counter.
- Current owner paid $85k; 18% above their basis — modest negotiation headroom, anchor on the comps not their cost.
Risks & watch-outs
- Climate carrying-cost: severe wind risk, 98% chance of damaging wind over 30y; major wildfire risk; extreme-heat days projected 7→19/yr by 2055 (HVAC capex compounding) — expect insurance premiums to compound above CPI over the hold.
Questions for the listing agent
- Is there a deadline driving the sale (1031 exchange, divorce, estate, relocation)? That informs how much negotiation room exists.
- What's the average days-on-market for RENTAL listings here right now (not sales)? A rising rental-DOM trend means longer vacancies and softer asking-rent achievability than the comps imply.
- What's the recent tenant-quality profile in this submarket — average credit score on applications, eviction rate, late-payment / NSF rate, and stable-employment percentage? A property-management company in the area should have these aggregated.
- How much new for-sale + rental construction is in the pipeline within 1–3 miles? Heavy new supply typically softens prices + rents 12–24 months out; constrained supply supports both.
Investment metrics
- 1% rule
- 1.27% ✓
- Cap rate
- 10.56%
- Cash-on-cash
- 15.25%
- DSCR
- 1.68
- GRM
- 6.6
CMA / ARV
- ARV (median comp)
- $170,000
- List price
- $100,000
- Delta
- -41.18%
- Verdict
- UNDERPRICED
- Comps
- 1 within 2.0 mi
Projected returns pro-forma
1.93% appreciation · 3.0% rent growth · sell at horizon
- IRR
- 19.4%
- Equity multiple
- 2.04×
- Total profit
- $29,150
- Equity at exit
- $39,055
- IRR
- 21.6%
- Equity multiple
- 3.83×
- Total profit
- $79,230
- Equity at exit
- $55,943
Cash invested: $28,000 (down + closing). Projections, not guarantees.
Landlord ↔ Tenant lean methodology
- Overall (STATE)
- 90 Strongly Landlord-Friendly
- State Louisiana
- 90 Strongly Landlord-Friendly · R+12
- County
- — inherits STATE
- City
- — inherits STATE
ZIP-level market 71424
- Home prices YoY
- 1.8%
- Active inventory
- 7
- Price-to-rent
- 6.6×
Monthly cashflow live
- Estimated rent
- $1,266 medium interval (Pro) →
- Mortgage (P&I)
- −$524
- Tax from tax record
- −$78 /mo · $941/yr
- Insurance
- −$42
- HOA
- −$0
- Vacancy / Maint / Mgmt
- −$266
- Net cashflow
- $356
Break-even live
UW: 25.0% down · 7.5% · 30yr · 1.5% tax · 5.0% vac · 8.0% maint · 8.0% mgmt
Financing live
Cash to close
- Down payment
- $25,000
- Closing costs
- $3,000
- Reserves months
- —
- Total cash needed
- —
Loan-product check · same deal, 3 products live
Conventional
25% down · 7.5% · 30yr
- Down + closing
- —
- Monthly P&I
- —
- Monthly cashflow
- —
- DSCR
- —
- Eligible?
- —
Personal DTI + credit; lowest rate.
DSCR
20% down · 8.5% · 30yr
- Down + closing
- —
- Monthly P&I
- —
- Monthly cashflow
- —
- DSCR
- —
- Eligible?
- —
No personal income docs; deal must DSCR.
Hard money
10% down · 12.0% · 12mo
- Down + closing
- —
- Monthly P&I
- —
- Monthly cashflow
- —
- DSCR
- —
- Eligible?
- —
Short-term bridge; refi at stabilization.
Listing history 6 events
-
2026-05-09status Pending 203-char remark
-
2026-05-07$100,000 Active 203-char remark
-
2019-05-17soldstatus $85,000
-
2019-02-26$115,000
-
2018-07-04$79,000
-
2011-03-30soldstatus $75,000
ⓘ Source: listings_history table (triggers on properties + properties_extension) + one-shot
backfill from property_details.listing_events for pre-trigger history.
Tax reassessment forecast LA · Resets to sale price
- Current annual tax
- $941 · $78/mo
- Projected year-2 tax
- $941 · $78/mo
- Expected delta
- $0/yr ($0/mo · -0.0%)
ⓘ Screening estimate from a state-policy table — verify with the county assessor before closing.
Climate risk First Street
- Flood 1/10 Low FEMA zone X · 0% chance over 30 yrs
- Wildfire 6/10 Major
- Heat 8/10 Severe 7 d/yr ≥111°F today · 19 d/yr by 30 yrs out
- Wind 8/10 Severe 98% chance of damaging wind over 30 yrs
- Air quality 1/10 Low 0 unhealthy d/yr today · 0 by 30 yrs out
Nearby sold comps map
Loading sold comps map…
Walkable amenities ~0.75 mi
Loading nearby amenities…
Taxation est. · year 1
- Rental income
- $15,196
- − Mortgage interest
- −$5,602
- − Property taxes
- −$941
- − Insurance
- −$500
- − Repairs & maintenance
- −$1,216
- − Management
- −$1,216
- − Depreciation
- −$2,909
- Taxable income
- $2,813
- Est. tax owed @ 24.0%
- −$675
- After-tax cash flow
- $3,596/yr
For passive investors: Depreciation is non-cash, so a rental often shows a tax loss while cash-flowing — sheltering income. Rental losses are passive: they offset passive income freely, and up to $25,000/yr can offset ordinary (W-2) income if you actively participate and your MAGI is under $100k (phasing out to $0 by $150k); unused losses carry forward. On sale, claimed depreciation is recaptured at up to 25%, and gains may owe capital-gains tax (a 1031 exchange can defer both). Figures are a year-1 estimate at your 24.0% rate — not tax advice; consult a CPA.
Schools (NCES district)
- District
- Rapides Parish
- NCES district ID
- 2201290
- Math proficiency
- 29% ▼ -34.00%
- Reading proficiency
- 44% ▼ -29.00%
- Median HH income
- $41,057
- Composite
- 30.68/100
- National rank
- #6179
- State rank
- #31 of 98 in LA
Livability — Elmer
No livability data for this city. (Only ~50 U.S. cities are tracked.)
Census & demographics
- Population (ZIP)
- 1,401
Population outlook (Rapides County) Hauer SSP2
- Today (2025)
- 133,047 people
- By 2030
- 132,333 · -0.5%
- By 2040
- 129,355 · -2.8%
- By 2050
- 124,535 · -6.4%
- By 2075
- 110,338 · -17.1%
- By 2100
- 88,641 · -33.4%
Race, ethnicity, and origin ACS 2023
- Neighborhood character
- Predominantly White (98%)
- Race & ethnicity
- White 98% Asian 2%
- Common ancestry
- Lithuanian 4% Iranian 2% Slovak 2%
- Foreign-born
- 2%
- Languages at home
- 98% English-only · Tagalog/Filipino 2%
Political lean MEDSL · Rapides
- 2024 margin
- Solid R (+36.8) · D 31.0% · R 67.7% · Other 1.3%
- 2008→2024 swing
- -8.1pp toward R · 2008: -28.7pp · 2024: -36.8pp
- All cycles
- 2024: R+36.8 2020: R+32.1 2016: R+32.5 2012: R+29.6 2008: R+28.7
Not yet ingested
- Civics
- —
Market trends
- HPI YoY
- ▲ 1.93%
- Current HPI
- 107.0083
- Rent YoY
- —
- Metro
- —
- State GDP YoY
- ▲ 3.29%
- F500 in state
- 10
Industry mix (Fortune 500 HQ in LA)
| Industry | F500 HQs | Revenue |
|---|---|---|
| Telecommunications | 2 | $23B |
|
||
| Utilities | 1 | $12B |
|
||
| Wholesale / Distribution | 1 | $5B |
|
||
| Advertising | 1 | $2B |
|
||
Price history
+33.3% since first listed6 events — show timeline
- 2026-05-09 Pending — AcadianaMLS
- 2026-05-07 Listed $100,000 AcadianaMLS
- 2019-05-17 Sold (Public Records) $85,000 Public Records
- 2019-02-26 Listed $115,000 AcadianaMLS
- 2018-07-04 Listed $79,000 AcadianaMLS
- 2011-03-30 Sold (Public Records) $75,000 Public Records
Property tax history
-2.8%/yrLatest (2025): $941 · +0.2% YoY. Source: county tax records.
Cash-flow waterfall
monthlySold comps — $/sqft
last 12 mo · ≤1 miLoading sold comps…