1615 W 15th St · Davenport, IA
Flood risk 1/10 · Minimal
- FEMA flood zone
- X (unshaded)
- Chance of flooding over 30 yrs
- 0.0%
- Est. flood insurance / yr
- $473 – $860
Fire risk 1/10 · Minimal
- Est. fire insurance / yr
- $902 – $1,676
Heat risk 3/10 · Minor
- Hot days now (above 103°F)
- 7 days/yr
- Hot days in 30 yrs
- 16 days/yr
Wind risk 2/10 · Minimal
- Chance of severe wind over 30 yrs
- —
Air-quality risk 3/10 · Minor
- Unhealthy air days now
- 2 days/yr
- Unhealthy air days in 30 yrs
- 3 days/yr
Risk factors via First Street. Map © Google.
Why this score? — see what drove the C+ grade
The composite is a weighted blend of 9 inputs, each scored 0–100. Each bar is that input's sub-score; the figure is the points it added to the 100-point composite (weight × sub-score).
- Cash flow +23.0/30.0
- ARV discount +15.0/15.0
- DSCR +7.4/10.0
- 1% rule +5.7/10.0
- Livability +4.0/5.0
- Schools +3.9/10.0
- Rent growth +3.5/5.0
- Condition / age +2.5/5.0
- Appreciation +0.0/10.0
$130,000
🖨 Deal sheet 📄 Offer letter ✓ Due diligence
Listing remarks
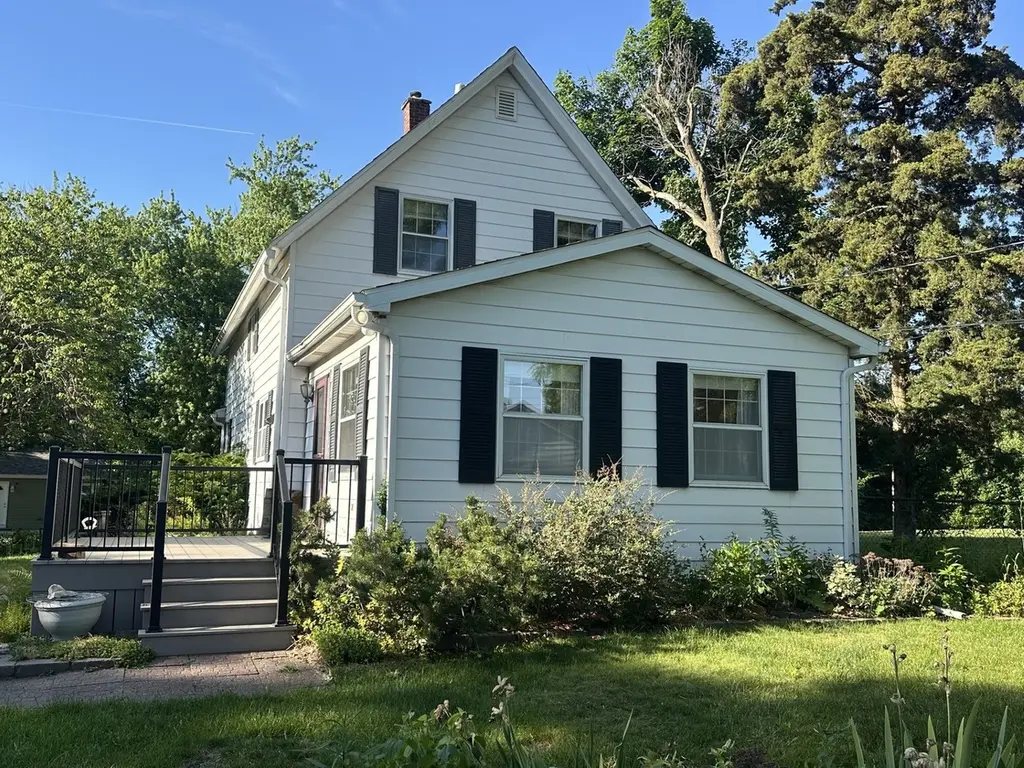
Opportunity awaits in this 4-bedroom home offering more than 1,400 finished square feet of living space. The main level features a spacious family room addition, kitchen with stainless steel appliances, flexible office space that could also serve as a dining room, full bathroom, and a large living room with hardwood flooring believed to be located beneath the existing carpet. Upstairs you'll find four bedrooms. Outside, enjoy a level 0.25-acre lot providing peaceful backyard space along with a shed, pergola patio area, and a newer composite deck located off the side entrance. The oversized detached 2+ car garage offers abundant storage and workspace, along with a natural gas heater that is
Key facts
- Hardwood flooring
- Newer composite deck
- Pergola patio area
Tags
Property features AI
Finance
- Other: Living area and size based on assessor records; Approx. finished living area reported as 1,408 (total finished/unfinshed 2,080); Lot dimensions approximately 73 x 150 (.25–.49 acre)
- Financial info: Special service area: No
- HOA & community: No master association fee required
Exterior
- Parking: Detached garage (concrete) — garage owned; 2 total parking spaces (2 garage spaces)
- Utilities: Public water; Public sewer; Cable available
- Home design: Detached single-family home; 1.5-story configuration; Fee simple ownership; Estimated 100+ years old; Asphalt roof; Facing and entry details not provided
- Construction: Aluminum siding; Stone foundation; Built before 1978
- Exterior features: Deck; Porch; Level to sloped lot
Interior
- Kitchen: Galley-style kitchen (16 x 9); Range; Microwave; Dishwasher; Refrigerator; Stainless steel appliances
- Bedrooms: 4 bedrooms (master and three bedrooms on the second floor); Bedroom sizes include 12 x 9 (master), 11 x 9, 11 x 8, and 10 x 8
- Flooring: Hardwood in upstairs bedrooms and main areas; Carpet in living room and office; Ceramic tile in kitchen; Luxury vinyl in family room
- Bathrooms: 1 full bathroom; Basement includes a bathroom
- Heating & cooling: Natural gas forced air heating; Central air conditioning
- Interior features: 8 total rooms; Unfinished full basement; Basement has stone foundation; Hardwood flooring throughout main finished areas
- Laundry & utility: Laundry room; Dryer included
Neighborhood map
What this means for you Summary
Snapshot
- This is a 4-bed/1.5-bath single-family listed at $130k.
Deal economics
- At list price, monthly cash flow is $230 ($3k/yr) — positive.
- The deal already cash-flows at list — no discount required.
- Meets the 1% rule at list price ($1k rent vs $130k).
- Cap rate 8.4% vs local median 4.4% in Davenport — top-decile yield for the area; either an underpriced asset or a hidden risk that comps aren't pricing in. Stress-test before assuming the spread holds.
Location & tenants
- Location reads 79/100 on livability (#126 in IA, #2,312 nationally) — a middle-class / working-renter tenant base. Strengths: cost of living A+, housing A+, health & safety A+; Watch: employment C-, crime F.
- Davenport Community School District (urban): math 43% / reading 50% proficiency, ranked #288 of 289 in IA (top 100%) — families likely to look elsewhere, expect single-tenant / working-renter base with shorter leases.
- Market conditions: Rents rising (+4.0%/yr); 161 active listings in the ZIP; 16 comparable units currently listed for rent nearby; rentals at typical pace (median 21d on market — plan ~3-4 weeks tenant-placement turnaround); 44% of comp listings sitting > 30 days — soft ceiling on asking rent; 805 units permitted in Scott County in 2024 (479 in 5+ unit buildings).
Forward outlook
- Local home prices are declining (-3.0%/yr); year-one equity from $899 of loan paydown is wiped out by about $4k of value loss. Plan a longer hold.
- Scott County population projected at +19% by 2050 — long-run rental-demand tailwind backs the buy-and-hold thesis.
Negotiation context
- Only 5 days on market — expect competitive offers; lowballing is unlikely to land.
Risks & watch-outs
- Watch-outs: built in 1880 — expect roof / HVAC / electrical / plumbing capex.
Questions for the listing agent
- Built in 1880 — when were the roof, HVAC, electrical panel, plumbing, and water heater last replaced?
- Is there a deadline driving the sale (1031 exchange, divorce, estate, relocation)? That informs how much negotiation room exists.
- Crime grade is F in this area — have there been break-ins, vandalism, or insurance claims at this property in the last 3 years? What carrier currently insures it and at what premium?
- What's the average days-on-market for RENTAL listings here right now (not sales)? A rising rental-DOM trend means longer vacancies and softer asking-rent achievability than the comps imply.
- What's the recent tenant-quality profile in this submarket — average credit score on applications, eviction rate, late-payment / NSF rate, and stable-employment percentage? A property-management company in the area should have these aggregated.
- How much new for-sale + rental construction is in the pipeline within 1–3 miles? Heavy new supply typically softens prices + rents 12–24 months out; constrained supply supports both.
Investment metrics
- 1% rule
- 1.07% ✓
- Cap rate
- 8.41%
- Cash-on-cash
- 7.57%
- DSCR
- 1.34
- GRM
- 7.8
CMA / ARV
- ARV (on-the-fly)
- $157,696
- Comps found
- 12
Show comp detail 12 sales within ~0.75 mi
| Address | Dist | Beds/Ba | Sqft | Sold | Price | $/sf | Match |
|---|---|---|---|---|---|---|---|
| 1527 N Division St | 0.10mi | 3/1.5 (-1) | 1,558 (+11%) | 1mo | $185,000 | $119 | 72 |
| 1854 W 8th St | 0.50mi | 3/1.0 (-1) | 1,417 (+1%) | 2mo | $49,500 | $35 | 67 |
| 1627 W High St | 0.40mi | 3/1.5 (-1) | 1,466 (+4%) | 4mo | $200,000 | $136 | 66 |
| 1716 W 7th St | 0.53mi | 4/1.0 | 1,483 (+5%) | 3mo | $63,500 | $43 | 62 |
| 1527 N Marquette St | 0.44mi | 4/1.5 | 1,558 (+11%) | 1mo | $80,444 | $52 | 61 |
| 1324 Marquette St | 0.41mi | 3/2.0 (-1) | 1,302 (-8%) | 1mo | $115,000 | $88 | 60 |
| 1341 W 14th St | 0.34mi | 3/1.5 (-1) | 1,244 (-12%) | 1mo | $131,900 | $106 | 59 |
| 2128 N Sturdevant St | 0.47mi | 3/2.0 (-1) | 1,514 (+8%) | 2mo | $167,900 | $111 | 57 |
| 911 W 16th St | 0.69mi | 3/1.0 (-1) | 1,356 (-4%) | 1mo | $152,000 | $112 | 54 |
| 1922 N Pine St | 0.66mi | 3/1.0 (-1) | 1,475 (+5%) | 3mo | $169,900 | $115 | 52 |
| 2102 W 18th St | 0.46mi | 3/1.0 (-1) | 1,236 (-12%) | 1mo | $155,000 | $125 | 50 |
| 2217 W 13th St | 0.54mi | 3/1.0 (-1) | 1,200 (-15%) | 2mo | $157,000 | $131 | 42 |
Match score weights: distance 35% · size 25% · config 20% · recency 20%. Top-matched comps best support the ARV.
Projected returns pro-forma
-3.0% appreciation · 3.99% rent growth · sell at horizon
- IRR
- -3.6%
- Equity multiple
- 0.86×
- Total profit
- $-5,033
- Equity at exit
- $19,383
- IRR
- 7.1%
- Equity multiple
- 1.56×
- Total profit
- $20,339
- Equity at exit
- $11,240
Cash invested: $36,400 (down + closing). Projections, not guarantees.
Landlord ↔ Tenant lean methodology
- Overall (STATE)
- 83 Strongly Landlord-Friendly
- State Iowa
- 83 Strongly Landlord-Friendly · R+6
- County
- — inherits STATE
- City
- — inherits STATE
ZIP-level market 52804
- Home prices YoY
- -25.3%
- Rents YoY
- 4.0%
- Active inventory
- 161
- Price-to-rent
- 7.8×
Monthly cashflow live
- Estimated rent
- $1,394 high interval (Pro) →
- Mortgage (P&I)
- −$682
- Tax from tax record
- −$136 /mo · $1,628/yr
- Insurance
- −$54
- HOA
- −$0
- Vacancy / Maint / Mgmt
- −$293
- Net cashflow
- $230
Break-even live
UW: 25.0% down · 7.5% · 30yr · 1.5% tax · 5.0% vac · 8.0% maint · 8.0% mgmt
Financing live
Cash to close
- Down payment
- $32,500
- Closing costs
- $3,900
- Reserves months
- —
- Total cash needed
- —
Loan-product check · same deal, 3 products live
Conventional
25% down · 7.5% · 30yr
- Down + closing
- —
- Monthly P&I
- —
- Monthly cashflow
- —
- DSCR
- —
- Eligible?
- —
Personal DTI + credit; lowest rate.
DSCR
20% down · 8.5% · 30yr
- Down + closing
- —
- Monthly P&I
- —
- Monthly cashflow
- —
- DSCR
- —
- Eligible?
- —
No personal income docs; deal must DSCR.
Hard money
10% down · 12.0% · 12mo
- Down + closing
- —
- Monthly P&I
- —
- Monthly cashflow
- —
- DSCR
- —
- Eligible?
- —
Short-term bridge; refi at stabilization.
Rent comps 16 comps
| Address | Beds | Baths | Sqft | Rent | $/sqft | DOM | Units | Dist |
|---|---|---|---|---|---|---|---|---|
| 1723 W Locust St Davenport, IA | 3.0 | 1.0 | 1690 | $1,395 | $0.83 | 44d | 1 | 0.24mi |
| 1455 W 12th St Davenport, IA | 3.0 | 1.0 | 942 | $1,095 | $1.16 | 14d | 1 | 0.32mi |
| 1716 W 7th St Davenport, IA | 4.0 | 1.0 | 1278 | $1,712 | $1.34 | 14d | 1 | 0.55mi |
| 915 W 14th St Davenport, IA | 3.0 | 1.0 | 1390 | $900 | $0.65 | 44d | 1 | 0.70mi |
| 1315 Brown St Unit 2 Davenport, IA | 3.0 | 1.0 | 1300 | $1,250 | $0.96 | 21d | 1 | 0.83mi |
| 1341 W 4th St Davenport, IA | 3.0 | 1.5 | 979 | $1,394 | $1.42 | 44d | 1 | 0.87mi |
| 1323 N Gaines St Davenport, IA | 4.0 | 2.0 | 1733 | $1,350 | $0.78 | 21d | 1 | 0.91mi |
| 621 W 15th St Davenport, IA | 4.0 | 2.0 | 1833 | $1,500 | $0.82 | 14d | 1 | 0.92mi |
| 537 W 16th St Davenport, IA | 3.0 | 1.0 | 1311 | $1,400 | $1.07 | 44d | 1 | 0.97mi |
| 1511 N Ripley St Davenport, IA | 4.0 | 2.0 | 1872 | $1,450 | $0.77 | 21d | 1 | 1.13mi |
| 1912 Dixwell St Davenport, IA | 4.0 | 2.0 | 1116 | $1,300 | $1.16 | 44d | 1 | 1.13mi |
| 1421 N Main St #2 Davenport, IA | 3.0 | 1.0 | 1350 | $1,095 | $0.81 | 44d | 1 | 1.28mi |
| 2638 N Clark St Unit 2 Davenport, IA | 3.0 | 1.5 | 1200 | $1,250 | $1.04 | 14d | 1 | 1.35mi |
| 119 E 13th St Davenport, IA | 3.0 | 1.0 | 1728 | $1,495 | $0.87 | 44d | 1 | 1.40mi |
| 301 S Thornwood Ave Davenport, IA | 3.0 | 1.0 | 1242 | $1,395 | $1.12 | 14d | 1 | 1.44mi |
| 1812 Pershing Ave Unit 1 Davenport, IA | 3.0 | 1.0 | 1000 | $1,200 | $1.20 | 21d | 1 | 1.49mi |
Listing history 5 events
-
2026-06-09status $130,000 Pending 5 DOM
-
2026-06-08days on market $130,000 Active 5 DOM
-
2026-06-07days on market $130,000 Active 4 DOM
-
2026-06-03remarks 699-char remark
-
2026-06-03$130,000 Active 1 DOM
ⓘ Source: listings_history table (triggers on properties + properties_extension) + one-shot
backfill from property_details.listing_events for pre-trigger history.
Tax reassessment forecast IA · Partial reset (capped growth)
- Current annual tax
- $1,628 · $136/mo
- Projected year-2 tax
- $1,834 · $153/mo
- Expected delta
- +$206/yr (+$17/mo · 12.7%)
ⓘ Screening estimate from a state-policy table — verify with the county assessor before closing.
Climate risk First Street
- Flood 1/10 Low FEMA zone X (unshaded) · 0% chance over 30 yrs
- Wildfire 1/10 Low
- Heat 3/10 Moderate 7 d/yr ≥103°F today · 16 d/yr by 30 yrs out
- Wind 2/10 Low
- Air quality 3/10 Moderate 2 unhealthy d/yr today · 3 by 30 yrs out
Nearby sold comps map
Loading sold comps map…
Walkable amenities ~0.75 mi
Loading nearby amenities…
Taxation est. · year 1
- Rental income
- $16,727
- − Mortgage interest
- −$7,282
- − Property taxes
- −$1,628
- − Insurance
- −$650
- − Repairs & maintenance
- −$1,338
- − Management
- −$1,338
- − Depreciation
- −$3,782
- Taxable income
- $709
- Est. tax owed @ 24.0%
- −$170
- After-tax cash flow
- $2,585/yr
For passive investors: Depreciation is non-cash, so a rental often shows a tax loss while cash-flowing — sheltering income. Rental losses are passive: they offset passive income freely, and up to $25,000/yr can offset ordinary (W-2) income if you actively participate and your MAGI is under $100k (phasing out to $0 by $150k); unused losses carry forward. On sale, claimed depreciation is recaptured at up to 25%, and gains may owe capital-gains tax (a 1031 exchange can defer both). Figures are a year-1 estimate at your 24.0% rate — not tax advice; consult a CPA.
Schools (NCES district)
- District
- Davenport Community School District
- NCES district ID
- 1908580
- Math proficiency
- 43% ▼ -11.00%
- Reading proficiency
- 50% ▼ -3.00%
- Median HH income
- $46,157
- Composite
- 39.49/100
- National rank
- #3951
- State rank
- #288 of 289 in IA
Livability — Davenport
- Score
- 79/100
- State rank
- #126
- US rank
- #2312
Category grades
Schools grade is shown separately in the Schools card above.
Census & demographics
- Census place
- Davenport, IA
- County
- Scott County · 144,583 people
- City population
- 103,319
- Metro
- Davenport-Moline-Rock Island, IA-IL
- Population (ZIP)
- 26,835
- Household income
- $65,849
- Rent vs Own
- Severe rent burden
- 830.0
Population outlook (Scott County) Hauer SSP2
- Today (2025)
- 188,878 people
- By 2030
- 196,648 · +4.1%
- By 2040
- 210,860 · +11.6%
- By 2050
- 224,359 · +18.8%
- By 2075
- 258,884 · +37.1%
- By 2100
- 286,447 · +51.7%
Race, ethnicity, and origin ACS 2023
- Neighborhood character
- Predominantly White (71%)
- Race & ethnicity
- White 71% Black 10% Hispanic / Latino 10% Two or more races 9% Asian 2%
- Hispanic origin (detail)
- Mexican 8%
- Common ancestry
- Iranian 2% Romanian 2% Portuguese 1%
- Foreign-born
- 4% · Canada, China, Vietnam
- Languages at home
- 94% English-only · Spanish 3% Russian/Polish/Slavic 1% Chinese 1%
Political lean MEDSL · Scott
- 2024 margin
- Toss-up / Even · D 47.3% · R 51.2% · Other 1.4%
- 2008→2024 swing
- -18.4pp toward R · 2008: 14.6pp · 2024: -3.9pp
- All cycles
- 2024: R+3.9 2020: D+3.5 2016: D+1.4 2012: D+13.8 2008: D+14.6
Not yet ingested
- Civics
- —
Market trends
- HPI YoY
- ▼ -66.50%
- Current HPI
- 196.2267
- Rent YoY
- ▲ 3.99%
- Metro
- Davenport-Moline-Rock Island, IA-IL
- State GDP YoY
- ▲ 2.48%
- F500 in state
- 4
Industry mix (Fortune 500 HQ in IA)
| Industry | F500 HQs | Revenue |
|---|---|---|
| Financial Services | 1 | $16B |
|
||
| Retail / Convenience | 1 | $15B |
|
||
Price history
1 event — show timeline
- 2026-06-03 Listed $130,000 MRED as Distributed by MLS Grid
Property tax history
+0.5%/yrLatest (2025): $1,628 · -4.1% YoY. Source: county tax records.
Cash-flow waterfall
monthlySold comps — $/sqft
last 12 mo · ≤1 miLoading sold comps…