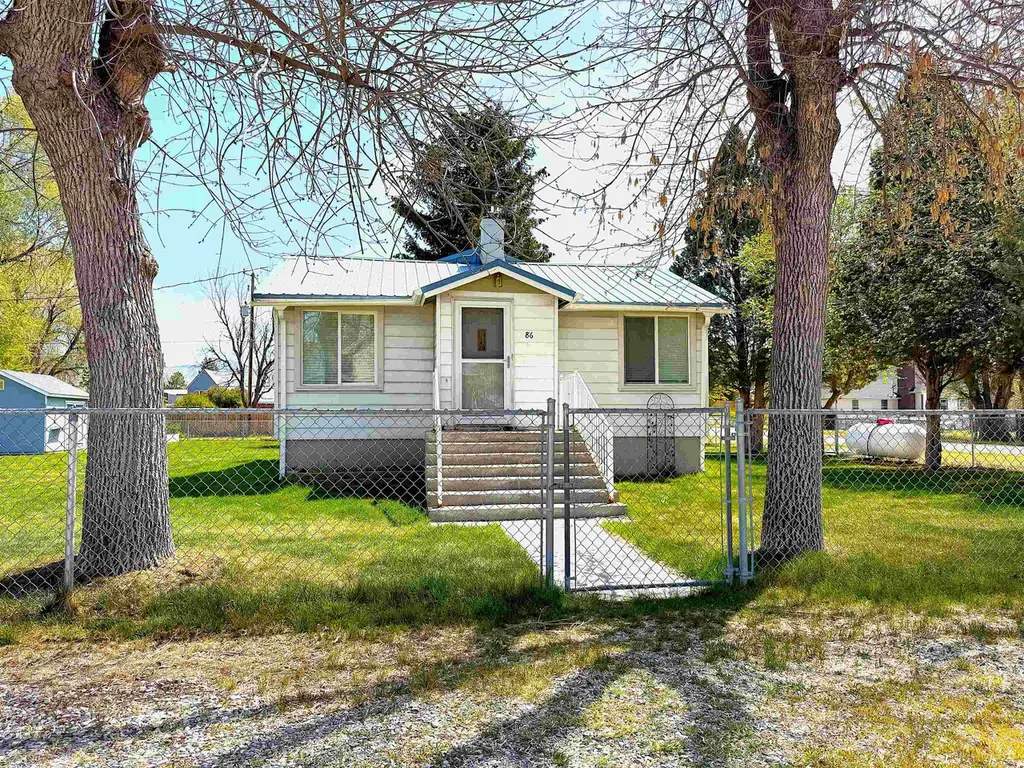
86 S 1st St E · Downey, ID
Flood risk 6/10 · Moderate
- FEMA flood zone
- X (unshaded)
- Chance of flooding over 30 yrs
- 0.67%
- Est. flood insurance / yr
- $473 – $860
Fire risk 5/10 · Moderate
- Est. fire insurance / yr
- $584 – $1,086
Heat risk 3/10 · Minor
- Hot days now (above 92°F)
- 6 days/yr
- Hot days in 30 yrs
- 14 days/yr
Wind risk 1/10 · Minimal
- Chance of severe wind over 30 yrs
- —
Air-quality risk 3/10 · Minor
- Unhealthy air days now
- 3 days/yr
- Unhealthy air days in 30 yrs
- 3 days/yr
Risk factors via First Street. Map © Google.
Why this score? — see what drove the F grade
The composite is a weighted blend of 9 inputs, each scored 0–100. Each bar is that input's sub-score; the figure is the points it added to the 100-point composite (weight × sub-score).
- Appreciation +8.9/10.0
- ARV discount +7.5/15.0
- Schools +4.7/10.0
- Cash flow +4.4/30.0
- Livability +3.2/5.0
- Rent growth +2.5/5.0
- Condition / age +2.5/5.0
- 1% rule +0.0/10.0
- DSCR +0.0/10.0
$249,500
🖨 Deal sheet (PDF) 📄 Offer letter ✓ Due diligence
Key facts
- 0.29 acre lot
- Garage
- Built 1950
Property features AI
Exterior
- Parking: Detached garage (1 car); Concrete and gravel parking surfaces
- Utilities: Public water; Public sewer
- Home design: Single-family detached residence
- Construction: Frame, stucco, and metal siding construction; Metal roof
- Exterior features: Corner lot; Chain link fencing / fenced yard; Shed(s)
Interior
- Kitchen: Dishwasher; Range / Oven; Microwave; Refrigerator; Freezer
- Bedrooms: 2 main-level bedrooms
- Bathrooms: 2 full bathrooms (1 on the main level)
- Interior features: Finished basement; Garden (exterior-accessible feature); Electric water heater
- Laundry & utility: Washer and dryer; Laundry located in the basement
Neighborhood map
What this means for you Summary
Snapshot
- This is a 2-bed/1.0-bath single-family listed at $250k.
Deal economics
- At list price, monthly cash flow is $-650 ($-8k/yr) — negative.
- To cash-flow at today's rent, offer at most $135k (46.0% below list).
- To meet the 1% rule (rent ≥ 1% of price), the offer needs to be $103k (58.8% below list).
- Recommended offer: $103k (58.8% below list) — sets the bar for 1% rule.
Location & tenants
- Location reads 65/100 on livability (#138 in ID) — a middle-class / working-renter tenant base. Strengths: cost of living A+, housing A+; Watch: health & safety C-, amenities F, commute F.
- Marsh Valley Joint District (rural): math 49% / reading 62% proficiency, ranked #16 of 92 in ID (top 17%) — acceptable for families but not a draw, mixed tenant base, ~2y average lease.
- Zoned schools: Downey Elementary School (math 44% / reading 54%, grade D, #148 of 357 statewide, top 47%, 96 students, 38% FRL); Marsh Valley Middle School (math 47% / reading 57%, grade C+, #27 of 109 statewide, top 24%, 188 students, 25% FRL); Marsh Valley High School (math 27% / reading 62%, grade F, #61 of 169 statewide, top 41%, 405 students, 20% FRL) — zoned schools at 27% FRL track the district average.
- Market conditions: 54 active listings in the ZIP; 325 units permitted in Bannock County in 2024 (6 in 5+ unit buildings).
Forward outlook
- In year one you build about $21k of equity ($2k loan paydown + $19k appreciation (7.8% local appreciation)).
- By year 2, paydown + projected appreciation supports a ~$34k cash-out refi (75% LTV) — recoverable capital for the next deal without selling this one.
Negotiation context
- Only 4 days on market — expect competitive offers; lowballing is unlikely to land.
Risks & watch-outs
- Watch-outs: built in 1950 — expect roof / HVAC / electrical / plumbing capex.
- Climate carrying-cost: major flood risk; moderate wildfire risk — expect insurance premiums to compound above CPI over the hold.
Questions for the listing agent
- What do current leases actually rent for vs. the listed asking? Can we see a recent rent roll and the last 12 months of T-12 income?
- Built in 1950 — when were the roof, HVAC, electrical panel, plumbing, and water heater last replaced?
- Is there a deadline driving the sale (1031 exchange, divorce, estate, relocation)? That informs how much negotiation room exists.
- Schools are D-rated, which usually means shorter tenancies and higher turnover. Who's the typical renter profile here, and what's been the actual vacancy rate?
- The area grade is low — what's the realistic commute time and amenity access for the typical tenant pool here? Any planned neighborhood developments (good or bad) we should know about?
- What's the average days-on-market for RENTAL listings here right now (not sales)? A rising rental-DOM trend means longer vacancies and softer asking-rent achievability than the comps imply.
- What's the recent tenant-quality profile in this submarket — average credit score on applications, eviction rate, late-payment / NSF rate, and stable-employment percentage? A property-management company in the area should have these aggregated.
- How much new for-sale + rental construction is in the pipeline within 1–3 miles? Heavy new supply typically softens prices + rents 12–24 months out; constrained supply supports both.
Investment metrics
- 1% rule
- 0.41% ✗
- Cap rate
- 3.17%
- Cash-on-cash
- -11.16%
- DSCR
- 0.50
- GRM
- 20.2
CMA / ARV
No comps found within radius.
Projected returns pro-forma
7.8% appreciation · 3.0% rent growth · sell at horizon
- IRR
- 11.2%
- Equity multiple
- 1.83×
- Total profit
- $58,112
- Equity at exit
- $186,227
- IRR
- 11.9%
- Equity multiple
- 3.85×
- Total profit
- $198,986
- Equity at exit
- $366,531
Cash invested: $69,860 (down + closing). Projections, not guarantees.
Landlord ↔ Tenant lean methodology
- Overall (STATE)
- 91 Strongly Landlord-Friendly
- State Idaho
- 91 Strongly Landlord-Friendly · R+18
- County
- — inherits STATE
- City
- — inherits STATE
ZIP-level market 83234
- Home prices YoY
- 3.0%
- Active inventory
- 54
- Price-to-rent
- 20.2×
Monthly cashflow live
- Estimated rent
- $1,029 medium interval (Pro) →
- Mortgage (P&I)
- −$1,308
- Tax from tax record
- −$50 /mo · $605/yr
- Insurance
- −$104
- HOA
- −$0
- Vacancy / Maint / Mgmt
- −$216
- Net cashflow
- $-650
Break-even live
Sensitivity live
| Price | -10% $-509 | -5% $-579 | +0% $-650 | +5% $-721 | +10% $-791 |
|---|---|---|---|---|---|
| Rent | -10% $-731 | -5% $-691 | +0% $-650 | +5% $-609 | +10% $-569 |
| Rate | -1.0pp $-524 | -0.5pp $-587 | base $-650 | +0.5pp $-715 | +1.0pp $-780 |
UW: 25.0% down · 7.5% · 30yr · 1.5% tax · 5.0% vac · 8.0% maint · 8.0% mgmt
Financing live
Cash to close
- Down payment
- $62,375
- Closing costs
- $7,485
- Reserves months
- —
- Total cash needed
- —
Loan-product check · same deal, 3 products live
Conventional
25% down · 7.5% · 30yr
- Down + closing
- —
- Monthly P&I
- —
- Monthly cashflow
- —
- DSCR
- —
- Eligible?
- —
Personal DTI + credit; lowest rate.
DSCR
20% down · 8.5% · 30yr
- Down + closing
- —
- Monthly P&I
- —
- Monthly cashflow
- —
- DSCR
- —
- Eligible?
- —
No personal income docs; deal must DSCR.
Hard money
10% down · 12.0% · 12mo
- Down + closing
- —
- Monthly P&I
- —
- Monthly cashflow
- —
- DSCR
- —
- Eligible?
- —
Short-term bridge; refi at stabilization.
Listing history 2 events
-
2026-05-09status Pending
-
2026-05-05$249,500 Active
ⓘ Source: listings_history table (triggers on properties + properties_extension) + one-shot
backfill from property_details.listing_events for pre-trigger history.
Tax reassessment forecast ID · Resets to sale price
- Current annual tax
- $605 · $50/mo
- Projected year-2 tax
- $1,722 · $143/mo
- Expected delta
- +$1,117/yr (+$93/mo · 184.8%)
ⓘ Screening estimate from a state-policy table — verify with the county assessor before closing.
Climate risk First Street
- Flood 6/10 Major FEMA zone X (unshaded) · 67% chance over 30 yrs
- Wildfire 5/10 Major
- Heat 3/10 Moderate 6 d/yr ≥92°F today · 14 d/yr by 30 yrs out
- Wind 1/10 Low
- Air quality 3/10 Moderate 3 unhealthy d/yr today · 3 by 30 yrs out
Nearby sold comps map
Loading sold comps map…
Walkable amenities ~0.75 mi
Loading nearby amenities…
Taxation est. · year 1
- Rental income
- $12,346
- − Mortgage interest
- −$13,976
- − Property taxes
- −$605
- − Insurance
- −$1,248
- − Repairs & maintenance
- −$988
- − Management
- −$988
- − Depreciation
- −$7,258
- Taxable loss
- −$12,716
- Est. tax savings @ 24.0%
- +$3,052
- After-tax cash flow
- $-4,748/yr
For passive investors: Depreciation is non-cash, so a rental often shows a tax loss while cash-flowing — sheltering income. Rental losses are passive: they offset passive income freely, and up to $25,000/yr can offset ordinary (W-2) income if you actively participate and your MAGI is under $100k (phasing out to $0 by $150k); unused losses carry forward. On sale, claimed depreciation is recaptured at up to 25%, and gains may owe capital-gains tax (a 1031 exchange can defer both). Figures are a year-1 estimate at your 24.0% rate — not tax advice; consult a CPA.
Schools (NCES district)
- District
- Marsh Valley Joint District
- NCES district ID
- 1601950
- Math proficiency
- 49% ▼ -5.00%
- Reading proficiency
- 62% ▲ 1.00%
- Median HH income
- $51,741
- Composite
- 47.46/100
- National rank
- #2280
- State rank
- #16 of 92 in ID
Livability — Downey
- Score
- 65/100
- State rank
- #138
- US rank
- #13581
Category grades
Schools grade is shown separately in the Schools card above.
Census & demographics
- Census place
- Downey, ID
- Population (ZIP)
- 1,646
Population outlook (Bannock County) Hauer SSP2
- Today (2025)
- 86,173 people
- By 2030
- 86,575 · +0.5%
- By 2040
- 86,235 · +0.1%
- By 2050
- 86,090 · -0.1%
- By 2075
- 85,032 · -1.3%
- By 2100
- 85,103 · -1.2%
Race, ethnicity, and origin ACS 2023
- Neighborhood character
- Predominantly White (88%)
- Race & ethnicity
- White 88% Two or more races 7% Native American 3% Hispanic / Latino 3%
- Common ancestry
- Italian 15% Slovak 9% Scottish 1%
- Foreign-born
- 2% · Canada
- Languages at home
- 99% English-only · Spanish 1%
Political lean MEDSL · Bannock
- 2024 margin
- Strong R (+25.1) · D 35.8% · R 60.9% · Other 3.3%
- 2008→2024 swing
- -12.1pp toward R · 2008: -13.0pp · 2024: -25.1pp
- All cycles
- 2024: R+25.1 2020: R+21.9 2016: R+20.5 2012: R+22.1 2008: R+13.0
Not yet ingested
- Civics
- —
Market trends
- HPI YoY
- ▲ 7.80%
- Current HPI
- 267.2069
- Rent YoY
- —
- Metro
- —
- State GDP YoY
- ▲ 4.51%
- F500 in state
- 6
Industry mix (Fortune 500 HQ in ID)
| Industry | F500 HQs | Revenue |
|---|---|---|
| Retail | 1 | $79B |
|
||
| Technology | 1 | $25B |
|
||
| Food / Agriculture | 1 | $6B |
|
||
Price history
2 events — show timeline
- 2026-05-09 Pending — PCTMLS
- 2026-05-05 Listed $249,500 PCTMLS
Property tax history
+0.1%/yrLatest (2025): $605 · -20.0% YoY. Source: county tax records.
Cash-flow waterfall
monthlySold comps — $/sqft
last 12 mo · ≤1 miLoading sold comps…