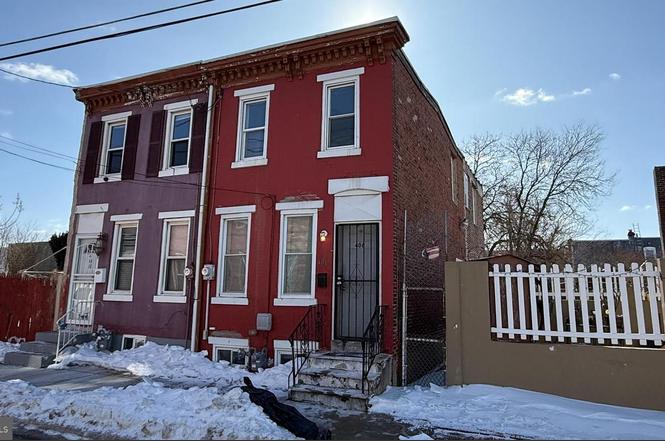
406 Cherry St · Camden, NJ
Flood risk 4/10 · Minor
- FEMA flood zone
- X (unshaded)
- Chance of flooding over 30 yrs
- 0.21%
- Est. flood insurance / yr
- $507 – $1,088
Fire risk 1/10 · Minimal
- Est. fire insurance / yr
- $526 – $976
Heat risk 7/10 · Major
- Hot days now (above 103°F)
- 7 days/yr
- Hot days in 30 yrs
- 15 days/yr
Wind risk 6/10 · Moderate
- Chance of severe wind over 30 yrs
- 27.0%
Air-quality risk 4/10 · Minor
- Unhealthy air days now
- 5 days/yr
- Unhealthy air days in 30 yrs
- 6 days/yr
Risk factors via First Street. Map © Google.
Why this score? — see what drove the C grade
The composite is a weighted blend of 9 inputs, each scored 0–100. Each bar is that input's sub-score; the figure is the points it added to the 100-point composite (weight × sub-score).
- Cash flow +22.7/30.0
- ARV discount +7.5/15.0
- DSCR +7.3/10.0
- 1% rule +5.0/10.0
- Appreciation +3.8/10.0
- Livability +3.5/5.0
- Rent growth +2.5/5.0
- Condition / age +2.5/5.0
- Schools +0.7/10.0
$179,000
🖨 Deal sheet 📄 Offer letter ✓ Due diligence
Listing remarks MLS
Investor and Handyman needed to bring this property back to life. End of the row unit in need of total rehab. Build your equity now! Sold in strictly as is condition.
Key facts
- Ample cabinet space
- Functional layout
- Spacious living
Tags
Property features AI
Exterior
- Parking: On-street parking
- Utilities: Public water; Public sewer; Electric service 120/240V; Natural gas available (heating and hot water); Cable TV available; Internet service (other)
- Home design: Semi-detached home; Building winterized; Fee simple ownership; Major renovation completed in 2014; Property listed in excellent condition
- Construction: Brick construction; Shingle roof; Foundation: block and other
- Exterior features: Not in a federal flood zone; Municipal trash service
Interior
- Kitchen: ENERGY STAR refrigerator; Gas oven/range; Microwave
- Bedrooms: Three bedrooms on the upper level
- Flooring: Ceramic tile; Laminate; Carpet
- Bathrooms: Two full bathrooms (one on main level, one on upper level)
- Heating & cooling: Forced air heating (natural gas)
- Interior features: Ceiling fans; Combination kitchen and dining area; Eat-in kitchen with table space; Partial finished basement
- Laundry & utility: Gas dryer; Laundry area in the basement
Neighborhood map
What this means for you Summary
Snapshot
- This is a 3-bed/2.0-bath single-family listed at $179k.
Deal economics
- At list price, monthly cash flow is $309 ($4k/yr) — positive.
- The deal already cash-flows at list — no discount required.
- To meet the 1% rule (rent ≥ 1% of price), the offer needs to be $179k (0.1% below list).
- Recommended offer: $174k (3.0% below list) — sets the bar for market timing.
Location & tenants
- Location reads 70/100 on livability (#262 in NJ) — a middle-class / working-renter tenant base. Strengths: amenities A+, commute A+, cost of living A; Watch: schools F, crime F, employment F.
- Camden City School District (urban): math 3% / reading 16% proficiency, ranked #472 of 472 in NJ (top 100%) — low school quality limits family demand, transient renter base, plan for 1-2y turnover; 86% free/reduced lunch — lower-income household profile, screen leases tightly.
- Market conditions: 64 active listings in the ZIP; 17 comparable units currently listed for rent nearby; rentals at typical pace (median 19d on market — plan ~3-4 weeks tenant-placement turnaround); lower-income renter base — watch delinquency; 1,018 units permitted in Camden County in 2024 (509 in 5+ unit buildings).
- At $1,789/mo this rent would consume 58% of the median local household income ($37k/yr) (locally 1141% of renters already pay >50% of income on rent) — very limited rent-growth headroom before tenants either downsize or default.
Forward outlook
- Local home prices are declining (-2.4%/yr); year-one equity from $1k of loan paydown is wiped out by about $4k of value loss. Plan a longer hold.
- Camden County population projected to shrink 8% by 2050 — rents likely to lag national; underwrite the cash flow, not the appreciation.
Negotiation context
- It's been on market 60 days — a 3% lower offer ($174k) is reasonable based on typical stale-listing flexibility.
- 9 sale attempts since 21y ago with the ask held roughly flat each time — persistent listings suggest the price (not the market) is what's stuck; bring a comps-based counter.
- Current owner paid $11k; list at $179k implies a 1527% gain — meaningful room to come down on a strong offer.
Risks & watch-outs
- Watch-outs: built in 1910 — expect roof / HVAC / electrical / plumbing capex.
- Climate carrying-cost: major wind risk, 27% chance of damaging wind over 30y; extreme-heat days projected 7→15/yr by 2055 (HVAC capex compounding) — expect insurance premiums to compound above CPI over the hold.
Questions for the listing agent
- It's been on market 60 days. Have you received any prior offers? Is the seller open to a 3% concession, seller financing, or rate buy-down credit?
- Built in 1910 — when were the roof, HVAC, electrical panel, plumbing, and water heater last replaced?
- Is there a deadline driving the sale (1031 exchange, divorce, estate, relocation)? That informs how much negotiation room exists.
- Schools are F-rated, which usually means shorter tenancies and higher turnover. Who's the typical renter profile here, and what's been the actual vacancy rate?
- Crime grade is F in this area — have there been break-ins, vandalism, or insurance claims at this property in the last 3 years? What carrier currently insures it and at what premium?
- What's the average days-on-market for RENTAL listings here right now (not sales)? A rising rental-DOM trend means longer vacancies and softer asking-rent achievability than the comps imply.
- What's the recent tenant-quality profile in this submarket — average credit score on applications, eviction rate, late-payment / NSF rate, and stable-employment percentage? A property-management company in the area should have these aggregated.
- How much new for-sale + rental construction is in the pipeline within 1–3 miles? Heavy new supply typically softens prices + rents 12–24 months out; constrained supply supports both.
Investment metrics
- 1% rule
- 1.00% ✗
- Cap rate
- 8.36%
- Cash-on-cash
- 7.39%
- DSCR
- 1.33
- GRM
- 8.3
CMA / ARV
- ARV (on-the-fly)
- $92,904
- Comps found
- 7
Show comp detail 7 sales within ~0.75 mi
| Address | Dist | Beds/Ba | Sqft | Sold | Price | $/sf | Match |
|---|---|---|---|---|---|---|---|
| 621 Henry St | 0.22mi | 3/1.5 | 1,176 (0%) | 4mo | $120,000 | $102 | 84 |
| 920 Newton Ave | 0.22mi | 3/1.0 | 1,176 (0%) | 4mo | $75,000 | $64 | 83 |
| 312 Line St | 0.21mi | 4/1.5 (+1) | 1,280 (+9%) | 8mo | $54,000 | $42 | 62 |
| 709 Berkley St | 0.49mi | 3/1.0 | 1,088 (-8%) | 0mo | $135,000 | $124 | 60 |
| 1443 S 4th St | 0.42mi | 3/1.0 | 1,210 (+3%) | 16mo | $68,000 | $56 | 58 |
| 441 S 5th St | 0.40mi | 3/1.0 | 1,072 (-9%) | 15mo | $85,000 | $79 | 50 |
| 527 West St | 0.30mi | 3/1.0 | 1,344 (+14%) | 18mo | $219,000 | $163 | 43 |
Match score weights: distance 35% · size 25% · config 20% · recency 20%. Top-matched comps best support the ARV.
Projected returns pro-forma
-2.36% appreciation · 3.0% rent growth · sell at horizon
- IRR
- -2.3%
- Equity multiple
- 0.91×
- Total profit
- $-4,543
- Equity at exit
- $31,854
- IRR
- 6.3%
- Equity multiple
- 1.51×
- Total profit
- $25,391
- Equity at exit
- $24,495
Cash invested: $50,120 (down + closing). Projections, not guarantees.
Landlord ↔ Tenant lean methodology
- Overall (STATE)
- 21 Tenant-Leaning
- State New Jersey
- 21 Tenant-Leaning · D+6
- County
- — inherits STATE
- City
- — inherits STATE
ZIP-level market 08103
- Home prices YoY
- -1.4%
- Active inventory
- 64
- Price-to-rent
- 8.3×
Monthly cashflow live
- Estimated rent
- $1,789 high interval (Pro) →
- Mortgage (P&I)
- −$939
- Tax from tax record
- −$91 /mo · $1,095/yr
- Insurance
- −$75
- HOA
- −$0
- Vacancy / Maint / Mgmt
- −$376
- Net cashflow
- $309
Break-even live
UW: 25.0% down · 7.5% · 30yr · 1.5% tax · 5.0% vac · 8.0% maint · 8.0% mgmt
Financing live
Cash to close
- Down payment
- $44,750
- Closing costs
- $5,370
- Reserves months
- —
- Total cash needed
- —
Loan-product check · same deal, 3 products live
Conventional
25% down · 7.5% · 30yr
- Down + closing
- —
- Monthly P&I
- —
- Monthly cashflow
- —
- DSCR
- —
- Eligible?
- —
Personal DTI + credit; lowest rate.
DSCR
20% down · 8.5% · 30yr
- Down + closing
- —
- Monthly P&I
- —
- Monthly cashflow
- —
- DSCR
- —
- Eligible?
- —
No personal income docs; deal must DSCR.
Hard money
10% down · 12.0% · 12mo
- Down + closing
- —
- Monthly P&I
- —
- Monthly cashflow
- —
- DSCR
- —
- Eligible?
- —
Short-term bridge; refi at stabilization.
Rent comps 17 comps
| Address | Beds | Baths | Sqft | Rent | $/sqft | DOM | Units | Dist |
|---|---|---|---|---|---|---|---|---|
| 609 Henry St Camden, NJ | 3.0 | 1.0 | 1290 | $1,600 | $1.24 | 24d | 1 | 0.25mi |
| 457 Mechanic St Camden, NJ | 3.0 | 2.0 | 1200 | $1,950 | $1.62 | 18d | 1 | 0.32mi |
| 440 Henry St Camden, NJ | 3.0 | 1.5 | 1224 | $2,200 | $1.80 | 24d | 1 | 0.41mi |
| 708 Royden St Camden, NJ | 3.0 | 1.0 | 1113 | $1,595 | $1.43 | 17d | 1 | 0.43mi |
| 537 Newton Ave Camden, NJ | 2.0 | 1.0 | 1092 | $1,500 | $1.37 | 18d | 1 | 0.48mi |
| 537 Newton Ave Camden, NJ | 2.0 | 1.0 | 1092 | $1,500 | $1.37 | 12d | 1 | 0.48mi |
| 727 Berkley St Camden, NJ | 2.0 | 1.5 | 1008 | $1,660 | $1.65 | 24d | 1 | 0.51mi |
| 1502 S 9th St Camden, NJ | 2.0 | 1.0 | 1050 | $1,475 | $1.40 | 19d | 1 | 0.76mi |
| 1759 S 4th St Unit B Camden, NJ | 2.0 | 1.0 | 800 | $1,500 | $1.88 | 24d | 1 | 0.81mi |
| 1055 Kenwood Ave Camden, NJ | 4.0 | 1.0 | 1088 | $1,875 | $1.72 | 24d | 1 | 0.90mi |
| 1 Market St Camden, NJ | 3.0 | 1.0–2.0 | 1190 | $2,456 | $2.06 | 1d | 15 | 0.97mi |
| 527 Penn St Unit 1A Camden, NJ | 2.0 | 1.0 | 800 | $1,500 | $1.88 | 18d | 1 | 0.97mi |
| 1455 Wildwood Ave Camden, NJ | 3.0 | 1.5 | 1353 | $1,900 | $1.40 | 10d | 1 | 1.07mi |
| 1509 Park Blvd Camden, NJ | 1.0–2.0 | 1.0 | 1075 | $1,650 | $1.53 | 24d | 1 | 1.07mi |
| 331 Point St Camden, NJ | 3.0 | 1.0 | 1000 | $1,900 | $1.90 | 18d | 1 | 1.12mi |
| 1364 Kaighn Ave Camden, NJ | 2.0 | 1.0 | 912 | $1,485 | $1.63 | 2d | 1 | 1.15mi |
| 1 Dock St Philadelphia, PA | 3.0 | 1.0–3.5 | 1164 | $10,341 | $8.88 | 1d | 18 | 1.39mi |
Listing history 39 events
-
2026-06-18days on market $179,000 Active 60 DOM
-
2026-06-17days on market $179,000 Active 59 DOM
-
2026-06-16days on market $179,000 Active 58 DOM
-
2026-06-15days on market $179,000 Active 57 DOM
-
2026-06-13days on market $179,000 Active 55 DOM
-
2026-06-13days on market $179,000 Active 54 DOM
-
2026-06-09days on market $179,000 Active 51 DOM
-
2026-06-08days on market $179,000 Active 50 DOM
-
2026-06-07days on market $179,000 Active 49 DOM
-
2026-06-04days on market $179,000 Active 46 DOM
-
2026-06-03days on market $179,000 Active 45 DOM
-
2026-06-02pricedays on market $179,000 Active 44 DOM
-
2026-06-01days on market $187,000 Active 43 DOM
-
2026-05-31days on market $187,000 Active 42 DOM
-
2026-05-21$187,000 Active
-
2026-05-11soldstatus Closed
-
2026-05-01status Pending
-
2026-04-14historical Active Under Contract
-
2026-03-13$187,000 Active
-
2013-12-16soldstatus $11,000 Sold 166-char remark
Show marketing remark (166 chars)
Investor and Handyman needed to bring this property back to life. End of the row unit in need of total rehab. Build your equity now! Sold in strictly as is condition.
-
2013-12-16soldstatus $11,000 166-char remark
Show marketing remark (166 chars)
Investor and Handyman needed to bring this property back to life. End of the row unit in need of total rehab. Build your equity now! Sold in strictly as is condition.
-
2013-11-27status Under Contract 166-char remark
Show marketing remark (166 chars)
Investor and Handyman needed to bring this property back to life. End of the row unit in need of total rehab. Build your equity now! Sold in strictly as is condition.
-
2013-11-10historical 166-char remark
Show marketing remark (166 chars)
Investor and Handyman needed to bring this property back to life. End of the row unit in need of total rehab. Build your equity now! Sold in strictly as is condition.
-
2013-10-31historical 166-char remark
Show marketing remark (166 chars)
Investor and Handyman needed to bring this property back to life. End of the row unit in need of total rehab. Build your equity now! Sold in strictly as is condition.
-
2013-10-25price $11,500 166-char remark
Show marketing remark (166 chars)
Investor and Handyman needed to bring this property back to life. End of the row unit in need of total rehab. Build your equity now! Sold in strictly as is condition.
-
2013-09-25price $13,500 166-char remark
Show marketing remark (166 chars)
Investor and Handyman needed to bring this property back to life. End of the row unit in need of total rehab. Build your equity now! Sold in strictly as is condition.
-
2013-08-09$15,000 Active 166-char remark
Show marketing remark (166 chars)
Investor and Handyman needed to bring this property back to life. End of the row unit in need of total rehab. Build your equity now! Sold in strictly as is condition.
-
2013-08-09status Active 166-char remark
Show marketing remark (166 chars)
Investor and Handyman needed to bring this property back to life. End of the row unit in need of total rehab. Build your equity now! Sold in strictly as is condition.
-
2013-08-09$11,500 166-char remark
Show marketing remark (166 chars)
Investor and Handyman needed to bring this property back to life. End of the row unit in need of total rehab. Build your equity now! Sold in strictly as is condition.
-
2012-06-30historical
-
2012-03-01$11,000
-
2012-01-23historical
-
2011-05-25$23,900
-
2007-09-20soldstatus $69,950
-
2007-09-07soldstatus $69,950
-
2007-07-11historical
-
2007-06-09$69,950
-
2005-06-30soldstatus $46,500
-
2005-05-24$46,500
ⓘ Source: listings_history table (triggers on properties + properties_extension) + one-shot
backfill from property_details.listing_events for pre-trigger history.
Tax reassessment forecast NJ · Partial reset (capped growth)
- Current annual tax
- $1,095 · $91/mo
- Projected year-2 tax
- $2,776 · $231/mo
- Expected delta
- +$1,681/yr (+$140/mo · 153.5%)
ⓘ Screening estimate from a state-policy table — verify with the county assessor before closing.
Climate risk First Street
- Flood 4/10 Moderate FEMA zone X (unshaded) · 21% chance over 30 yrs
- Wildfire 1/10 Low
- Heat 7/10 Severe 7 d/yr ≥103°F today · 15 d/yr by 30 yrs out
- Wind 6/10 Major 27% chance of damaging wind over 30 yrs
- Air quality 4/10 Moderate 5 unhealthy d/yr today · 6 by 30 yrs out
Nearby sold comps map
Loading sold comps map…
Walkable amenities ~0.75 mi
Loading nearby amenities…
Taxation est. · year 1
- Rental income
- $21,467
- − Mortgage interest
- −$10,027
- − Property taxes
- −$1,095
- − Insurance
- −$895
- − Repairs & maintenance
- −$1,717
- − Management
- −$1,717
- − Depreciation
- −$5,207
- Taxable income
- $808
- Est. tax owed @ 24.0%
- −$194
- After-tax cash flow
- $3,511/yr
For passive investors: Depreciation is non-cash, so a rental often shows a tax loss while cash-flowing — sheltering income. Rental losses are passive: they offset passive income freely, and up to $25,000/yr can offset ordinary (W-2) income if you actively participate and your MAGI is under $100k (phasing out to $0 by $150k); unused losses carry forward. On sale, claimed depreciation is recaptured at up to 25%, and gains may owe capital-gains tax (a 1031 exchange can defer both). Figures are a year-1 estimate at your 24.0% rate — not tax advice; consult a CPA.
Schools (NCES district)
- District
- Camden City School District
- NCES district ID
- 3402640
- Math proficiency
- 3% ▼ -6.00%
- Reading proficiency
- 16% ▬ 0.00%
- Median HH income
- $25,845
- Composite
- 6.85/100
- National rank
- #9981
- State rank
- #472 of 472 in NJ
Livability — Camden
- Score
- 70/100
- State rank
- #262
- US rank
- #7721
Category grades
Schools grade is shown separately in the Schools card above.
Census & demographics
- Census place
- Camden, NJ
- County
- Camden County · 407,624 people
- City population
- 20,865
- Metro
- Philadelphia-Camden-Wilmington, PA-NJ-DE-MD
- Population (ZIP)
- 12,573
- Household income
- $36,793
- Rent vs Own
- Severe rent burden
- 1141.0
Population outlook (Camden County) Hauer SSP2
- Today (2025)
- 507,964 people
- By 2030
- 502,182 · -1.1%
- By 2040
- 485,602 · -4.4%
- By 2050
- 465,630 · -8.3%
- By 2075
- 419,986 · -17.3%
- By 2100
- 369,492 · -27.3%
Race, ethnicity, and origin ACS 2023
- Neighborhood character
- Diverse neighborhood (Simpson 0.57)
- Race & ethnicity
- Black 54% Hispanic / Latino 36% Two or more races 9% White 5% Asian 1%
- Hispanic origin (detail)
- Mexican 4% Puerto Rican 19% Dominican 4%
- Common ancestry
- Hispanic 1%
- Foreign-born
- 12% · Canada, Jamaica
- Languages at home
- 75% English-only · Spanish 22% Tagalog/Filipino 2%
Political lean MEDSL · Camden
- 2024 margin
- Strong D (+27.4) · D 63.0% · R 35.5% · Other 1.5%
- 2008→2024 swing
- -8.8pp toward R · 2008: 36.2pp · 2024: 27.4pp
- All cycles
- 2024: D+27.4 2020: D+33.5 2016: D+32.4 2012: D+36.6 2008: D+36.2
Not yet ingested
- Civics
- —
Market trends
- HPI YoY
- ▼ -2.36%
- Current HPI
- 162.557
- Rent YoY
- —
- Metro
- Philadelphia-Camden-Wilmington, PA-NJ-DE-MD
- State GDP YoY
- ▲ 2.05%
- F500 in state
- 34
Industry mix (Fortune 500 HQ in NJ)
| Industry | F500 HQs | Revenue |
|---|---|---|
| Consumer Goods | 3 | $31B |
|
||
| Pharmaceuticals | 2 | $153B |
|
||
| Technology | 2 | $21B |
|
||
| Insurance | 2 | $20B |
|
||
| Healthcare | 2 | $19B |
|
||
| Financial Services | 1 | $70B |
|
||
Price history
+302.2% since first listed25 events — show timeline
- 2026-05-21 Listed $187,000 BRIGHT MLS
- 2026-05-11 Sold (MLS) — BRIGHT MLS
- 2026-05-01 Pending — BRIGHT MLS
- 2026-04-14 Contingent — BRIGHT MLS
- 2026-03-13 Listed $187,000 BRIGHT MLS
- 2013-12-16 Sold (MLS) $11,000 BRIGHT MLS
- 2013-12-16 Sold (MLS) $11,000 TREND
- 2013-11-27 Pending — TREND
- 2013-11-10 Delisted — TREND
- 2013-10-31 Listing Removed — BRIGHT MLS
- 2013-10-25 Price Changed $11,500 TREND
- 2013-09-25 Price Changed $13,500 TREND
- 2013-08-09 Listed $15,000 TREND
- 2013-08-09 Listed $11,500 BRIGHT MLS
- 2013-08-09 Relisted — TREND
- 2012-06-30 Listing Removed — BRIGHT MLS
- 2012-03-01 Listed $11,000 BRIGHT MLS
- 2012-01-23 Listing Removed — BRIGHT MLS
- 2011-05-25 Listed $23,900 BRIGHT MLS
- 2007-09-20 Sold (Public Records) $69,950 Public Records
- 2007-09-07 Sold (MLS) $69,950 BRIGHT MLS
- 2007-07-11 Listing Removed — BRIGHT MLS
- 2007-06-09 Listed $69,950 BRIGHT MLS
- 2005-06-30 Sold (MLS) $46,500 BRIGHT MLS
- 2005-05-24 Listed $46,500 BRIGHT MLS
Property tax history
-1.2%/yrLatest (2025): $1,095 · +4.1% YoY. Source: county tax records.
Cash-flow waterfall
monthlySold comps — $/sqft
last 12 mo · ≤1 miLoading sold comps…