 🏗️ New Construction
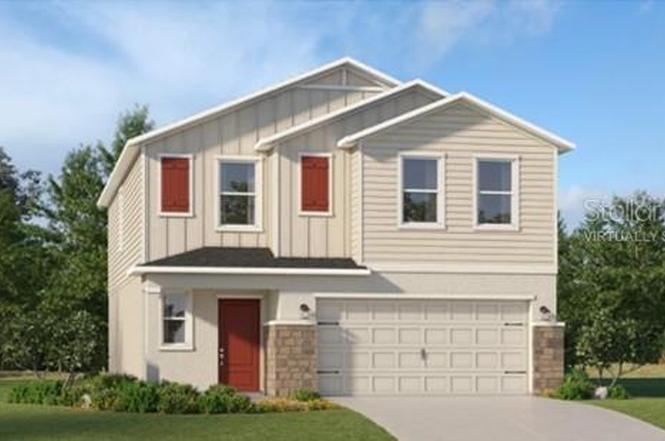
3926 Amers Loop · Haines City, FL
Flood risk No data
- FEMA flood zone
- —
- Chance of flooding over 30 yrs
- —
- Est. flood insurance / yr
- —
Fire risk No data
- Est. fire insurance / yr
- —
Heat risk No data
- Hot days now (above threshold)
- —
- Hot days in 30 yrs
- —
Wind risk No data
- Chance of severe wind over 30 yrs
- —
Air-quality risk No data
- Unhealthy air days now
- —
- Unhealthy air days in 30 yrs
- —
Risk factors via First Street. Map © Google.
Why this score? — see what drove the D- grade
The composite is a weighted blend of 9 inputs, each scored 0–100. Each bar is that input's sub-score; the figure is the points it added to the 100-point composite (weight × sub-score).
- Cash flow +9.6/30.0
- ARV discount +7.5/15.0
- Livability +3.7/5.0
- Schools +3.5/10.0
- 1% rule +3.0/10.0
- Rent growth +2.8/5.0
- DSCR +2.7/10.0
- Condition / age +2.5/5.0
- Appreciation +0.0/10.0
$314,990
🖨 Deal sheet 📄 Offer letter ✓ Due diligence
Listing remarks
Under Construction. The first floor of the stunning Edison two-story home is host to an open-concept layout that combines the kitchen with the living and dining areas, and an outdoor patio is easily reached off the main living space. Upstairs, five bedrooms surround a versatile loft, including the luxe owner’s suite, complete with a generous walk-in closet and en-suite bathroom. Crosswinds is an amenity-rich masterplan community of new single-family homes, located in Haines City. Amenities include: a resort style pool, clubhouse, dog park, walking trails, basketball court and soccer field. Close to major roads, parks, Advent Health Heart of Florida, restaurants, shopping.
Key facts
- Walk-in closet
- En-suite bathroom
- Outdoor patio
Tags
Property features AI
Finance
- Other: Community features: dog park, street lights; Pets allowed; Lease restrictions apply
- Financial info: Other annual assessment noted
- HOA & community: HOA required (association: PRIME MGMT / LAUREN OAKLEY); Monthly HOA approximately $17; Quarterly association fee $51; Association amenities include pool, playground, basketball court, and trails; Association approval required
Exterior
- Parking: Attached 2-car garage (19 x 20) with garage door opener; Driveway
- Security: Smoke detector(s)
- Utilities: Public water; Public sewer; Cable available and connected; Electricity available and connected; Fiber optics; Underground utilities
- Home design: Single family residence; Two levels; Under construction (projected completion April 7, 2026); West-facing entry
- Construction: Block and stucco construction; Shingle roof; Slab foundation; New construction; Built by Lennar Homes (Model: Edison)
- Exterior features: Patio; Porch; Sliding doors; Paved, private lot; Asphalt road access
Interior
- Kitchen: Dishwasher; Disposal; Microwave; Range; Refrigerator; Solid surface counters; Solid wood cabinets
- Bedrooms: 5 bedrooms
- Flooring: Carpet; Ceramic tile
- Bathrooms: 2 full bathrooms; 1 half bathroom
- Heating & cooling: Central heating (electric); Central air conditioning
- Interior features: In-wall pest system; Kitchen/family room combo; Open floorplan; Solid surface counters; Solid wood cabinets; Thermostat; Walk-in closets; Thermal windows
- Laundry & utility: Inside laundry; Washer; Dryer; Inside utility room; Irrigation equipment
Neighborhood map
What this means for you Summary
Snapshot
- This is a 5-bed/2.5-bath land listed at $315k.
Deal economics
- At list price, monthly cash flow is $-215 ($-3k/yr) — negative.
- To cash-flow at today's rent, offer at most $284k (9.9% below list).
- To meet the 1% rule (rent ≥ 1% of price), the offer needs to be $250k (20.5% below list).
- Recommended offer: $250k (20.5% below list) — sets the bar for 1% rule.
Location & tenants
- Location reads 74/100 on livability (#285 in FL, #4,575 nationally) — a middle-class / working-renter tenant base. Strengths: crime A+, cost of living A+, housing A+; Watch: amenities F, commute F, employment F.
- Polk (suburban): math 39% / reading 43% proficiency, ranked #62 of 73 in FL (top 85%) — families likely to look elsewhere, expect single-tenant / working-renter base with shorter leases.
- Zoned schools: Eastside Elementary School (math 33% / reading 29%, grade F, #1,854 of 2,144 statewide, top 87%, 615 students, 66% FRL); Ridge Community High School (math 12% / reading 33%, grade F, #539 of 667 statewide, top 81%, 2,711 students, 48% FRL) — zoned schools at 57% FRL track the district average.
- Zoned-school proficiency averages 27% at this address vs 41% district-wide (-14 pts) — the specific schools serving this property underperform the Polk average; the district grade overstates school quality for this exact location.
- Market conditions: Rents rising (+1.2%/yr); 1333 active listings in the ZIP; 31 comparable units currently listed for rent nearby; rentals at typical pace (median 24d on market — plan ~3-4 weeks tenant-placement turnaround); 10,384 units permitted in Polk County in 2024 (1,716 in 5+ unit buildings).
- At $2,505/mo this rent would consume 47% of the median local household income ($64k/yr) (locally 1107% of renters already pay >50% of income on rent) — very limited rent-growth headroom before tenants either downsize or default.
Forward outlook
- Local home prices are declining (-3.0%/yr); year-one equity from $2k of loan paydown is wiped out by about $9k of value loss. Plan a longer hold.
- Polk County population projected at +33% by 2050 — long-run rental-demand tailwind backs the buy-and-hold thesis.
Negotiation context
- It's been on market 42 days — a 3% lower offer ($306k) is reasonable based on typical stale-listing flexibility.
- 2 sale attempts with the ask held roughly flat each time — persistent listings suggest the price (not the market) is what's stuck; bring a comps-based counter.
Questions for the listing agent
- What do current leases actually rent for vs. the listed asking? Can we see a recent rent roll and the last 12 months of T-12 income?
- It's been on market 42 days. Have you received any prior offers? Is the seller open to a 20% concession, seller financing, or rate buy-down credit?
- What does the HOA fee cover, when was the last increase, and are there any pending special assessments or reserve-fund shortfalls?
- Is there a deadline driving the sale (1031 exchange, divorce, estate, relocation)? That informs how much negotiation room exists.
- Schools are D-rated, which usually means shorter tenancies and higher turnover. Who's the typical renter profile here, and what's been the actual vacancy rate?
- The area grade is low — what's the realistic commute time and amenity access for the typical tenant pool here? Any planned neighborhood developments (good or bad) we should know about?
- What's the average days-on-market for RENTAL listings here right now (not sales)? A rising rental-DOM trend means longer vacancies and softer asking-rent achievability than the comps imply.
- What's the recent tenant-quality profile in this submarket — average credit score on applications, eviction rate, late-payment / NSF rate, and stable-employment percentage? A property-management company in the area should have these aggregated.
- How much new for-sale + rental construction is in the pipeline within 1–3 miles? Heavy new supply typically softens prices + rents 12–24 months out; constrained supply supports both.
Investment metrics
- 1% rule
- 0.80% ✗
- Cap rate
- 5.47%
- Cash-on-cash
- -2.93%
- DSCR
- 0.87
- GRM
- 10.5
CMA / ARV
No comps found within radius.
Projected returns pro-forma
-3.0% appreciation · 1.16% rent growth · sell at horizon
- IRR
- -23.3%
- Equity multiple
- 0.21×
- Total profit
- $-69,253
- Equity at exit
- $46,966
- IRR
- -23.7%
- Equity multiple
- -0.09×
- Total profit
- $-95,764
- Equity at exit
- $27,235
Cash invested: $88,197 (down + closing). Projections, not guarantees.
Landlord ↔ Tenant lean methodology
- Overall (STATE)
- 87 Strongly Landlord-Friendly
- State Florida
- 87 Strongly Landlord-Friendly · R+3
- County
- — inherits STATE
- City
- — inherits STATE
ZIP-level market 33844
- Home prices YoY
- -26.7%
- Rents YoY
- 1.2%
- Active inventory
- 1333
- Price-to-rent
- 10.5×
Monthly cashflow live
- Estimated rent
- $2,505 high interval (Pro) →
- Mortgage (P&I)
- −$1,652
- Tax est. 1.5%
- −$394 /mo · $4,725/yr
- Insurance
- −$131
- HOA
- −$17
- Vacancy / Maint / Mgmt
- −$526
- Net cashflow
- $-215
Break-even live
UW: 25.0% down · 7.5% · 30yr · 1.5% tax · 5.0% vac · 8.0% maint · 8.0% mgmt
Financing live
Cash to close
- Down payment
- $78,748
- Closing costs
- $9,450
- Reserves months
- —
- Total cash needed
- —
Loan-product check · same deal, 3 products live
Conventional
25% down · 7.5% · 30yr
- Down + closing
- —
- Monthly P&I
- —
- Monthly cashflow
- —
- DSCR
- —
- Eligible?
- —
Personal DTI + credit; lowest rate.
DSCR
20% down · 8.5% · 30yr
- Down + closing
- —
- Monthly P&I
- —
- Monthly cashflow
- —
- DSCR
- —
- Eligible?
- —
No personal income docs; deal must DSCR.
Hard money
10% down · 12.0% · 12mo
- Down + closing
- —
- Monthly P&I
- —
- Monthly cashflow
- —
- DSCR
- —
- Eligible?
- —
Short-term bridge; refi at stabilization.
Rent comps 31 comps
| Address | Beds | Baths | Sqft | Rent | $/sqft | DOM | Units | Dist |
|---|---|---|---|---|---|---|---|---|
| 3910 Amers Loop Haines City, FL | 5.0 | 2.5 | 2112 | $2,600 | $1.23 | 23d | 1 | 0.02mi |
| 3898 Amers Loop Haines City, FL | 4.0 | 2.5 | 1874 | $2,150 | $1.15 | 23d | 1 | 0.04mi |
| 4034 Old Mill Rd Haines City, FL | 5.0 | 2.5 | 2326 | $2,400 | $1.03 | 3d | 1 | 0.05mi |
| 3874 Amers Loop Haines City, FL | 4.0 | 2.5 | 1874 | $2,130 | $1.14 | 3d | 1 | 0.08mi |
| 4813 Katrina Dr Haines City, FL | 4.0 | 2.0 | 2000 | $2,000 | $1.00 | 23d | 1 | 0.32mi |
| 5193 Green Belt Dr Haines City, FL | 4.0 | 2.0 | 1824 | $2,099 | $1.15 | 23d | 1 | 0.39mi |
| 5177 Green Belt Dr Haines City, FL | 4.0 | 3.0 | 2109 | $2,920 | $1.38 | 3d | 1 | 0.42mi |
| 4757 Katrina Dr Haines City, FL | 4.0 | 2.0 | 2451 | $2,050 | $0.84 | 23d | 1 | 0.46mi |
| 5161 Green Belt Dr Haines City, FL | 4.0 | 2.5 | 2500 | $2,100 | $0.84 | 23d | 1 | 0.47mi |
| 5157 Green Belt Dr Haines City, FL | 4.0 | 3.0 | 2109 | $2,900 | $1.38 | 3d | 1 | 0.48mi |
| 4746 Katrina Dr Haines City, FL | 4.0 | 2.0 | 1818 | $2,095 | $1.15 | 23d | 1 | 0.48mi |
| 5153 Green Belt Dr Haines City, FL | 4.0 | 2.0 | 1824 | $2,300 | $1.26 | 14d | 1 | 0.48mi |
| 5009 Katrina Dr Haines City, FL | 4.0 | 2.0 | 1840 | $2,500 | $1.36 | 23d | 1 | 0.51mi |
| 1433 Princess Tree Ct Haines City, FL | 4.0 | 2.0 | 1828 | $1,999 | $1.09 | 23d | 1 | 0.90mi |
| 2203 Pigeon Plum Dr Haines City, FL | 4.0 | 3.0 | 1887 | $2,190 | $1.16 | 10d | 1 | 1.07mi |
| 144 Towns Cir Haines City, FL | 5.0 | 3.0 | 2712 | $2,600 | $0.96 | 23d | 1 | 1.16mi |
| 1950 Pond Pine Ct Haines City, FL | 4.0 | 2.0 | 1939 | $1,975 | $1.02 | 23d | 1 | 1.17mi |
| 600 Silver Palm Dr Haines City, FL | 4.0 | 2.5 | 2267 | $2,800 | $1.24 | 10d | 1 | 1.19mi |
| 621 Sand Pine Ln Haines City, FL | 4.0 | 2.5 | 2040 | $2,350 | $1.15 | 10d | 1 | 1.22mi |
| 1276 Tupelo Trl Haines City, FL | 4.0 | 3.0 | 1900 | $1,895 | $1.00 | 11d | 1 | 1.23mi |
| 2622 Irish Elk Ave Davenport, FL | 4.0 | 2.0 | 1840 | $2,200 | $1.20 | 23d | 1 | 1.27mi |
| 1361 Current Pl Haines City, FL | 4.0 | 2.0 | 1630 | $2,100 | $1.29 | 23d | 1 | 1.30mi |
| 333 Hidden Lake Loop Haines City, FL | 4.0 | 2.0 | 1909 | $1,985 | $1.04 | 11d | 1 | 1.30mi |
| 202 Hidden Lake Loop Haines City, FL | 4.0 | 2.0 | 1981 | $1,905 | $0.96 | 11d | 1 | 1.33mi |
| 429 Silver Palm Dr Haines City, FL | 4.0 | 2.0 | 1625 | $1,990 | $1.22 | 19d | 1 | 1.33mi |
| 167 Hidden Lake Loop Haines City, FL | 4.0 | 2.0 | 1981 | $2,020 | $1.02 | 19d | 1 | 1.37mi |
| 1462 Sea Glass Rd Haines City, FL | 4.0 | 2.5 | 2168 | $2,200 | $1.01 | 23d | 1 | 1.37mi |
| 117 Hidden Lake Loop Haines City, FL | 4.0 | 2.5 | 2099 | $2,085 | $0.99 | 23d | 1 | 1.38mi |
| 120 Hidden Lake Loop Haines City, FL | 4.0 | 2.0 | 1909 | $2,020 | $1.06 | 14d | 1 | 1.39mi |
| 299 Bottle Brush Dr Haines City, FL | 4.0 | 2.0 | 1763 | $2,300 | $1.30 | 23d | 1 | 1.45mi |
| 219 Bottle Brush Dr Haines City, FL | 4.0 | 3.0 | 2420 | $2,450 | $1.01 | 23d | 1 | 1.46mi |
HOA detail
- Monthly dues
- $17 · $204/yr
- Likely covers
- pool
Listing history 8 events
-
2026-05-04status Pending
-
2026-04-29price $314,990
-
2026-04-01status Active
-
2026-04-01price $334,990
-
2026-03-24soldstatus $344,600
-
2026-03-13status Pending
-
2026-03-12historical
-
2026-03-04$319,990 Active
ⓘ Source: listings_history table (triggers on properties + properties_extension) + one-shot
backfill from property_details.listing_events for pre-trigger history.
Nearby sold comps map
Loading sold comps map…
Walkable amenities ~0.75 mi
Loading nearby amenities…
Taxation est. · year 1
- Rental income
- $30,055
- − Mortgage interest
- −$17,644
- − Property taxes
- −$4,725
- − Insurance
- −$1,575
- − Repairs & maintenance
- −$2,404
- − Management
- −$2,404
- − HOA
- −$204
- − Depreciation
- −$9,163
- Taxable loss
- −$8,065
- Est. tax savings @ 24.0%
- +$1,936
- After-tax cash flow
- $-647/yr
For passive investors: Depreciation is non-cash, so a rental often shows a tax loss while cash-flowing — sheltering income. Rental losses are passive: they offset passive income freely, and up to $25,000/yr can offset ordinary (W-2) income if you actively participate and your MAGI is under $100k (phasing out to $0 by $150k); unused losses carry forward. On sale, claimed depreciation is recaptured at up to 25%, and gains may owe capital-gains tax (a 1031 exchange can defer both). Figures are a year-1 estimate at your 24.0% rate — not tax advice; consult a CPA.
Schools (NCES district)
- District
- Polk
- NCES district ID
- 1201590
- Math proficiency
- 39% ▼ -11.00%
- Reading proficiency
- 43% ▼ -4.00%
- Median HH income
- $43,979
- Composite
- 34.74/100
- National rank
- #5132
- State rank
- #62 of 73 in FL
Livability — Haines City
- Score
- 74/100
- State rank
- #285
- US rank
- #4575
Category grades
Schools grade is shown separately in the Schools card above.
Census & demographics
- Census place
- Haines City, FL
- County
- Polk County · 740,051 people
- City population
- 51,255
- Metro
- Lakeland-Winter Haven, FL
- Population (ZIP)
- 51,255
- Household income
- $63,650
- Rent vs Own
- Severe rent burden
- 1107.0
Population outlook (Polk County) Hauer SSP2
- Today (2025)
- 752,975 people
- By 2030
- 804,621 · +6.9%
- By 2040
- 906,117 · +20.3%
- By 2050
- 1,000,476 · +32.9%
- By 2075
- 1,197,520 · +59.0%
- By 2100
- 1,271,518 · +68.9%
Race, ethnicity, and origin ACS 2023
- Neighborhood character
- Diverse neighborhood (Simpson 0.64)
- Race & ethnicity
- Hispanic / Latino 48% White 31% Black 18% Two or more races 12% Asian 1%
- Hispanic origin (detail)
- Mexican 19% Puerto Rican 19% Cuban 1% Dominican 3%
- Common ancestry
- Hispanic 4% Lithuanian 1% Romanian 1%
- Foreign-born
- 15% · Canada, Jamaica, Guatemala
- Languages at home
- 55% English-only · Spanish 39% French/Haitian/Cajun 4% Other Indo-European 0%
Political lean MEDSL · Polk
- 2024 margin
- Strong R (+20.7) · D 39.2% · R 59.9%
- 2008→2024 swing
- -14.6pp toward R · 2008: -6.1pp · 2024: -20.7pp
- All cycles
- 2024: R+20.7 2020: R+14.4 2016: R+14.1 2012: R+6.8 2008: R+6.1
Not yet ingested
- Civics
- —
Market trends
- HPI YoY
- ▼ -105.94%
- Current HPI
- 291.0798
- Rent YoY
- ▲ 1.16%
- Metro
- Lakeland-Winter Haven, FL
- State GDP YoY
- ▲ 3.28%
- F500 in state
- 36
Industry mix (Fortune 500 HQ in FL)
| Industry | F500 HQs | Revenue |
|---|---|---|
| Industrial Technology | 2 | $29B |
|
||
| Insurance | 2 | $17B |
|
||
| Retail | 1 | $60B |
|
||
| Technology Distribution | 1 | $58B |
|
||
| Homebuilding | 1 | $35B |
|
||
| Technology Manufacturing | 1 | $35B |
|
||
Price history
-1.6% since first listed8 events — show timeline
- 2026-05-04 Pending — Stellar MLS as Distributed by MLS Grid
- 2026-04-29 Price Changed $314,990 Stellar MLS as Distributed by MLS Grid
- 2026-04-01 Relisted — Stellar MLS as Distributed by MLS Grid
- 2026-04-01 Price Changed $334,990 Stellar MLS as Distributed by MLS Grid
- 2026-03-24 Sold (Public Records) $344,600 Public Records
- 2026-03-13 Pending — Stellar MLS as Distributed by MLS Grid
- 2026-03-12 Listing Removed — Stellar MLS as Distributed by MLS Grid
- 2026-03-04 Listed $319,990 Stellar MLS as Distributed by MLS Grid
Cash-flow waterfall
monthlySold comps — $/sqft
last 12 mo · ≤1 miLoading sold comps…