 🏗️ New Construction
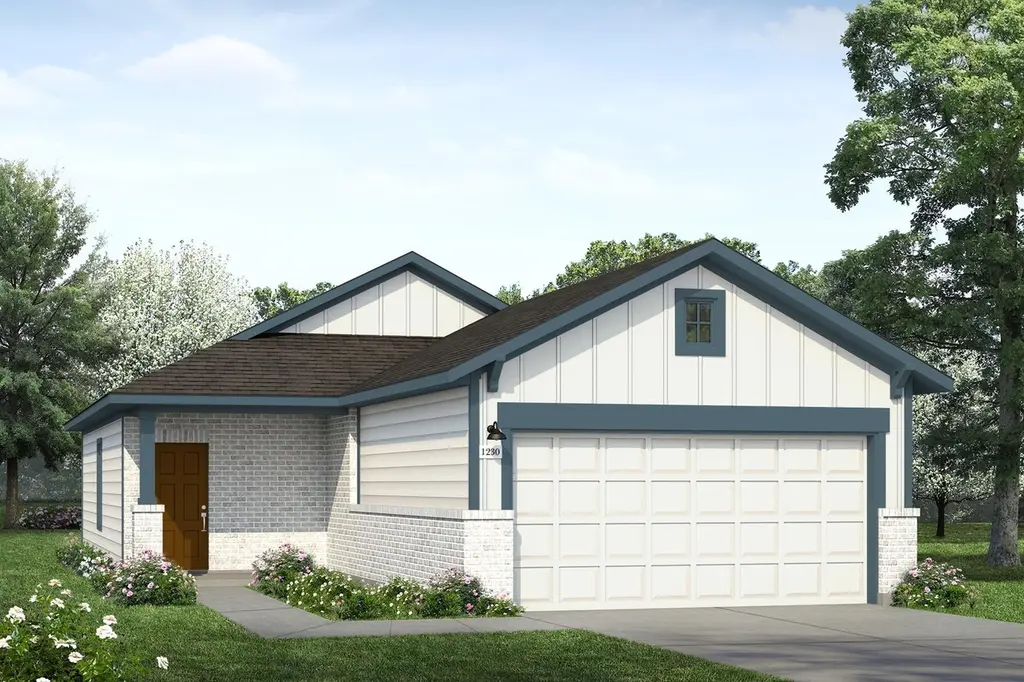
Mustang Meadows 1230 Plan · Waller, TX
Flood risk 1/10 · Minimal
- FEMA flood zone
- X (unshaded)
- Chance of flooding over 30 yrs
- 0.0%
- Est. flood insurance / yr
- $507 – $1,088
Fire risk 7/10 · Major
- Est. fire insurance / yr
- $1,222 – $2,270
Heat risk 8/10 · Major
- Hot days now (above 111°F)
- 7 days/yr
- Hot days in 30 yrs
- 22 days/yr
Wind risk 9/10 · Severe
- Chance of severe wind over 30 yrs
- 99.0%
Air-quality risk 2/10 · Minimal
- Unhealthy air days now
- 1 days/yr
- Unhealthy air days in 30 yrs
- 1 days/yr
Risk factors via First Street. Map © Google.
Why this score? — see what drove the D+ grade
The composite is a weighted blend of 9 inputs, each scored 0–100. Each bar is that input's sub-score; the figure is the points it added to the 100-point composite (weight × sub-score).
- Cash flow +14.7/30.0
- ARV discount +7.5/15.0
- DSCR +4.5/10.0
- 1% rule +4.1/10.0
- Condition / age +4.0/5.0
- Livability +3.1/5.0
- Appreciation +2.9/10.0
- Schools +2.9/10.0
- Rent growth +1.6/5.0
$199,990
🖨 Deal sheet 📄 Offer letter ✓ Due diligence
Listing remarks
In Mustang Meadows, the ease of small-town living meets the convenience of having everything you need just minutes away. Surrounded by open space and rooted in a strong school district, the community offers a laid-back lifestyle while still placing you close to retail, dining, and plenty of outdoor adventure. With immediate access to Hwy 290, getting to work, meeting friends, or heading into Houston for the day is a breeze. It's a setting built for those who want room to relax without losing the convenience of being near it all.
Key facts
- Close to dining
- Close to retail
- Outdoor adventure
Tags
Property features AI
Finance
- Other: Listing status: Active
- Financial info: List price $199,990
Exterior
- Home design: Mustang Meadows 1230 plan; Located in Waller, TX
- Construction: New construction plan (Mustang Meadows 1230)
- Exterior features: Living area approximately 1,230 (plan)
Interior
- Bedrooms: 3 bedrooms
- Bathrooms: 2 bathrooms
- Interior features: Plan-based new construction
Neighborhood map
What this means for you Summary
Snapshot
- This is a 3-bed/2.0-bath single-family listed at $200k. Condition is rated good.
Deal economics
- At list price, monthly cash flow is $50 ($606/yr) — positive.
- To cash-flow at today's rent, offer at most $199k (0.4% below list).
- To meet the 1% rule (rent ≥ 1% of price), the offer needs to be $174k (12.9% below list).
- Recommended offer: $174k (12.9% below list) — sets the bar for 1% rule.
- Cap rate 6.6% vs local median 3.0% in Waller — top-decile yield for the area; either an underpriced asset or a hidden risk that comps aren't pricing in. Stress-test before assuming the spread holds.
Location & tenants
- Location reads 61/100 on livability (#1,003 in TX) — a middle-class / working-renter tenant base. Strengths: cost of living A+, housing A-; Watch: schools C-, crime D, amenities F.
- Waller ISD (rural): math 30% / reading 35% proficiency, ranked #532 of 826 in TX (top 64%) — families likely to look elsewhere, expect single-tenant / working-renter base with shorter leases.
- Market conditions: Rents falling (-3.8%/yr); 1183 active listings in the ZIP; solid renter incomes; 29,883 units permitted in Harris County in 2024 (8,621 in 5+ unit buildings).
Forward outlook
- Local home prices are declining (-3.0%/yr); year-one equity from $1k of loan paydown is wiped out by about $6k of value loss. Plan a longer hold.
- Harris County population projected at +47% by 2050 — long-run rental-demand tailwind backs the buy-and-hold thesis.
Negotiation context
- It's been on market 29 days — a 2% lower offer ($197k) is reasonable based on typical stale-listing flexibility.
Risks & watch-outs
- Climate carrying-cost: severe wind risk, 99% chance of damaging wind over 30y; major wildfire risk; extreme-heat days projected 7→22/yr by 2055 (HVAC capex compounding) — expect insurance premiums to compound above CPI over the hold.
Questions for the listing agent
- Is there a deadline driving the sale (1031 exchange, divorce, estate, relocation)? That informs how much negotiation room exists.
- Crime grade is D in this area — have there been break-ins, vandalism, or insurance claims at this property in the last 3 years? What carrier currently insures it and at what premium?
- The area grade is low — what's the realistic commute time and amenity access for the typical tenant pool here? Any planned neighborhood developments (good or bad) we should know about?
- What's the average days-on-market for RENTAL listings here right now (not sales)? A rising rental-DOM trend means longer vacancies and softer asking-rent achievability than the comps imply.
- What's the recent tenant-quality profile in this submarket — average credit score on applications, eviction rate, late-payment / NSF rate, and stable-employment percentage? A property-management company in the area should have these aggregated.
- How much new for-sale + rental construction is in the pipeline within 1–3 miles? Heavy new supply typically softens prices + rents 12–24 months out; constrained supply supports both.
Investment metrics
- 1% rule
- 0.91% ✗
- Cap rate
- 6.61%
- Cash-on-cash
- 1.13%
- DSCR
- 1.05
- GRM
- 9.2
CMA / ARV
- ARV (on-the-fly)
- $191,880
- Comps found
- 11
Show comp detail 11 sales within ~0.75 mi
| Address | Dist | Beds/Ba | Sqft | Sold | Price | $/sf | Match |
|---|---|---|---|---|---|---|---|
| 31227 Gayle Prairie Oaks St | 0.47mi | 3/2.0 | 1,212 (-2%) | 4mo | $224,990 | $186 | 72 |
| 31422 Gayle Prairie Oaks St | 0.58mi | 3/2.0 | 1,206 (-2%) | 9mo | $242,490 | $201 | 62 |
| 31318 Williams Landing St | 0.58mi | 3/2.0 | 1,212 (-2%) | 13mo | $199,990 | $165 | 60 |
| 31238 Williams Landing St | 0.42mi | 3/2.0 | 1,412 (+15%) | 10mo | $209,990 | $149 | 48 |
| 31318 Gayle Prairie Oaks St | 0.50mi | 3/2.0 | 1,412 (+15%) | 6mo | $204,990 | $145 | 47 |
| 31250 Williams Landing St | 0.44mi | 3/2.0 | 1,412 (+15%) | 9mo | $214,990 | $152 | 47 |
| 31266 Williams Landing St | 0.46mi | 3/2.0 | 1,412 (+15%) | 12mo | $254,990 | $181 | 44 |
| 31414 Gayle Prairie Oaks St | 0.57mi | 3/2.0 | 1,412 (+15%) | 8mo | $257,240 | $182 | 42 |
| 31271 Williams Landing St | 0.51mi | 3/2.0 | 1,412 (+15%) | 13mo | $219,990 | $156 | 41 |
| 31287 Williams Landing St | 0.54mi | 3/2.0 | 1,412 (+15%) | 14mo | $209,990 | $149 | 38 |
| 31303 Williams Landing St | 0.57mi | 3/2.0 | 1,412 (+15%) | 12mo | $206,990 | $147 | 38 |
Match score weights: distance 35% · size 25% · config 20% · recency 20%. Top-matched comps best support the ARV.
Projected returns pro-forma
-3.0% appreciation · 0.0% rent growth · sell at horizon
- IRR
- -17.9%
- Equity multiple
- 0.39×
- Total profit
- $-32,957
- Equity at exit
- $28,610
- IRR
- -17.3%
- Equity multiple
- 0.18×
- Total profit
- $-44,185
- Equity at exit
- $16,590
Cash invested: $53,726 (down + closing). Projections, not guarantees.
Landlord ↔ Tenant lean methodology
- Overall (STATE)
- 87 Strongly Landlord-Friendly
- State Texas
- 87 Strongly Landlord-Friendly · R+5
- County
- — inherits STATE
- City
- — inherits STATE
ZIP-level market 77484
- Home prices YoY
- -1.0%
- Rents YoY
- -3.8%
- Active inventory
- 1183
- Price-to-rent
- 9.6×
Monthly cashflow live
- Estimated rent
- $1,742 medium interval (Pro) →
- Mortgage (P&I)
- −$1,006
- Tax est. 1.5%
- −$240 /mo · $2,878/yr
- Insurance
- −$80
- HOA
- −$0
- Vacancy / Maint / Mgmt
- −$366
- Net cashflow
- $50
Break-even live
UW: 25.0% down · 7.5% · 30yr · 1.5% tax · 5.0% vac · 8.0% maint · 8.0% mgmt
Financing live
Cash to close
- Down payment
- $47,970
- Closing costs
- $5,756
- Reserves months
- —
- Total cash needed
- —
Loan-product check · same deal, 3 products live
Conventional
25% down · 7.5% · 30yr
- Down + closing
- —
- Monthly P&I
- —
- Monthly cashflow
- —
- DSCR
- —
- Eligible?
- —
Personal DTI + credit; lowest rate.
DSCR
20% down · 8.5% · 30yr
- Down + closing
- —
- Monthly P&I
- —
- Monthly cashflow
- —
- DSCR
- —
- Eligible?
- —
No personal income docs; deal must DSCR.
Hard money
10% down · 12.0% · 12mo
- Down + closing
- —
- Monthly P&I
- —
- Monthly cashflow
- —
- DSCR
- —
- Eligible?
- —
Short-term bridge; refi at stabilization.
Listing history 13 events
-
2026-06-18days on market $199,990 Active 29 DOM
-
2026-06-17days on market $199,990 Active 28 DOM
-
2026-06-16days on market $199,990 Active 27 DOM
-
2026-06-15days on market $199,990 Active 26 DOM
-
2026-06-13days on market $199,990 Active 24 DOM
-
2026-06-09days on market $199,990 Active 20 DOM
-
2026-06-08days on market $199,990 Active 19 DOM
-
2026-06-07days on market $199,990 Active 18 DOM
-
2026-06-04days on market $199,990 Active 15 DOM
-
2026-06-03days on market $199,990 Active 14 DOM
-
2026-06-02days on market $199,990 Active 13 DOM
-
2026-06-01days on market $199,990 Active 12 DOM
-
2026-05-31days on market $199,990 Active 11 DOM
ⓘ Source: listings_history table (triggers on properties + properties_extension) + one-shot
backfill from property_details.listing_events for pre-trigger history.
Climate risk First Street
- Flood 1/10 Low FEMA zone X (unshaded) · 0% chance over 30 yrs
- Wildfire 7/10 Severe
- Heat 8/10 Severe 7 d/yr ≥111°F today · 22 d/yr by 30 yrs out
- Wind 9/10 Extreme 99% chance of damaging wind over 30 yrs
- Air quality 2/10 Low 1 unhealthy d/yr today · 1 by 30 yrs out
Nearby sold comps map
Loading sold comps map…
Walkable amenities ~0.75 mi
Loading nearby amenities…
Taxation est. · year 1
- Rental income
- $20,909
- − Mortgage interest
- −$10,748
- − Property taxes
- −$2,878
- − Insurance
- −$959
- − Repairs & maintenance
- −$1,673
- − Management
- −$1,673
- − Depreciation
- −$5,582
- Taxable loss
- −$2,604
- Est. tax savings @ 24.0%
- +$625
- After-tax cash flow
- $1,231/yr
For passive investors: Depreciation is non-cash, so a rental often shows a tax loss while cash-flowing — sheltering income. Rental losses are passive: they offset passive income freely, and up to $25,000/yr can offset ordinary (W-2) income if you actively participate and your MAGI is under $100k (phasing out to $0 by $150k); unused losses carry forward. On sale, claimed depreciation is recaptured at up to 25%, and gains may owe capital-gains tax (a 1031 exchange can defer both). Figures are a year-1 estimate at your 24.0% rate — not tax advice; consult a CPA.
Condition & rehab AI · 3 photos
This home is in good condition with a good exterior and well-maintained landscaping. A fresh coat of paint and some landscaping improvements would significantly enhance its curb appeal and value.
Value-add opportunities
- Both Paint exterior — Enhances curb appeal and value
- Both Landscaping improvements — Improves curb appeal and enhances property value
Renovation cost estimate screening
Value-add ROI direction
- Both Paint exterior — Enhances curb appeal and value ↑
- Both Landscaping improvements — Improves curb appeal and enhances property value ↑
ⓘ Cost ranges are severity-bucket heuristics (US national rule-of-thumb). Get contractor quotes + a written scope before underwriting a rehab budget.
Schools (NCES district)
- District
- Waller ISD
- NCES district ID
- 4844430
- Math proficiency
- 30% ▼ -23.00%
- Reading proficiency
- 35% ▼ -11.00%
- Median HH income
- $58,911
- Composite
- 29.12/100
- National rank
- #6593
- State rank
- #532 of 826 in TX
Livability — Waller
- Score
- 61/100
- State rank
- #1003
- US rank
- #17792
Category grades
Schools grade is shown separately in the Schools card above.
Census & demographics
- County
- Harris County · 4,702,590 people
- Metro
- Houston-The Woodlands-Sugar Land, TX
- Population (ZIP)
- 14,348
- Household income
- $81,250
- Rent vs Own
- Severe rent burden
- 270.0
Population outlook (Harris County) Hauer SSP2
- Today (2025)
- 5,571,493 people
- By 2030
- 6,089,821 · +9.3%
- By 2040
- 7,142,806 · +28.2%
- By 2050
- 8,185,864 · +46.9%
- By 2075
- 10,574,329 · +89.8%
- By 2100
- 12,109,958 · +117.4%
Race, ethnicity, and origin ACS 2023
- Neighborhood character
- Diverse neighborhood (Simpson 0.66)
- Race & ethnicity
- White 47% Hispanic / Latino 31% Two or more races 16% Black 15%
- Hispanic origin (detail)
- Mexican 30%
- Common ancestry
- Slovak 2% Serbian 2% Iranian 1%
- Foreign-born
- 13% · Canada
- Languages at home
- 73% English-only · Spanish 24% Arabic 2%
Political lean MEDSL · Harris
- 2024 margin
- Lean D (+5.5) · D 52.0% · R 46.4% · Other 1.6%
- 2008→2024 swing
- +3.9pp toward D · 2008: 1.6pp · 2024: 5.5pp
- All cycles
- 2024: D+5.5 2020: D+13.3 2016: D+12.4 2012: D+0.1 2008: D+1.6
Not yet ingested
- Civics
- —
Market trends
- HPI YoY
- ▼ -4.17%
- Current HPI
- 397.85
- Rent YoY
- ▼ -3.77%
- Metro
- Houston-The Woodlands-Sugar Land, TX
- State GDP YoY
- ▲ 3.95%
- F500 in state
- 110
Industry mix (Fortune 500 HQ in TX)
| Industry | F500 HQs | Revenue |
|---|---|---|
| Energy | 16 | $1,198B |
|
||
| Technology | 5 | $198B |
|
||
| Engineering / Construction | 4 | $72B |
|
||
| Energy Services | 3 | $60B |
|
||
| Utilities | 3 | $41B |
|
||
| Healthcare | 2 | $330B |
|
||
Cash-flow waterfall
monthlySold comps — $/sqft
last 12 mo · ≤1 miLoading sold comps…