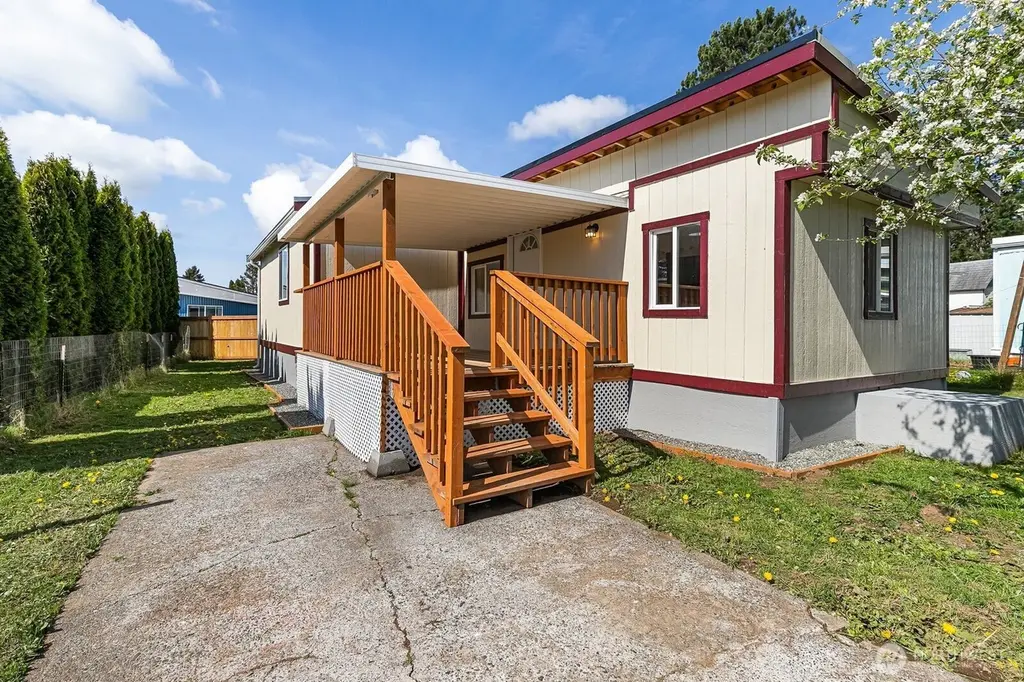
2392 Douglas Rd #19 · Ferndale, WA
Flood risk No data
- FEMA flood zone
- —
- Chance of flooding over 30 yrs
- —
- Est. flood insurance / yr
- —
Fire risk No data
- Est. fire insurance / yr
- —
Heat risk No data
- Hot days now (above threshold)
- —
- Hot days in 30 yrs
- —
Wind risk No data
- Chance of severe wind over 30 yrs
- —
Air-quality risk No data
- Unhealthy air days now
- —
- Unhealthy air days in 30 yrs
- —
Risk factors via First Street. Map © Google.
Why this score? — see what drove the D grade
The composite is a weighted blend of 9 inputs, each scored 0–100. Each bar is that input's sub-score; the figure is the points it added to the 100-point composite (weight × sub-score).
- Cash flow +18.3/30.0
- DSCR +5.7/10.0
- Schools +4.6/10.0
- Livability +4.0/5.0
- Rent growth +3.7/5.0
- 1% rule +3.5/10.0
- Condition / age +2.5/5.0
- ARV discount +0.0/15.0
- Appreciation +0.0/10.0
$199,000
🖨 Deal sheet 📄 Offer letter ✓ Due diligence
Listing remarks
Behold this big, beautiful 3BR, 2BA freshly updated unit located in a quiet, clean, secluded and extremely safe Mobile Court. Features include new plumbling, electrical, roof, floors, drywall, back entrance stairs w/ railing and a gorgeous new "covered" front deck which is perfect for entertaining friends! Inverter technology empowers you to save electricity while using your washer and dryer. You also have excellent versatility with the rooms. You could either use all 3 bedrooms or utilize one of them for an office, art, entertainment or storage space. Property is located just minutes from the heart of Ferndale and only 15-20 minutes from Bellingham. The owners have had this unit
Key facts
- New floors
- New drywall
- New plumbing
Tags
Property features AI
Finance
- Other: Calculated living area: 950; Foundation: Slab; Structure type: Manufactured house; Property condition: Good
- Financial info: Listing terms: Cash or Conventional
- HOA & community: Lamplighter Mobile Ct park (63 homes); Park not approved for sale; High speed internet available in park; Land lease: $600
Exterior
- Parking: Uncovered parking; 2 open parking spaces
- Utilities: Public water (City of Ferndale); Public sewer (City of Ferndale); Power by PSE; Cable: Xfinity; Internet: Xfinity
- Home design: Manufactured Home (Double Wide); One level; Entry on slab foundation
- Construction: Composition roof; Other construction materials; Manufactured after 06/15/1976; Mobile home remains
- Exterior features: Patio/porch/deck; Curbs; Dead end street; Other exterior features; Has view
Interior
- Kitchen: Refrigerator; Stove/Range
- Bedrooms: 3 bedrooms
- Flooring: Laminate
- Bathrooms: 3 full bathrooms; 1 bathtub; 2 showers
- Heating & cooling: Forced air heating; Forced air cooling; Has heating and cooling
- Interior features: Living room; Kitchen without eating space; Bath off primary; Patio/porch/deck; Refrigerator; Stove/Range
- Laundry & utility: Electric energy source
Neighborhood map
What this means for you Summary
Snapshot
- This is a 2-bed/1.0-bath manufactured listed at $199k.
Deal economics
- At list price, monthly cash flow is $182 ($2k/yr) — positive.
- The deal already cash-flows at list — no discount required.
- To meet the 1% rule (rent ≥ 1% of price), the offer needs to be $170k (14.7% below list).
- Recommended offer: $170k (14.7% below list) — sets the bar for 1% rule.
- Cap rate 7.4% vs local median 2.5% in Ferndale — top-decile yield for the area; either an underpriced asset or a hidden risk that comps aren't pricing in. Stress-test before assuming the spread holds.
Location & tenants
- Location reads 81/100 on livability (#79 in WA, #1,471 nationally) — a professional / high-income tenant draw. Strengths: commute A+, health & safety A+, housing A; Watch: amenities F, cost of living D-.
- Ferndale School District (suburban): math 43% / reading 58% proficiency, ranked #138 of 291 in WA (top 47%) — acceptable for families but not a draw, mixed tenant base, ~2y average lease.
- Zoned schools: Ferndale High School (1,323 students, 48% FRL).
- Market conditions: Rents rising fast (+4.8%/yr); 230 active listings in the ZIP; 2 comparable units currently listed for rent nearby; solid renter incomes; 1,190 units permitted in Whatcom County in 2024 (327 in 5+ unit buildings).
Forward outlook
- Local home prices are declining (-3.0%/yr); year-one equity from $1k of loan paydown is wiped out by about $6k of value loss. Plan a longer hold.
- Whatcom County population projected at +28% by 2050 — long-run rental-demand tailwind backs the buy-and-hold thesis.
Negotiation context
- It's been on market 55 days — a 3% lower offer ($193k) is reasonable based on typical stale-listing flexibility.
- 2 sale attempts since 3y ago with the ask held roughly flat each time — persistent listings suggest the price (not the market) is what's stuck; bring a comps-based counter.
- Current owner paid $40k; list at $199k implies a 398% gain — meaningful room to come down on a strong offer.
Questions for the listing agent
- It's been on market 55 days. Have you received any prior offers? Is the seller open to a 15% concession, seller financing, or rate buy-down credit?
- Is there a deadline driving the sale (1031 exchange, divorce, estate, relocation)? That informs how much negotiation room exists.
- Schools are B-rated — typically a magnet for longer-tenancy family renters. What's the average tenant stay here, and is there a school-zone premium baked into asking?
- The area grade is low — what's the realistic commute time and amenity access for the typical tenant pool here? Any planned neighborhood developments (good or bad) we should know about?
- What's the average days-on-market for RENTAL listings here right now (not sales)? A rising rental-DOM trend means longer vacancies and softer asking-rent achievability than the comps imply.
- What's the recent tenant-quality profile in this submarket — average credit score on applications, eviction rate, late-payment / NSF rate, and stable-employment percentage? A property-management company in the area should have these aggregated.
- How much new for-sale + rental construction is in the pipeline within 1–3 miles? Heavy new supply typically softens prices + rents 12–24 months out; constrained supply supports both.
Investment metrics
- 1% rule
- 0.85% ✗
- Cap rate
- 7.39%
- Cash-on-cash
- 3.92%
- DSCR
- 1.17
- GRM
- 9.8
CMA / ARV
- ARV (median comp)
- $167,242
- List price
- $199,000
- Delta
- 18.99%
- Verdict
- OVERPRICED
- Comps
- 3 within 1.0 mi
Show comp detail 1 sale within ~0.75 mi
| Address | Dist | Beds/Ba | Sqft | Sold | Price | $/sf | Match |
|---|---|---|---|---|---|---|---|
| 2392 Douglas Rd #52 | 0.00mi | 1/1.0 (-1) | 616 (0%) | 20mo | $134,500 | $218 | 79 |
Match score weights: distance 35% · size 25% · config 20% · recency 20%. Top-matched comps best support the ARV.
Projected returns pro-forma
-3.0% appreciation · 4.79% rent growth · sell at horizon
- IRR
- -8.5%
- Equity multiple
- 0.68×
- Total profit
- $-17,650
- Equity at exit
- $29,672
- IRR
- 2.9%
- Equity multiple
- 1.22×
- Total profit
- $12,372
- Equity at exit
- $17,206
Cash invested: $55,720 (down + closing). Projections, not guarantees.
Landlord ↔ Tenant lean methodology
- Overall (STATE)
- 28 Tenant-Leaning
- State Washington
- 28 Tenant-Leaning · D+8
- County
- — inherits STATE
- City
- — inherits STATE
ZIP-level market 98248
- Rents YoY
- 4.8%
- Active inventory
- 230
- Price-to-rent
- 9.8×
Monthly cashflow live
- Estimated rent
- $1,698 medium interval (Pro) →
- Mortgage (P&I)
- −$1,044
- Tax from tax record
- −$33 /mo · $398/yr
- Insurance
- −$83
- HOA
- −$0
- Vacancy / Maint / Mgmt
- −$357
- Net cashflow
- $182
Break-even live
UW: 25.0% down · 7.5% · 30yr · 1.5% tax · 5.0% vac · 8.0% maint · 8.0% mgmt
Financing live
Cash to close
- Down payment
- $49,750
- Closing costs
- $5,970
- Reserves months
- —
- Total cash needed
- —
Loan-product check · same deal, 3 products live
Conventional
25% down · 7.5% · 30yr
- Down + closing
- —
- Monthly P&I
- —
- Monthly cashflow
- —
- DSCR
- —
- Eligible?
- —
Personal DTI + credit; lowest rate.
DSCR
20% down · 8.5% · 30yr
- Down + closing
- —
- Monthly P&I
- —
- Monthly cashflow
- —
- DSCR
- —
- Eligible?
- —
No personal income docs; deal must DSCR.
Hard money
10% down · 12.0% · 12mo
- Down + closing
- —
- Monthly P&I
- —
- Monthly cashflow
- —
- DSCR
- —
- Eligible?
- —
Short-term bridge; refi at stabilization.
Rent comps 2 comps
| Address | Beds | Baths | Sqft | Rent | $/sqft | DOM | Units | Dist |
|---|---|---|---|---|---|---|---|---|
| 5601 3rd Ave Unit 7 Ferndale, WA | 1.0 | 1.0 | 600 | $1,200 | $2.00 | 13d | 1 | 0.79mi |
| 5775 Golden Eagle Dr Ferndale, WA | 1.0 | 1.0 | 600 | $1,350 | $2.25 | 43d | 1 | 0.91mi |
Listing history 19 events
-
2026-06-18days on market $199,000 Active 55 DOM
-
2026-06-17days on market $199,000 Active 54 DOM
-
2026-06-16days on market $199,000 Active 53 DOM
-
2026-06-15days on market $199,000 Active 52 DOM
-
2026-06-14days on market $199,000 Active 50 DOM
-
2026-06-13days on market $199,000 Active 49 DOM
-
2026-06-10days on market $199,000 Active 47 DOM
-
2026-06-09days on market $199,000 Active 46 DOM
-
2026-06-08days on market $199,000 Active 45 DOM
-
2026-06-07days on market $199,000 Active 44 DOM
-
2026-06-03days on market $199,000 Active 40 DOM
-
2026-06-02days on market $199,000 Active 39 DOM
-
2026-06-01days on market $199,000 Active 38 DOM
-
2026-05-31days on market $199,000 Active 37 DOM
-
2026-05-30days on market $199,000 Active 36 DOM
-
2026-04-24$199,000 Active
-
2023-04-14soldstatus $40,000 Closed
-
2023-04-05status Pending
-
2023-03-14$40,000 Active
ⓘ Source: listings_history table (triggers on properties + properties_extension) + one-shot
backfill from property_details.listing_events for pre-trigger history.
Tax reassessment forecast WA · Resets to sale price
- Current annual tax
- $398 · $33/mo
- Projected year-2 tax
- $1,950 · $163/mo
- Expected delta
- +$1,552/yr (+$129/mo · 389.9%)
ⓘ Screening estimate from a state-policy table — verify with the county assessor before closing.
Nearby sold comps map
Loading sold comps map…
Walkable amenities ~0.75 mi
Loading nearby amenities…
Taxation est. · year 1
- Rental income
- $20,379
- − Mortgage interest
- −$11,147
- − Property taxes
- −$398
- − Insurance
- −$995
- − Repairs & maintenance
- −$1,630
- − Management
- −$1,630
- − Depreciation
- −$5,789
- Taxable loss
- −$1,211
- Est. tax savings @ 24.0%
- +$291
- After-tax cash flow
- $2,474/yr
For passive investors: Depreciation is non-cash, so a rental often shows a tax loss while cash-flowing — sheltering income. Rental losses are passive: they offset passive income freely, and up to $25,000/yr can offset ordinary (W-2) income if you actively participate and your MAGI is under $100k (phasing out to $0 by $150k); unused losses carry forward. On sale, claimed depreciation is recaptured at up to 25%, and gains may owe capital-gains tax (a 1031 exchange can defer both). Figures are a year-1 estimate at your 24.0% rate — not tax advice; consult a CPA.
Schools (NCES district)
- District
- Ferndale School District
- NCES district ID
- 5302850
- Math proficiency
- 43% ▲ 1.00%
- Reading proficiency
- 58% ▲ 4.00%
- Median HH income
- $59,413
- Composite
- 46.06/100
- National rank
- #5494
- State rank
- #138 of 291 in WA
Livability — Ferndale
- Score
- 81/100
- State rank
- #79
- US rank
- #1471
Category grades
Schools grade is shown separately in the Schools card above.
Census & demographics
- Census place
- Ferndale, WA
- County
- Whatcom County · 209,776 people
- City population
- 28,498
- Metro
- Bellingham, WA
- Population (ZIP)
- 28,498
- Household income
- $91,060
- Rent vs Own
- Severe rent burden
- 582.0
Population outlook (Whatcom County) Hauer SSP2
- Today (2025)
- 240,408 people
- By 2030
- 254,667 · +5.9%
- By 2040
- 281,365 · +17.0%
- By 2050
- 307,592 · +27.9%
- By 2075
- 375,576 · +56.2%
- By 2100
- 421,637 · +75.4%
Race, ethnicity, and origin ACS 2023
- Neighborhood character
- Predominantly White (75%)
- Race & ethnicity
- White 75% Hispanic / Latino 11% Two or more races 8% Asian 6% Native American 2%
- Hispanic origin (detail)
- Mexican 7%
- Common ancestry
- Iranian 5% Portuguese 4% Italian 4%
- Foreign-born
- 12% · Canada, China
- Languages at home
- 83% English-only · Spanish 6% Other Indo-European 5% Russian/Polish/Slavic 3%
Political lean MEDSL · Whatcom
- 2024 margin
- Strong D (+24.9) · D 60.8% · R 35.9% · Other 3.3%
- 2008→2024 swing
- +6.9pp toward D · 2008: 18.0pp · 2024: 24.9pp
- All cycles
- 2024: D+24.9 2020: D+23.9 2016: D+17.7 2012: D+12.1 2008: D+18.0
Not yet ingested
- Civics
- —
Market trends
- HPI YoY
- ▼ -427.43%
- Current HPI
- 407.6077
- Rent YoY
- ▲ 4.79%
- Metro
- Bellingham, WA
- State GDP YoY
- ▲ 4.65%
- F500 in state
- 22
Industry mix (Fortune 500 HQ in WA)
| Industry | F500 HQs | Revenue |
|---|---|---|
| Retail | 2 | $269B |
|
||
| Technology / Retail | 1 | $638B |
|
||
| Technology | 1 | $245B |
|
||
| Telecommunications | 1 | $38B |
|
||
| Food / Beverage | 1 | $36B |
|
||
| Automotive / Trucks | 1 | $34B |
|
||
Price history
+397.5% since first listed4 events — show timeline
- 2026-04-24 Listed $199,000 NWMLS as Distributed by MLS Grid
- 2023-04-14 Sold (MLS) $40,000 NWMLS as Distributed by MLS Grid
- 2023-04-05 Pending — NWMLS as Distributed by MLS Grid
- 2023-03-14 Listed $40,000 NWMLS as Distributed by MLS Grid
Property tax history
+10.5%/yrLatest (2026): $398 · +41.5% YoY. Source: county tax records.
Cash-flow waterfall
monthlySold comps — $/sqft
last 12 mo · ≤1 miLoading sold comps…