743 Bedwell St · Jacksonville, IL
Flood risk 1/10 · Minimal
- FEMA flood zone
- X (unshaded)
- Chance of flooding over 30 yrs
- 0.0%
- Est. flood insurance / yr
- $473 – $860
Fire risk 1/10 · Minimal
- Est. fire insurance / yr
- $804 – $1,492
Heat risk 4/10 · Minor
- Hot days now (above 105°F)
- 7 days/yr
- Hot days in 30 yrs
- 19 days/yr
Wind risk 2/10 · Minimal
- Chance of severe wind over 30 yrs
- 2.0%
Air-quality risk 2/10 · Minimal
- Unhealthy air days now
- 1 days/yr
- Unhealthy air days in 30 yrs
- 2 days/yr
Risk factors via First Street. Map © Google.
Why this score? — see what drove the C- grade
The composite is a weighted blend of 9 inputs, each scored 0–100. Each bar is that input's sub-score; the figure is the points it added to the 100-point composite (weight × sub-score).
- Cash flow +22.0/30.0
- ARV discount +7.5/15.0
- DSCR +7.0/10.0
- 1% rule +5.8/10.0
- Livability +3.8/5.0
- Rent growth +2.5/5.0
- Condition / age +2.5/5.0
- Schools +1.9/10.0
- Appreciation +0.0/10.0
$120,000
🖨 Deal sheet 📄 Offer letter ✓ Due diligence
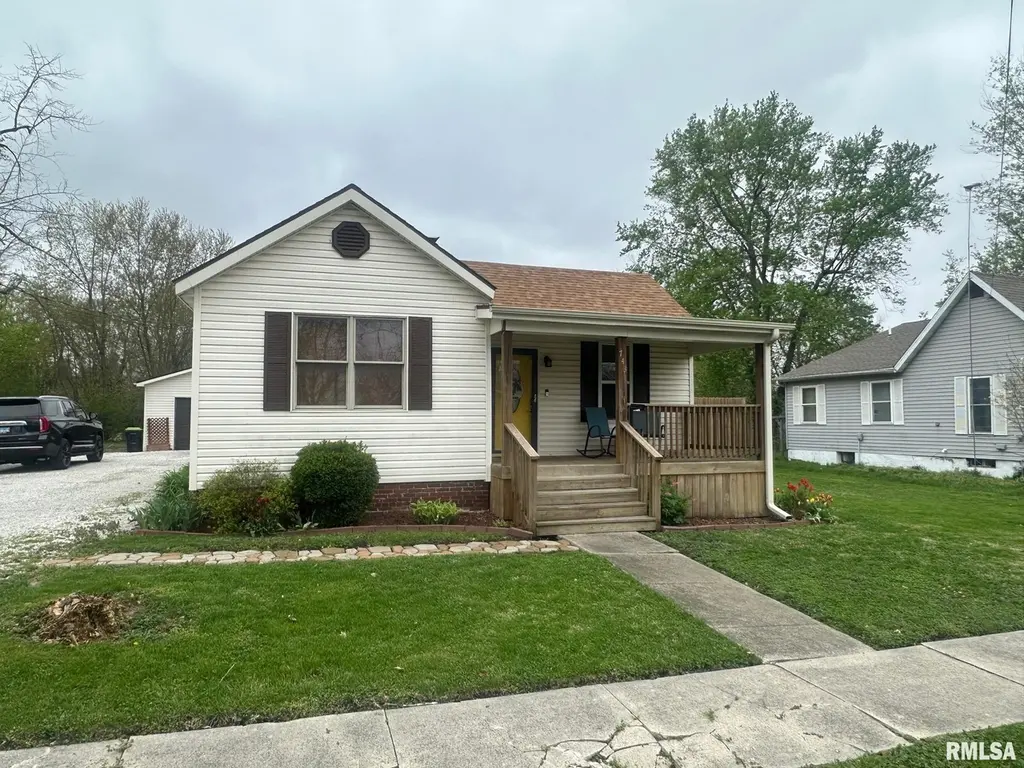
Listing remarks
Great 3-bedroom 1 bath Bungalow. Home features a large vaulted eat in kitchen! Newer Bath! Nice Vinyl siding. Two Lots comes with purchase and no backyard neighbors. 40x24 Amazing two car garage with two room office or workshop on the back. Large Private Deck! Above ground pool and Cool Patio!
Key facts
- 0.27 acre lot
- 2 garage spots
- Built 1930
Neighborhood map
What this means for you Summary
Snapshot
- This is a 3-bed/1.0-bath other listed at $120k.
Deal economics
- At list price, monthly cash flow is $192 ($2k/yr) — positive.
- The deal already cash-flows at list — no discount required.
- Meets the 1% rule at list price ($1k rent vs $120k).
- Cap rate 8.2% vs local median 5.4% in Jacksonville — top-decile yield for the area; either an underpriced asset or a hidden risk that comps aren't pricing in. Stress-test before assuming the spread holds.
Location & tenants
- Location reads 76/100 on livability (#187 in IL, #3,543 nationally) — a middle-class / working-renter tenant base. Strengths: cost of living A+, housing A+, health & safety A+; Watch: crime C-, amenities C-, schools D.
- Jacksonville SD 117 (town): math 20% / reading 23% proficiency, ranked #407 of 620 in IL (top 66%) — low school quality limits family demand, transient renter base, plan for 1-2y turnover.
- Market conditions: 141 active listings in the ZIP; 3 units permitted in Morgan County in 2024 (0 in 5+ unit buildings).
Forward outlook
- Local home prices are declining (-3.0%/yr); year-one equity from $830 of loan paydown is wiped out by about $4k of value loss. Plan a longer hold.
- Morgan County population projected at -20% by 2050 — secular population decline; favor cash flow + early exit over multi-decade hold.
Negotiation context
- Only 0 days on market — expect competitive offers; lowballing is unlikely to land.
- Current owner paid $18k; list at $120k implies a 567% gain — meaningful room to come down on a strong offer.
Risks & watch-outs
- Watch-outs: built in 1930 — expect roof / HVAC / electrical / plumbing capex.
Questions for the listing agent
- Built in 1930 — when were the roof, HVAC, electrical panel, plumbing, and water heater last replaced?
- Is there a deadline driving the sale (1031 exchange, divorce, estate, relocation)? That informs how much negotiation room exists.
- Schools are D-rated, which usually means shorter tenancies and higher turnover. Who's the typical renter profile here, and what's been the actual vacancy rate?
- What's the average days-on-market for RENTAL listings here right now (not sales)? A rising rental-DOM trend means longer vacancies and softer asking-rent achievability than the comps imply.
- What's the recent tenant-quality profile in this submarket — average credit score on applications, eviction rate, late-payment / NSF rate, and stable-employment percentage? A property-management company in the area should have these aggregated.
- How much new for-sale + rental construction is in the pipeline within 1–3 miles? Heavy new supply typically softens prices + rents 12–24 months out; constrained supply supports both.
Investment metrics
- 1% rule
- 1.08% ✓
- Cap rate
- 8.21%
- Cash-on-cash
- 6.85%
- DSCR
- 1.30
- GRM
- 7.7
CMA / ARV
No comps found within radius.
Projected returns pro-forma
-3.0% appreciation · 3.0% rent growth · sell at horizon
- IRR
- -5.8%
- Equity multiple
- 0.79×
- Total profit
- $-7,209
- Equity at exit
- $17,892
- IRR
- 3.9%
- Equity multiple
- 1.28×
- Total profit
- $9,532
- Equity at exit
- $10,375
Cash invested: $33,600 (down + closing). Projections, not guarantees.
Landlord ↔ Tenant lean methodology
- Overall (STATE)
- 43 Moderately Tenant-Leaning
- State Illinois
- 43 Moderately Tenant-Leaning · D+7
- County
- — inherits STATE
- City
- — inherits STATE
ZIP-level market 62650
- Active inventory
- 141
- Price-to-rent
- 7.7×
Monthly cashflow live
- Estimated rent
- $1,293 medium interval (Pro) →
- Mortgage (P&I)
- −$629
- Tax est. 1.5%
- −$150 /mo · $1,800/yr
- Insurance
- −$50
- HOA
- −$0
- Vacancy / Maint / Mgmt
- −$271
- Net cashflow
- $192
Break-even live
UW: 25.0% down · 7.5% · 30yr · 1.5% tax · 5.0% vac · 8.0% maint · 8.0% mgmt
Financing live
Cash to close
- Down payment
- $30,000
- Closing costs
- $3,600
- Reserves months
- —
- Total cash needed
- —
Loan-product check · same deal, 3 products live
Conventional
25% down · 7.5% · 30yr
- Down + closing
- —
- Monthly P&I
- —
- Monthly cashflow
- —
- DSCR
- —
- Eligible?
- —
Personal DTI + credit; lowest rate.
DSCR
20% down · 8.5% · 30yr
- Down + closing
- —
- Monthly P&I
- —
- Monthly cashflow
- —
- DSCR
- —
- Eligible?
- —
No personal income docs; deal must DSCR.
Hard money
10% down · 12.0% · 12mo
- Down + closing
- —
- Monthly P&I
- —
- Monthly cashflow
- —
- DSCR
- —
- Eligible?
- —
Short-term bridge; refi at stabilization.
Listing history 4 events
-
2026-04-13$120,000
-
2026-04-13historical
-
2021-08-06historical
-
2005-05-03soldstatus $18,000
ⓘ Source: listings_history table (triggers on properties + properties_extension) + one-shot
backfill from property_details.listing_events for pre-trigger history.
Climate risk First Street
- Flood 1/10 Low FEMA zone X (unshaded) · 0% chance over 30 yrs
- Wildfire 1/10 Low
- Heat 4/10 Moderate 7 d/yr ≥105°F today · 19 d/yr by 30 yrs out
- Wind 2/10 Low 2% chance of damaging wind over 30 yrs
- Air quality 2/10 Low 1 unhealthy d/yr today · 2 by 30 yrs out
Nearby sold comps map
Loading sold comps map…
Walkable amenities ~0.75 mi
Loading nearby amenities…
Taxation est. · year 1
- Rental income
- $15,510
- − Mortgage interest
- −$6,722
- − Property taxes
- −$1,800
- − Insurance
- −$600
- − Repairs & maintenance
- −$1,241
- − Management
- −$1,241
- − Depreciation
- −$3,491
- Taxable income
- $416
- Est. tax owed @ 24.0%
- −$100
- After-tax cash flow
- $2,202/yr
For passive investors: Depreciation is non-cash, so a rental often shows a tax loss while cash-flowing — sheltering income. Rental losses are passive: they offset passive income freely, and up to $25,000/yr can offset ordinary (W-2) income if you actively participate and your MAGI is under $100k (phasing out to $0 by $150k); unused losses carry forward. On sale, claimed depreciation is recaptured at up to 25%, and gains may owe capital-gains tax (a 1031 exchange can defer both). Figures are a year-1 estimate at your 24.0% rate — not tax advice; consult a CPA.
Schools (NCES district)
- District
- Jacksonville SD 117
- NCES district ID
- 1720280
- Math proficiency
- 20% ▼ -3.00%
- Reading proficiency
- 23% ▼ -6.00%
- Median HH income
- $44,909
- Composite
- 18.66/100
- National rank
- #8888
- State rank
- #407 of 620 in IL
Livability — Jacksonville
- Score
- 76/100
- State rank
- #187
- US rank
- #3543
Category grades
Schools grade is shown separately in the Schools card above.
Census & demographics
- Census place
- Jacksonville, IL
- City population
- 24,318
- Population (ZIP)
- 24,318
Population outlook (Morgan County) Hauer SSP2
- Today (2025)
- 32,874 people
- By 2030
- 31,698 · -3.6%
- By 2040
- 29,050 · -11.6%
- By 2050
- 26,381 · -19.8%
- By 2075
- 20,235 · -38.4%
- By 2100
- 14,324 · -56.4%
Race, ethnicity, and origin ACS 2023
- Neighborhood character
- Predominantly White (85%)
- Race & ethnicity
- White 85% Black 7% Two or more races 5% Hispanic / Latino 3%
- Common ancestry
- Lithuanian 2% Slovak 1% Iranian 1%
- Foreign-born
- 1% · Canada, South Korea
- Languages at home
- 97% English-only · Spanish 2%
Political lean MEDSL · Morgan
- 2024 margin
- Solid R (+32.5) · D 33.1% · R 65.6% · Other 1.3%
- 2008→2024 swing
- -31.7pp toward R · 2008: -0.8pp · 2024: -32.5pp
- All cycles
- 2024: R+32.5 2020: R+31.8 2016: R+29.9 2012: R+15.4 2008: R+0.8
Not yet ingested
- Civics
- —
Market trends
- HPI YoY
- ▼ -84.33%
- Current HPI
- 126.5712
- Rent YoY
- —
- Metro
- —
- State GDP YoY
- ▲ 1.59%
- F500 in state
- 60
Industry mix (Fortune 500 HQ in IL)
| Industry | F500 HQs | Revenue |
|---|---|---|
| Insurance | 4 | $201B |
|
||
| Consumer Goods | 4 | $87B |
|
||
| Industrial Machinery | 3 | $64B |
|
||
| Healthcare | 2 | $55B |
|
||
| Retail / Pharmacy | 1 | $148B |
|
||
| Agriculture / Food | 1 | $86B |
|
||
Price history
+566.7% since first listed4 events — show timeline
- 2026-04-13 Listing Removed — RMLSA as Distributed by MLS Grid
- 2026-04-13 Listed $120,000 RMLSA as Distributed by MLS Grid
- 2021-08-06 Listing Removed — RMLSA as Distributed by MLS Grid
- 2005-05-03 Sold (Public Records) $18,000 Public Records
Property tax history
-26.5%/yrLatest (2024): $47 · -6.1% YoY. Source: county tax records.
Cash-flow waterfall
monthlySold comps — $/sqft
last 12 mo · ≤1 miLoading sold comps…