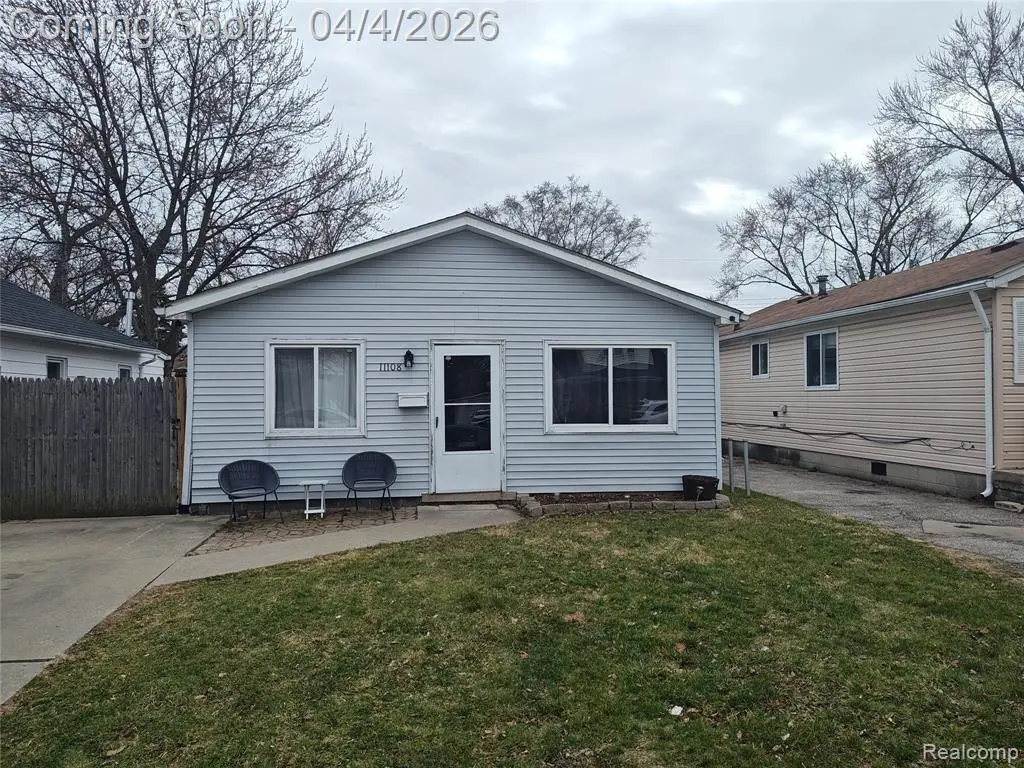
11108 Essex Ave · Warren, MI
Flood risk 3/10 · Minor
- FEMA flood zone
- X (unshaded)
- Chance of flooding over 30 yrs
- 0.2%
- Est. flood insurance / yr
- $507 – $1,088
Fire risk 1/10 · Minimal
- Est. fire insurance / yr
- $784 – $1,456
Heat risk 3/10 · Minor
- Hot days now (above 96°F)
- 7 days/yr
- Hot days in 30 yrs
- 15 days/yr
Wind risk 1/10 · Minimal
- Chance of severe wind over 30 yrs
- —
Air-quality risk 3/10 · Minor
- Unhealthy air days now
- 3 days/yr
- Unhealthy air days in 30 yrs
- 4 days/yr
Risk factors via First Street. Map © Google.
Why this score? — see what drove the C+ grade
The composite is a weighted blend of 9 inputs, each scored 0–100. Each bar is that input's sub-score; the figure is the points it added to the 100-point composite (weight × sub-score).
- Cash flow +26.9/30.0
- ARV discount +9.8/15.0
- DSCR +9.3/10.0
- 1% rule +6.9/10.0
- Livability +3.7/5.0
- Rent growth +3.2/5.0
- Condition / age +2.5/5.0
- Schools +1.0/10.0
- Appreciation +0.0/10.0
$114,900
🖨 Deal sheet 📄 Offer letter ✓ Due diligence
Listing remarks MLS
There is a dog living there and a family member may be at showings with the dog in the backyard.
Key facts
- 3,920 sq ft lot
- Garage
- Built 1971
Property features AI
Finance
- Other: Directions: Take Essex from main road; Cross street: Essex
- Financial info: Annual tax: $1,389.50
- HOA & community: Subdivision: DALBY & CAMPBELL VAN DYKE
Exterior
- Parking: Detached 1-car garage
- Security: Not specified
- Utilities: Public water; Public sewer
- Home design: Single-family residence; One level; Ground-level entry
- Construction: Aluminum siding; Slab foundation; Built area above grade: 946 (square feet)
- Exterior features: Paved road access
Interior
- Kitchen: Not specified
- Bedrooms: Not specified
- Flooring: Not specified
- Bathrooms: 1 full bathroom
- Heating & cooling: Forced air heating; Natural gas heating; No central cooling
- Interior features: 4 total rooms
- Laundry & utility: Not specified
Neighborhood map
What this means for you Summary
Snapshot
- This is a 3-bed/1.5-bath single-family listed at $115k.
Deal economics
- At list price, monthly cash flow is $317 ($4k/yr) — positive.
- The deal already cash-flows at list — no discount required.
- Meets the 1% rule at list price ($1k rent vs $115k).
- Recommended offer: $113k (1.5% below list) — sets the bar for market timing.
- Cap rate 9.6% vs local median 5.3% in Warren — top-decile yield for the area; either an underpriced asset or a hidden risk that comps aren't pricing in. Stress-test before assuming the spread holds.
Location & tenants
- Location reads 74/100 on livability (#171 in MI, #4,491 nationally) — a middle-class / working-renter tenant base. Strengths: commute A+, cost of living A+, housing A+; Watch: schools D, amenities D, employment D.
- Van Dyke Public Schools (urban): math 7% / reading 19% proficiency, ranked #512 of 540 in MI (top 95%) — low school quality limits family demand, transient renter base, plan for 1-2y turnover; 80% free/reduced lunch — lower-income household profile, screen leases tightly.
- Market conditions: Rents rising (+2.9%/yr); 160 active listings in the ZIP; 38 comparable units currently listed for rent nearby; rentals at typical pace (median 25d on market — plan ~3-4 weeks tenant-placement turnaround); 1,321 units permitted in Macomb County in 2024 (86 in 5+ unit buildings).
- This rent runs 31% of the median local income ($52k/yr) — at the standard rent-burdened threshold; future hikes will face affordability resistance.
Forward outlook
- Local home prices are declining (-3.0%/yr); year-one equity from $794 of loan paydown is wiped out by about $3k of value loss. Plan a longer hold.
- Macomb County population projected at +9% by 2050 — modest demand growth; plan on rents tracking national, not racing it.
- At projected returns (-3.0% appreciation + 2.9% rent growth), your $32k cash investment doubles in ~10 years — after that, you're playing with house money.
Negotiation context
- It's been on market 26 days — a 2% lower offer ($113k) is reasonable based on typical stale-listing flexibility.
- 5 sale attempts since 19y ago; this cycle's ask has dropped $15k (12%) from the opening price — seller is motivated, your offer sets the floor, not the list.
- Current owner paid $34k; list at $115k implies a 238% gain — meaningful room to come down on a strong offer.
Questions for the listing agent
- Built in 1971 — when were the roof, HVAC, electrical panel, plumbing, and water heater last replaced?
- Is there a deadline driving the sale (1031 exchange, divorce, estate, relocation)? That informs how much negotiation room exists.
- Schools are D-rated, which usually means shorter tenancies and higher turnover. Who's the typical renter profile here, and what's been the actual vacancy rate?
- Crime grade is D in this area — have there been break-ins, vandalism, or insurance claims at this property in the last 3 years? What carrier currently insures it and at what premium?
- What's the average days-on-market for RENTAL listings here right now (not sales)? A rising rental-DOM trend means longer vacancies and softer asking-rent achievability than the comps imply.
- What's the recent tenant-quality profile in this submarket — average credit score on applications, eviction rate, late-payment / NSF rate, and stable-employment percentage? A property-management company in the area should have these aggregated.
- How much new for-sale + rental construction is in the pipeline within 1–3 miles? Heavy new supply typically softens prices + rents 12–24 months out; constrained supply supports both.
Investment metrics
- 1% rule
- 1.19% ✓
- Cap rate
- 9.60%
- Cash-on-cash
- 11.81%
- DSCR
- 1.53
- GRM
- 7.0
CMA / ARV
- ARV (on-the-fly)
- $121,088
- Comps found
- 12
Show comp detail 12 sales within ~0.75 mi
| Address | Dist | Beds/Ba | Sqft | Sold | Price | $/sf | Match |
|---|---|---|---|---|---|---|---|
| 11108 Essex Ave | 0.00mi | 3/1.0 | 946 (0%) | 0mo | $114,900 | $121 | 98 |
| 8654 Continental Ave | 0.28mi | 3/1.0 | 1,008 (+7%) | 1mo | $103,000 | $102 | 73 |
| 8659 Essex Ave | 0.19mi | 3/1.0 | 1,034 (+9%) | 2mo | $150,000 | $145 | 72 |
| 11004 Republic Ave | 0.18mi | 2/1.0 (-1) | 868 (-8%) | 2mo | $94,000 | $108 | 69 |
| 8420 Republic Ave | 0.39mi | 3/1.0 | 1,015 (+7%) | 2mo | $150,000 | $148 | 66 |
| 8725 Packard Ave | 0.61mi | 3/1.0 | 925 (-2%) | 2mo | $135,000 | $146 | 64 |
| 8620 Stephens Rd | 0.28mi | 2/1.0 (-1) | 840 (-11%) | 1mo | $107,000 | $127 | 60 |
| 11276 Ocalla Dr | 0.23mi | 2/1.0 (-1) | 1,064 (+12%) | 2mo | $163,000 | $153 | 60 |
| 24344 Rosemarie Ave | 0.39mi | 3/1.0 | 1,064 (+12%) | 2mo | $148,000 | $139 | 58 |
| 11339 Ford Ave | 0.52mi | 4/1.5 (+1) | 1,015 (+7%) | 2mo | $130,000 | $128 | 57 |
| 11245 Hudson Ave | 0.65mi | 3/1.0 | 996 (+5%) | 2mo | $72,500 | $73 | 57 |
| 24894 Marigold Ave | 0.62mi | 3/1.0 | 888 (-6%) | 2mo | $105,000 | $118 | 57 |
Match score weights: distance 35% · size 25% · config 20% · recency 20%. Top-matched comps best support the ARV.
Projected returns pro-forma
-3.0% appreciation · 2.94% rent growth · sell at horizon
- IRR
- 1.2%
- Equity multiple
- 1.05×
- Total profit
- $1,468
- Equity at exit
- $17,132
- IRR
- 10.8%
- Equity multiple
- 1.84×
- Total profit
- $26,922
- Equity at exit
- $9,934
Cash invested: $32,172 (down + closing). Projections, not guarantees.
Landlord ↔ Tenant lean methodology
- Overall (STATE)
- 62 Landlord-Friendly
- State Michigan
- 62 Landlord-Friendly · EVEN
- County
- — inherits STATE
- City
- — inherits STATE
ZIP-level market 48089
- Rents YoY
- 2.9%
- Active inventory
- 160
- Price-to-rent
- 7.0×
Monthly cashflow live
- Estimated rent
- $1,371 high interval (Pro) →
- Mortgage (P&I)
- −$603
- Tax from tax record
- −$116 /mo · $1,390/yr
- Insurance
- −$48
- HOA
- −$0
- Vacancy / Maint / Mgmt
- −$288
- Net cashflow
- $317
Break-even live
UW: 25.0% down · 7.5% · 30yr · 1.5% tax · 5.0% vac · 8.0% maint · 8.0% mgmt
Financing live
Cash to close
- Down payment
- $28,725
- Closing costs
- $3,447
- Reserves months
- —
- Total cash needed
- —
Loan-product check · same deal, 3 products live
Conventional
25% down · 7.5% · 30yr
- Down + closing
- —
- Monthly P&I
- —
- Monthly cashflow
- —
- DSCR
- —
- Eligible?
- —
Personal DTI + credit; lowest rate.
DSCR
20% down · 8.5% · 30yr
- Down + closing
- —
- Monthly P&I
- —
- Monthly cashflow
- —
- DSCR
- —
- Eligible?
- —
No personal income docs; deal must DSCR.
Hard money
10% down · 12.0% · 12mo
- Down + closing
- —
- Monthly P&I
- —
- Monthly cashflow
- —
- DSCR
- —
- Eligible?
- —
Short-term bridge; refi at stabilization.
Rent comps 38 comps
| Address | Beds | Baths | Sqft | Rent | $/sqft | DOM | Units | Dist |
|---|---|---|---|---|---|---|---|---|
| 11076 Essex Ave Warren, MI | 4.0 | 1.0 | 1072 | $1,400 | $1.31 | 43d | 1 | 0.02mi |
| 8716 Timken Ave Warren, MI | 3.0 | 1.0 | 1008 | $1,400 | $1.39 | 24d | 1 | 0.13mi |
| 11130 Stephens Rd Warren, MI | 2.0 | 1.0 | 750 | $1,300 | $1.73 | 43d | 1 | 0.16mi |
| 8707 Continental Ave Warren, MI | 3.0 | 1.0 | 1100 | $1,200 | $1.09 | 5d | 1 | 0.24mi |
| 8707 Continental Ave Warren, MI | 3.0 | 1.0 | 968 | $1,200 | $1.24 | 18d | 1 | 0.24mi |
| 11331 Continental Ave Warren, MI | 2.0 | 1.0 | 765 | $1,250 | $1.63 | 24d | 1 | 0.25mi |
| 8636 Republic Ave Warren, MI | 2.0 | 1.0 | 800 | $1,250 | $1.56 | 14d | 1 | 0.26mi |
| 8693 Paige Ave Warren, MI | 3.0 | 1.0 | 900 | $1,300 | $1.44 | 24d | 1 | 0.29mi |
| 8428 Timken Ave Warren, MI | 3.0 | 1.0 | 860 | $1,250 | $1.45 | 24d | 1 | 0.35mi |
| 8509 Paige Ave Warren, MI | 3.0 | 1.0 | 950 | $1,300 | $1.37 | 24d | 1 | 0.37mi |
| 11359 Maxwell Ave Unit 11359 Warren, MI | 2.0 | 1.0 | 900 | $1,000 | $1.11 | 3d | 1 | 0.46mi |
| 8212 Timken Ave Warren, MI | 2.0 | 1.0 | 756 | $1,320 | $1.75 | 24d | 1 | 0.49mi |
| 8125 Timken Ave Warren, MI | 3.0 | 1.0 | 948 | $1,270 | $1.34 | 5d | 1 | 0.53mi |
| 11076 Hudson Ave Warren, MI | 3.0 | 1.0 | 936 | $1,395 | $1.49 | 3d | 1 | 0.69mi |
| 11236 Studebaker Ave Warren, MI | 2.0 | 1.0 | 672 | $1,175 | $1.75 | 43d | 1 | 0.74mi |
| 8632 Studebaker Ave Warren, MI | 3.0 | 1.0 | 761 | $1,300 | $1.71 | 3d | 1 | 0.77mi |
| 11319 Chalmers Ave Warren, MI | 3.0 | 1.0 | 975 | $1,500 | $1.54 | 24d | 1 | 0.78mi |
| 8251 Hudson Ave Warren, MI | 3.0 | 1.0 | 908 | $1,400 | $1.54 | 24d | 1 | 0.80mi |
| 8640 Chalmers Ave Warren, MI | 3.0 | 1.0 | 804 | $1,423 | $1.77 | 24d | 1 | 0.81mi |
| 11404 Warren Blvd Unit 102 Warren, MI | 2.0 | 1.0 | 900 | $1,250 | $1.39 | 24d | 1 | 0.84mi |
| 8036 Hupp Ave Warren, MI | 2.0 | 1.0 | 680 | $1,150 | $1.69 | 43d | 1 | 0.85mi |
| 25108 Hoover Rd Warren, MI | 1.0–2.0 | 1.0 | 702 | $1,324 | $1.88 | 2d | 65 | 0.88mi |
| 8162 Orchard Ave Warren, MI | 2.0 | 1.0 | 900 | $1,000 | $1.11 | 43d | 1 | 1.02mi |
| 25146 Wagner Ave Warren, MI | 3.0 | 1.0 | 906 | $1,900 | $2.10 | 24d | 1 | 1.07mi |
| 8065 Meadow Ave Warren, MI | 2.0 | 1.0 | 800 | $1,050 | $1.31 | 24d | 1 | 1.09mi |
| 7275 Chalmers Ave Warren, MI | 2.0 | 1.0 | 703 | $1,200 | $1.71 | 24d | 1 | 1.11mi |
| 11228 Sherman Ave Warren, MI | 2.0 | 1.0 | 1000 | $1,200 | $1.20 | 12d | 1 | 1.12mi |
| 7511 Toepfer Rd Warren, MI | 3.0 | 1.0 | 1032 | $1,199 | $1.16 | 22d | 1 | 1.13mi |
| 25005 Lawrence Ave Center Line, MI | 1.0–2.0 | 1.0–1.5 | 1000 | $955 | $0.95 | 43d | 1 | 1.16mi |
| 7043 Meadow Ave Warren, MI | 2.0 | 1.0 | 911 | $1,274 | $1.40 | 43d | 1 | 1.29mi |
| 22852 Sharrow Ave Warren, MI | 3.0 | 1.0 | 1000 | $1,400 | $1.40 | 5d | 1 | 1.30mi |
| 8242 Jackson Ave Warren, MI | 3.0 | 1.0 | 840 | $1,198 | $1.43 | 43d | 1 | 1.31mi |
| 8285 Rivard Ave Warren, MI | 3.0 | 1.0 | 902 | $1,549 | $1.72 | 24d | 1 | 1.32mi |
| 21412 Waltham Rd Warren, MI | 2.0 | 1.0 | 696 | $1,225 | $1.76 | 43d | 1 | 1.35mi |
| 7060 Victory Ave Warren, MI | 3.0 | 1.0 | 945 | $1,450 | $1.53 | 11d | 1 | 1.35mi |
| 7605 Jackson Ave Warren, MI | 2.0 | 1.0 | 600 | $1,165 | $1.94 | 24d | 1 | 1.38mi |
| 7033 Westminster Ave Warren, MI | 2.0 | 1.0 | 561 | $1,050 | $1.87 | 43d | 1 | 1.39mi |
| 13050 Couwlier Ave Warren, MI | 3.0 | 1.0 | 850 | $1,350 | $1.59 | 24d | 1 | 1.45mi |
Listing history 16 events
-
2026-04-29status Pending 96-char remark
Show marketing remark (96 chars)
There is a dog living there and a family member may be at showings with the dog in the backyard.
-
2026-04-29status Pending
Show marketing remark (96 chars)
There is a dog living there and a family member may be at showings with the dog in the backyard.
-
2026-04-27price $114,900 96-char remark
Show marketing remark (96 chars)
There is a dog living there and a family member may be at showings with the dog in the backyard.
-
2026-04-27price $114,900
Show marketing remark (96 chars)
There is a dog living there and a family member may be at showings with the dog in the backyard.
-
2026-04-04$130,000 Active 96-char remark
Show marketing remark (96 chars)
There is a dog living there and a family member may be at showings with the dog in the backyard.
-
2026-04-04$130,000 Active
Show marketing remark (96 chars)
There is a dog living there and a family member may be at showings with the dog in the backyard.
-
2026-04-02historical $130,000 96-char remark
Show marketing remark (96 chars)
There is a dog living there and a family member may be at showings with the dog in the backyard.
-
2016-06-14soldstatus $34,000
-
2016-02-25soldstatus $34,601
-
2008-09-15historical
-
2008-08-14historical
-
2008-06-02historical
-
2008-06-02$69,900
-
2008-06-02$69,900
-
2007-09-15$69,900
-
1993-05-17soldstatus $37,000
ⓘ Source: listings_history table (triggers on properties + properties_extension) + one-shot
backfill from property_details.listing_events for pre-trigger history.
Tax reassessment forecast MI · Partial reset (capped growth)
- Current annual tax
- $1,390 · $116/mo
- Projected year-2 tax
- $1,580 · $132/mo
- Expected delta
- +$190/yr (+$16/mo · 13.6%)
ⓘ Screening estimate from a state-policy table — verify with the county assessor before closing.
Climate risk First Street
- Flood 3/10 Moderate FEMA zone X (unshaded) · 20% chance over 30 yrs
- Wildfire 1/10 Low
- Heat 3/10 Moderate 7 d/yr ≥96°F today · 15 d/yr by 30 yrs out
- Wind 1/10 Low
- Air quality 3/10 Moderate 3 unhealthy d/yr today · 4 by 30 yrs out
Nearby sold comps map
Loading sold comps map…
Walkable amenities ~0.75 mi
Loading nearby amenities…
Taxation est. · year 1
- Rental income
- $16,449
- − Mortgage interest
- −$6,436
- − Property taxes
- −$1,390
- − Insurance
- −$574
- − Repairs & maintenance
- −$1,316
- − Management
- −$1,316
- − Depreciation
- −$3,343
- Taxable income
- $2,074
- Est. tax owed @ 24.0%
- −$498
- After-tax cash flow
- $3,302/yr
For passive investors: Depreciation is non-cash, so a rental often shows a tax loss while cash-flowing — sheltering income. Rental losses are passive: they offset passive income freely, and up to $25,000/yr can offset ordinary (W-2) income if you actively participate and your MAGI is under $100k (phasing out to $0 by $150k); unused losses carry forward. On sale, claimed depreciation is recaptured at up to 25%, and gains may owe capital-gains tax (a 1031 exchange can defer both). Figures are a year-1 estimate at your 24.0% rate — not tax advice; consult a CPA.
Schools (NCES district)
- District
- Van Dyke Public Schools
- NCES district ID
- 2634680
- Math proficiency
- 7% ▼ -11.00%
- Reading proficiency
- 19% ▼ -5.00%
- Median HH income
- $33,231
- Composite
- 10.46/100
- National rank
- #9784
- State rank
- #512 of 540 in MI
Livability — Warren
- Score
- 74/100
- State rank
- #171
- US rank
- #4491
Category grades
Schools grade is shown separately in the Schools card above.
Census & demographics
- Census place
- Warren, MI
- County
- Macomb County · 638,552 people
- City population
- 114,937
- Metro
- Detroit-Warren-Dearborn, MI
- Population (ZIP)
- 31,853
- Household income
- $52,366
- Rent vs Own
- Severe rent burden
- 1754.0
Population outlook (Macomb County) Hauer SSP2
- Today (2025)
- 925,296 people
- By 2030
- 948,226 · +2.5%
- By 2040
- 983,961 · +6.3%
- By 2050
- 1,010,200 · +9.2%
- By 2075
- 1,076,222 · +16.3%
- By 2100
- 1,077,065 · +16.4%
Race, ethnicity, and origin ACS 2023
- Neighborhood character
- Diverse neighborhood (Simpson 0.61)
- Race & ethnicity
- White 53% Black 31% Asian 7% Two or more races 6% Hispanic / Latino 3%
- Common ancestry
- Romanian 11% Lithuanian 3% Slovak 2%
- Foreign-born
- 5% · Canada
- Languages at home
- 92% English-only · Other Asian/Pacific 3% Other Indo-European 2% Arabic 1%
Political lean MEDSL · Macomb
- 2024 margin
- R (+13.7) · D 42.2% · R 55.9% · Other 1.9%
- 2008→2024 swing
- -22.3pp toward R · 2008: 8.6pp · 2024: -13.7pp
- All cycles
- 2024: R+13.7 2020: R+8.1 2016: R+11.6 2012: D+4.0 2008: D+8.6
Not yet ingested
- Civics
- —
Market trends
- HPI YoY
- ▼ -211.46%
- Current HPI
- 154.8325
- Rent YoY
- ▲ 2.94%
- Metro
- Detroit-Warren-Dearborn, MI
- State GDP YoY
- ▲ 1.37%
- F500 in state
- 28
Industry mix (Fortune 500 HQ in MI)
| Industry | F500 HQs | Revenue |
|---|---|---|
| Automotive Parts | 3 | $48B |
|
||
| Automotive | 2 | $372B |
|
||
| Chemicals | 1 | $45B |
|
||
| Automotive Retail | 1 | $29B |
|
||
| Healthcare / Medical Devices | 1 | $23B |
|
||
| Automotive Technology | 1 | $20B |
|
||
Price history
+210.5% since first listed16 events — show timeline
- 2026-04-29 Pending — MiRealSource-MiMLS
- 2026-04-29 Pending — REALCOMP
- 2026-04-27 Price Changed $114,900 MiRealSource-MiMLS
- 2026-04-27 Price Changed $114,900 REALCOMP
- 2026-04-04 Listed $130,000 MiRealSource-MiMLS
- 2026-04-04 Listed $130,000 REALCOMP
- 2026-04-02 Coming Soon $130,000 MiRealSource-MiMLS
- 2016-06-14 Sold (Public Records) $34,000 Public Records
- 2016-02-25 Sold (Public Records) $34,601 Public Records
- 2008-09-15 Listing Removed — REALCOMP
- 2008-08-14 Listing Removed — MiRealSource-MiMLS
- 2008-06-02 Listed $69,900 REALCOMP
- 2008-06-02 Listed $69,900 MiRealSource-MiMLS
- 2008-06-02 Listing Removed — MiRealSource-MiMLS
- 2007-09-15 Listed $69,900 MiRealSource-MiMLS
- 1993-05-17 Sold (Public Records) $37,000 Public Records
Property tax history
+0.6%/yrLatest (2025): $1,390 · +2.5% YoY. Source: county tax records.
Cash-flow waterfall
monthlySold comps — $/sqft
last 12 mo · ≤1 miLoading sold comps…