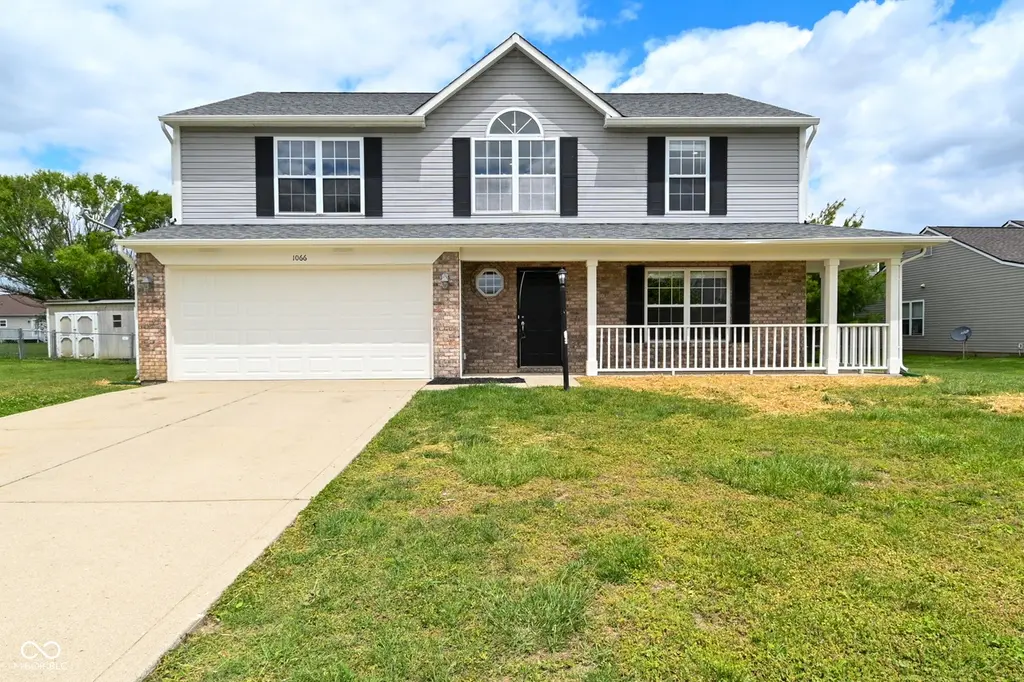
1066 Quarterhorse Run · Bargersville, IN
Flood risk 1/10 · Minimal
- FEMA flood zone
- X (unshaded)
- Chance of flooding over 30 yrs
- 0.0%
- Est. flood insurance / yr
- $507 – $1,088
Fire risk 1/10 · Minimal
- Est. fire insurance / yr
- $717 – $1,331
Heat risk 4/10 · Minor
- Hot days now (above 101°F)
- 7 days/yr
- Hot days in 30 yrs
- 19 days/yr
Wind risk 2/10 · Minimal
- Chance of severe wind over 30 yrs
- 1.0%
Air-quality risk 2/10 · Minimal
- Unhealthy air days now
- 1 days/yr
- Unhealthy air days in 30 yrs
- 1 days/yr
Risk factors via First Street. Map © Google.
Why this score? — see what drove the D- grade
The composite is a weighted blend of 9 inputs, each scored 0–100. Each bar is that input's sub-score; the figure is the points it added to the 100-point composite (weight × sub-score).
- ARV discount +15.0/15.0
- Cash flow +8.4/30.0
- Schools +3.5/10.0
- Livability +3.5/5.0
- Rent growth +2.5/5.0
- Condition / age +2.5/5.0
- DSCR +2.3/10.0
- 1% rule +2.2/10.0
- Appreciation +0.0/10.0
$309,900
🖨 Deal sheet 📄 Offer letter ✓ Due diligence
Listing remarks MLS
Pride of ownership in this 4 bedroom 2.5 bath home in popular Country Meadows Subdivision. Beautiful kitchen which opens up to the breakfast nook and family room. Stainless Steel Appliances in the kitchen stay with the home. Large Master Bedroom with vaulted ceilings and master bath with Garden Tub. Relax on your outside patio with a great view of the water.
Key facts
- Open concept kitchen
- Large lot
- Pantry for storage
Tags
Property features AI
Finance
- HOA & community: Not a low-maintenance lifestyle community
Exterior
- Parking: Attached 2-car garage with automatic garage door opener
- Utilities: Public water; Municipal sewer connected; No solid waste service listed
- Home design: Single-family residence; Two levels
- Construction: Vinyl with brick exterior; Slab foundation
- Exterior features: Covered patio; Patio; On waterfront (pond)
Interior
- Kitchen: Dishwasher; Disposal; Microwave with hood; Electric oven; Refrigerator; Eat-in kitchen layout
- Bedrooms: Primary bedroom with walk-in closet; Four bedrooms on the upper level
- Bathrooms: Two full bathrooms; One half bathroom; Primary bathroom with full shower stall
- Heating & cooling: Forced air heating (natural gas); Central air conditioning
- Interior features: Attic access; Cathedral ceilings; Eat-in kitchen; Walk-in closets
- Laundry & utility: Laundry on upper level
Neighborhood map
What this means for you Summary
Snapshot
- This is a 3-bed/2.5-bath single-family listed at $310k.
Deal economics
- At list price, monthly cash flow is $-275 ($-3k/yr) — negative.
- To cash-flow at today's rent, offer at most $261k (15.7% below list).
- To meet the 1% rule (rent ≥ 1% of price), the offer needs to be $222k (28.4% below list).
- Recommended offer: $222k (28.4% below list) — sets the bar for 1% rule.
Location & tenants
- Location reads 70/100 on livability (#150 in IN) — a middle-class / working-renter tenant base. Strengths: crime A+, housing A+, employment A; Watch: amenities F, commute F, health & safety F.
- Franklin Community School Corporation (suburban): math 36% / reading 44% proficiency, ranked #133 of 301 in IN (top 44%) — families likely to look elsewhere, expect single-tenant / working-renter base with shorter leases.
- Zoned schools: Union Elementary School (math 74% / reading 74%, grade A, #17 of 994 statewide, top 2%, 164 students, 32% FRL); Franklin Community High School (math 29% / reading 69%, grade D, #136 of 369 statewide, top 37%, 1,610 students, 41% FRL) — zoned schools at 37% FRL track the district average.
- Zoned-school proficiency averages 62% at this address vs 40% district-wide (+22 pts) — the actual schools serving this property are materially stronger than the Franklin Community School Corporation average implies; a family-tenant draw the district grade alone would hide.
- Market conditions: 16 active listings in the ZIP; high-income renter base; 1,133 units permitted in Johnson County in 2024 (0 in 5+ unit buildings).
Forward outlook
- Local home prices are declining (-3.0%/yr); year-one equity from $2k of loan paydown is wiped out by about $9k of value loss. Plan a longer hold.
- Johnson County population projected at +26% by 2050 — long-run rental-demand tailwind backs the buy-and-hold thesis.
Negotiation context
- It's been on market 28 days — a 2% lower offer ($305k) is reasonable based on typical stale-listing flexibility.
- 2 sale attempts since 13y ago with the ask held roughly flat each time — persistent listings suggest the price (not the market) is what's stuck; bring a comps-based counter.
- Current owner paid $133k; list at $310k implies a 133% gain — meaningful room to come down on a strong offer.
Questions for the listing agent
- What do current leases actually rent for vs. the listed asking? Can we see a recent rent roll and the last 12 months of T-12 income?
- Is there a deadline driving the sale (1031 exchange, divorce, estate, relocation)? That informs how much negotiation room exists.
- Schools are B-rated — typically a magnet for longer-tenancy family renters. What's the average tenant stay here, and is there a school-zone premium baked into asking?
- The area grade is low — what's the realistic commute time and amenity access for the typical tenant pool here? Any planned neighborhood developments (good or bad) we should know about?
- What's the average days-on-market for RENTAL listings here right now (not sales)? A rising rental-DOM trend means longer vacancies and softer asking-rent achievability than the comps imply.
- What's the recent tenant-quality profile in this submarket — average credit score on applications, eviction rate, late-payment / NSF rate, and stable-employment percentage? A property-management company in the area should have these aggregated.
- How much new for-sale + rental construction is in the pipeline within 1–3 miles? Heavy new supply typically softens prices + rents 12–24 months out; constrained supply supports both.
Investment metrics
- 1% rule
- 0.72% ✗
- Cap rate
- 5.23%
- Cash-on-cash
- -3.81%
- DSCR
- 0.83
- GRM
- 11.6
CMA / ARV
- ARV (median comp)
- $405,908
- List price
- $309,900
- Delta
- -23.65%
- Verdict
- UNDERPRICED
- Comps
- 17 within 1.0 mi
Show comp detail 8 sales within ~0.75 mi
| Address | Dist | Beds/Ba | Sqft | Sold | Price | $/sf | Match |
|---|---|---|---|---|---|---|---|
| 1023 Quarterhorse Run | 0.05mi | 3/2.5 | 2,056 (-7%) | 1mo | $307,000 | $149 | 85 |
| 1026 W Palomino Pl | 0.13mi | 4/2.5 (+1) | 2,232 (+1%) | 14mo | $335,000 | $150 | 76 |
| 2090 Partridge Dr | 0.45mi | 3/2.0 | 2,196 (-1%) | 6mo | $338,500 | $154 | 70 |
| 739 Quarterhorse Run | 0.31mi | 4/2.5 (+1) | 2,200 (-0%) | 15mo | $321,000 | $146 | 67 |
| 2150 Partridge Dr | 0.39mi | 4/3.5 (+1) | 2,122 (-4%) | 6mo | $372,000 | $175 | 61 |
| 2648 W State Road 144 | 0.47mi | 4/3.0 (+1) | 2,122 (-4%) | 5mo | $465,000 | $219 | 60 |
| 901 Palomino Pl | 0.18mi | 3/2.0 | 1,907 (-14%) | 12mo | $320,000 | $168 | 56 |
| 2054 Partridge Dr | 0.47mi | 3/3.0 | 2,534 (+15%) | 13mo | $412,500 | $163 | 42 |
Match score weights: distance 35% · size 25% · config 20% · recency 20%. Top-matched comps best support the ARV.
Projected returns pro-forma
-3.0% appreciation · 3.0% rent growth · sell at horizon
- IRR
- -22.7%
- Equity multiple
- 0.22×
- Total profit
- $-67,789
- Equity at exit
- $46,207
- IRR
- -17.1%
- Equity multiple
- 0.06×
- Total profit
- $-81,757
- Equity at exit
- $26,794
Cash invested: $86,772 (down + closing). Projections, not guarantees.
Landlord ↔ Tenant lean methodology
- Overall (STATE)
- 90 Strongly Landlord-Friendly
- State Indiana
- 90 Strongly Landlord-Friendly · R+11
- County
- — inherits STATE
- City
- — inherits STATE
ZIP-level market 46106
- Home prices YoY
- -32.9%
- Active inventory
- 16
- Price-to-rent
- 11.6×
Monthly cashflow live
- Estimated rent
- $2,218 medium interval (Pro) →
- Mortgage (P&I)
- −$1,625
- Tax from tax record
- −$273 /mo · $3,279/yr
- Insurance
- −$129
- HOA
- −$0
- Vacancy / Maint / Mgmt
- −$466
- Net cashflow
- $-275
Break-even live
UW: 25.0% down · 7.5% · 30yr · 1.5% tax · 5.0% vac · 8.0% maint · 8.0% mgmt
Financing live
Cash to close
- Down payment
- $77,475
- Closing costs
- $9,297
- Reserves months
- —
- Total cash needed
- —
Loan-product check · same deal, 3 products live
Conventional
25% down · 7.5% · 30yr
- Down + closing
- —
- Monthly P&I
- —
- Monthly cashflow
- —
- DSCR
- —
- Eligible?
- —
Personal DTI + credit; lowest rate.
DSCR
20% down · 8.5% · 30yr
- Down + closing
- —
- Monthly P&I
- —
- Monthly cashflow
- —
- DSCR
- —
- Eligible?
- —
No personal income docs; deal must DSCR.
Hard money
10% down · 12.0% · 12mo
- Down + closing
- —
- Monthly P&I
- —
- Monthly cashflow
- —
- DSCR
- —
- Eligible?
- —
Short-term bridge; refi at stabilization.
Listing history 12 events
-
2026-06-10status $309,900 Pending 28 DOM
-
2026-06-09days on market $309,900 Active 28 DOM
-
2026-06-08days on market $309,900 Active 27 DOM
-
2026-06-07pricedays on market $309,900 Active 26 DOM
-
2026-06-03days on market $314,900 Active 22 DOM
-
2026-06-02days on market $314,900 Active 21 DOM
-
2026-06-01days on market $314,900 Active 20 DOM
-
2026-05-31days on market $314,900 Active 19 DOM
-
2026-05-12$314,900 Active 927-char remark
-
2013-06-29historical 365-char remark
Show marketing remark (365 chars)
Pride of ownership in this 4 bedroom 2.5 bath home in popular Country Meadows Subdivision. Beautiful kitchen which opens up to the breakfast nook and family room. Stainless Steel Appliances in the kitchen stay with the home. Large Master Bedroom with vaulted ceilings and master bath with Garden Tub. Relax on your outside patio with a great view of the water.
-
2013-06-25soldstatus $133,000 365-char remark
Show marketing remark (365 chars)
Pride of ownership in this 4 bedroom 2.5 bath home in popular Country Meadows Subdivision. Beautiful kitchen which opens up to the breakfast nook and family room. Stainless Steel Appliances in the kitchen stay with the home. Large Master Bedroom with vaulted ceilings and master bath with Garden Tub. Relax on your outside patio with a great view of the water.
-
2013-04-19$144,900 365-char remark
Show marketing remark (365 chars)
Pride of ownership in this 4 bedroom 2.5 bath home in popular Country Meadows Subdivision. Beautiful kitchen which opens up to the breakfast nook and family room. Stainless Steel Appliances in the kitchen stay with the home. Large Master Bedroom with vaulted ceilings and master bath with Garden Tub. Relax on your outside patio with a great view of the water.
ⓘ Source: listings_history table (triggers on properties + properties_extension) + one-shot
backfill from property_details.listing_events for pre-trigger history.
Tax reassessment forecast IN · Partial reset (capped growth)
- Current annual tax
- $3,279 · $273/mo
- Projected year-2 tax
- $3,279 · $273/mo
- Expected delta
- $0/yr ($0/mo · -0.0%)
ⓘ Screening estimate from a state-policy table — verify with the county assessor before closing.
Climate risk First Street
- Flood 1/10 Low FEMA zone X (unshaded) · 0% chance over 30 yrs
- Wildfire 1/10 Low
- Heat 4/10 Moderate 7 d/yr ≥101°F today · 19 d/yr by 30 yrs out
- Wind 2/10 Low 100% chance of damaging wind over 30 yrs
- Air quality 2/10 Low 1 unhealthy d/yr today · 1 by 30 yrs out
Nearby sold comps map
Loading sold comps map…
Walkable amenities ~0.75 mi
Loading nearby amenities…
Taxation est. · year 1
- Rental income
- $26,616
- − Mortgage interest
- −$17,359
- − Property taxes
- −$3,279
- − Insurance
- −$1,550
- − Repairs & maintenance
- −$2,129
- − Management
- −$2,129
- − Depreciation
- −$9,015
- Taxable loss
- −$8,846
- Est. tax savings @ 24.0%
- +$2,123
- After-tax cash flow
- $-1,181/yr
For passive investors: Depreciation is non-cash, so a rental often shows a tax loss while cash-flowing — sheltering income. Rental losses are passive: they offset passive income freely, and up to $25,000/yr can offset ordinary (W-2) income if you actively participate and your MAGI is under $100k (phasing out to $0 by $150k); unused losses carry forward. On sale, claimed depreciation is recaptured at up to 25%, and gains may owe capital-gains tax (a 1031 exchange can defer both). Figures are a year-1 estimate at your 24.0% rate — not tax advice; consult a CPA.
Schools (NCES district)
- District
- Franklin Community School Corporation
- NCES district ID
- 1803690
- Math proficiency
- 36% ▼ -11.00%
- Reading proficiency
- 44% ▼ -8.00%
- Median HH income
- $54,855
- Composite
- 34.93/100
- National rank
- #5066
- State rank
- #133 of 301 in IN
Livability — Bargersville
- Score
- 70/100
- State rank
- #150
- US rank
- #7573
Category grades
Schools grade is shown separately in the Schools card above.
Census & demographics
- Census place
- Bargersville, IN
- County
- Johnson County · 154,261 people
- City population
- 10,159
- Metro
- Indianapolis-Carmel-Anderson, IN
- Population (ZIP)
- 10,159
- Household income
- $120,072
- Rent vs Own
- Severe rent burden
- 335.0
Population outlook (Johnson County) Hauer SSP2
- Today (2025)
- 170,080 people
- By 2030
- 179,983 · +5.8%
- By 2040
- 198,580 · +16.8%
- By 2050
- 214,661 · +26.2%
- By 2075
- 247,990 · +45.8%
- By 2100
- 257,821 · +51.6%
Race, ethnicity, and origin ACS 2023
- Neighborhood character
- Predominantly White (91%)
- Race & ethnicity
- White 91% Two or more races 4% Asian 3% Black 1% Hispanic / Latino 1%
- Common ancestry
- Iranian 10% Romanian 3% Portuguese 2%
- Foreign-born
- 4% · Canada
- Languages at home
- 95% English-only · Other Indo-European 2% Spanish 1% Other Asian/Pacific 1%
Political lean MEDSL · Johnson
- 2024 margin
- Solid R (+34.3) · D 32.0% · R 66.3% · Other 1.7%
- 2008→2024 swing
- -8.9pp toward R · 2008: -25.5pp · 2024: -34.3pp
- All cycles
- 2024: R+34.3 2020: R+34.1 2016: R+42.5 2012: R+38.5 2008: R+25.5
Not yet ingested
- Civics
- —
Market trends
- HPI YoY
- ▼ -107.10%
- Current HPI
- 218.0302
- Rent YoY
- —
- Metro
- Indianapolis-Carmel-Anderson, IN
- State GDP YoY
- ▲ 2.90%
- F500 in state
- 18
Industry mix (Fortune 500 HQ in IN)
| Industry | F500 HQs | Revenue |
|---|---|---|
| Industrial Machinery | 2 | $37B |
|
||
| Healthcare | 1 | $177B |
|
||
| Pharmaceuticals | 1 | $45B |
|
||
| Metals / Steel | 1 | $18B |
|
||
| Agriculture | 1 | $17B |
|
||
| Packaging | 1 | $12B |
|
||
Price history
+113.9% since first listed6 events — show timeline
- 2026-06-09 Pending — MIBOR as Distributed by MLS Grid
- 2026-06-03 Price Changed $309,900 MIBOR as Distributed by MLS Grid
- 2026-05-12 Listed $314,900 MIBOR as Distributed by MLS Grid
- 2013-06-29 Listing Removed — MIBOR as Distributed by MLS Grid
- 2013-06-25 Sold (MLS) $133,000 MIBOR as Distributed by MLS Grid
- 2013-04-19 Listed $144,900 MIBOR as Distributed by MLS Grid
Property tax history
+8.7%/yrLatest (2024): $3,279 · -0.6% YoY. Source: county tax records.
Cash-flow waterfall
monthlySold comps — $/sqft
last 12 mo · ≤1 miLoading sold comps…