 Duplex
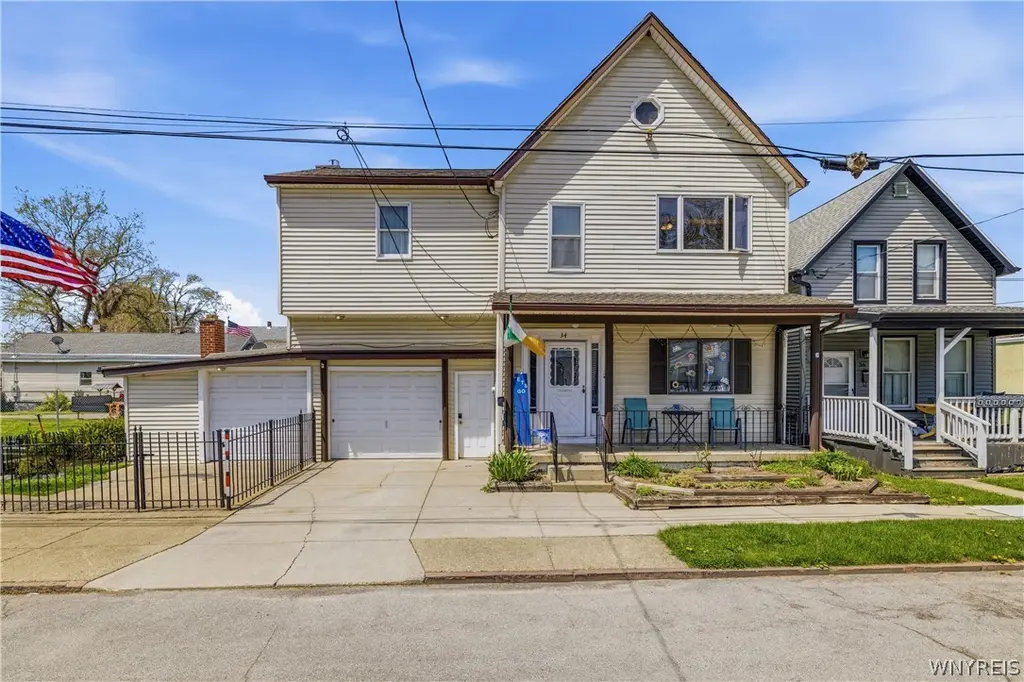
34 Alabama St · Buffalo, NY
Flood risk 7/10 · Major
- FEMA flood zone
- AE
- Chance of flooding over 30 yrs
- 0.95%
- Est. flood insurance / yr
- $1,737 – $8,500
Fire risk 1/10 · Minimal
- Est. fire insurance / yr
- $691 – $1,283
Heat risk 3/10 · Minor
- Hot days now (above 91°F)
- 7 days/yr
- Hot days in 30 yrs
- 15 days/yr
Wind risk 1/10 · Minimal
- Chance of severe wind over 30 yrs
- —
Air-quality risk 4/10 · Minor
- Unhealthy air days now
- 4 days/yr
- Unhealthy air days in 30 yrs
- 9 days/yr
Risk factors via First Street. Map © Google.
Why this score? — see what drove the B grade
The composite is a weighted blend of 9 inputs, each scored 0–100. Each bar is that input's sub-score; the figure is the points it added to the 100-point composite (weight × sub-score).
- Cash flow +30.0/30.0
- 1% rule +10.0/10.0
- DSCR +10.0/10.0
- ARV discount +7.0/15.0
- Rent growth +3.9/5.0
- Livability +3.9/5.0
- Appreciation +3.3/10.0
- Schools +3.3/10.0
- Condition / age +2.5/5.0
$269,900
🖨 Deal sheet 📄 Offer letter ✓ Due diligence
Multi-family units
County records classify this as Multi-Family (2-4 Unit). Listing-text estimate: 2 units. confirmed
Listing remarks
Welcome to 34 Alabama Street in the heart of Buffalo’s historic Old First Ward, a rare opportunity to own a well-maintained 2-family property with an additional large buildable corner lot offering endless future potential! Ideally situated at the corner of South Street and Alabama Street, this property combines owner-occupant comfort, investment versatility, and an unbeatable location just minutes from Downtown Buffalo, the Buffalo River, and the rapidly developing waterfront district. The spacious first-floor unit features 3 bedrooms and 2 full bathrooms, some newer major mechanics, newer carpeting throughout all bedrooms, and the convenience of in-unit laundry. The upper unit also o
Key facts
- In-unit laundry
- 2,614 sq ft lot
- 2 garage spots
Tags
Property features AI
Finance
- Financial info: Two separate electric meters; Two separate gas meters; Two total units (both month-to-month); Operating expenses include insurance, structure maintenance, general maintenance, and water; Owner pays water / rent includes water; Each unit currently showing $1,000 actual rent
Exterior
- Parking: Two-car garage; Concrete parking; One additional parking space
- Utilities: Public water connected; Sewer connected
- Home design: Two-story building; Resale property; Main thoroughfare frontage; Corner, rectangular lot (approximately 147 x 25)
- Construction: Shingle roof; Aluminum siding; Vinyl siding; Crawl space foundation; Existing (previously built)
- Exterior features: Fully fenced yard; Covered porch
Interior
- Kitchen: Eat-in kitchen(s); Dining area with kitchen
- Bedrooms: Two 3-bedroom units (each unit has 3 bedrooms)
- Flooring: Carpet; Hardwood; Laminate; Varies
- Bathrooms: One full bathroom in Unit 1; Two full bathrooms in Unit 2; Three full bathrooms total
- Heating & cooling: Gas heating; Baseboard heating; Forced air heating; Hot water heating; Wall cooling units
- Interior features: Skylights
- Laundry & utility: Laundry in unit (both units); Washer and dryer included in Unit 2; Gas water heater
Neighborhood map
What this means for you Summary
Snapshot
- This is a 2 × 3-bed/1.5-bath units multifamily listed at $270k.
Deal economics
- At list price, monthly cash flow is $2k ($21k/yr) — positive. Per door: $876/mo.
- The deal already cash-flows at list — no discount required.
- Meets the 1% rule at list price ($5k rent vs $270k).
- Recommended offer: $262k (3.0% below list) — sets the bar for market timing.
- Cap rate 16.0% vs local median 8.0% in Buffalo — top-decile yield for the area; either an underpriced asset or a hidden risk that comps aren't pricing in. Stress-test before assuming the spread holds.
Location & tenants
- Location reads 77/100 on livability (#195 in NY, #3,011 nationally) — a middle-class / working-renter tenant base. Strengths: commute A+, housing A+, health & safety A+; Watch: crime F, employment D-.
- Buffalo City School District (urban): math 41% / reading 40% proficiency, ranked #535 of 590 in NY (top 91%) — families likely to look elsewhere, expect single-tenant / working-renter base with shorter leases; 75% free/reduced lunch — lower-income household profile, screen leases tightly.
- Market conditions: Rents rising fast (+5.5%/yr); 33 active listings in the ZIP; lower-income renter base — watch delinquency; 1,244 units permitted in Erie County in 2024 (563 in 5+ unit buildings).
- At $4,757/mo this rent would consume 203% of the median local household income ($28k/yr) (locally 945% of renters already pay >50% of income on rent) — very limited rent-growth headroom before tenants either downsize or default.
Forward outlook
- Local home prices are declining (-3.0%/yr); year-one equity from $2k of loan paydown is wiped out by about $8k of value loss. Plan a longer hold.
- At projected returns (-3.0% appreciation + 5.5% rent growth), your $76k cash investment doubles in ~4 years — after that, you're playing with house money.
Negotiation context
- It's been on market 41 days — a 3% lower offer ($262k) is reasonable based on typical stale-listing flexibility.
- Current owner paid $58k; list at $270k implies a 369% gain — meaningful room to come down on a strong offer.
Risks & watch-outs
- Watch-outs: flood insurance adds $427/mo; built in 1900 — expect roof / HVAC / electrical / plumbing capex.
- Climate carrying-cost: in FEMA flood zone AE (mandatory federal flood insurance) — expect insurance premiums to compound above CPI over the hold.
Questions for the listing agent
- It's been on market 41 days. Have you received any prior offers? Is the seller open to a 3% concession, seller financing, or rate buy-down credit?
- Can we see the unit-by-unit rent roll, current vacancy, and any below-market leases? What's the average tenancy length?
- What capital expenditures (roof, boiler, parking lot, exteriors) have been made in the last 5 years, and what's planned in the next 2?
- Built in 1900 — when were the roof, HVAC, electrical panel, plumbing, and water heater last replaced?
- What's the actual annual flood-insurance premium (NFIP or private), and is the property in a SFHA with mandatory coverage?
- Is there a deadline driving the sale (1031 exchange, divorce, estate, relocation)? That informs how much negotiation room exists.
- Crime grade is F in this area — have there been break-ins, vandalism, or insurance claims at this property in the last 3 years? What carrier currently insures it and at what premium?
- What's the average days-on-market for RENTAL listings here right now (not sales)? A rising rental-DOM trend means longer vacancies and softer asking-rent achievability than the comps imply.
- What's the recent tenant-quality profile in this submarket — average credit score on applications, eviction rate, late-payment / NSF rate, and stable-employment percentage? A property-management company in the area should have these aggregated.
- How much new apartment / multifamily construction is in the pipeline within 1–3 miles? Heavy new supply (>2% of stock underway) typically softens rents 12–24 months out; light construction supports rent growth.
Investment metrics
- 1% rule
- 1.76% ✓
- Cap rate
- 15.98%
- Cash-on-cash
- 34.59%
- DSCR
- 2.54
- GRM
- 4.7
CMA / ARV
- ARV (median comp)
- $267,044
- List price
- $269,900
- Delta
- 1.07%
- Verdict
- FAIR
- Comps
- 20 within 1.0 mi
Show comp detail 9 sales within ~0.75 mi
| Address | Dist | Beds/Ba | Sqft | Sold | Price | $/sf | Match |
|---|---|---|---|---|---|---|---|
| 155 O'connell Ave | 0.21mi | 6/3.0 | 2,688 (+1%) | 6mo | $117,500 | $44 | 80 |
| 264 Miami St | 0.38mi | 6/2.0 | 2,688 (+1%) | 4mo | $285,000 | $106 | 78 |
| 86 Hamburg St | 0.17mi | 6/2.0 | 2,760 (+3%) | 15mo | $85,000 | $31 | 74 |
| 81 Hamburg St | 0.19mi | 6/2.0 | 2,400 (-10%) | 5mo | $125,000 | $52 | 70 |
| 91 Oconnell Ave | 0.18mi | 6/2.0 | 2,480 (-7%) | 16mo | $115,000 | $46 | 66 |
| 47 Oconnell Ave | 0.21mi | 7/2.0 (+1) | 2,552 (-4%) | 17mo | $85,000 | $33 | 63 |
| 134 Hamburg St | 0.25mi | 6/2.0 | 2,336 (-12%) | 7mo | $85,000 | $36 | 62 |
| 268 Miami St | 0.38mi | 6/2.0 | 2,920 (+9%) | 9mo | $240,000 | $82 | 59 |
| 145 Oconnell Ave | 0.20mi | 5/2.0 (-1) | 2,398 (-10%) | 19mo | $230,000 | $96 | 53 |
Match score weights: distance 35% · size 25% · config 20% · recency 20%. Top-matched comps best support the ARV.
Projected returns pro-forma
-3.0% appreciation · 5.48% rent growth · sell at horizon
- IRR
- 24.9%
- Equity multiple
- 2.06×
- Total profit
- $80,167
- Equity at exit
- $40,243
- IRR
- 34.2%
- Equity multiple
- 4.53×
- Total profit
- $266,645
- Equity at exit
- $23,336
Cash invested: $75,572 (down + closing). Projections, not guarantees.
Landlord ↔ Tenant lean methodology
- Overall (STATE)
- 15 Strongly Tenant-Friendly
- State New York
- 15 Strongly Tenant-Friendly · D+10
- County
- — inherits STATE
- City
- — inherits STATE
ZIP-level market 14204
- Home prices YoY
- -1.1%
- Rents YoY
- 5.5%
- Active inventory
- 33
- Price-to-rent
- 9.5×
Monthly cashflow live
- Estimated rent
- $4,757 high interval (Pro) →
- Mortgage (P&I)
- −$1,415
- Tax from tax record
- −$52 /mo · $621/yr
- Insurance
- −$112
- Flood insurance flood zone
- −$427 /mo · $5,118/yr
- HOA
- −$0
- Vacancy / Maint / Mgmt
- −$999
- Net cashflow
- $1,752
Break-even live
2-unit breakdown (identical units grouped — click to expand)
| Units | Beds | Baths | Est. rent |
|---|---|---|---|
| 2× units | 3 | 1.5 | $4,756 |
| #1 | 3 | 1.5 | $2,378 |
| #2 | 3 | 1.5 | $2,378 |
| Total (2 units) | $4,757 | ||
UW: 25.0% down · 7.5% · 30yr · 1.5% tax · 5.0% vac · 8.0% maint · 8.0% mgmt
Financing live
Cash to close
- Down payment
- $67,475
- Closing costs
- $8,097
- Reserves months
- —
- Total cash needed
- —
Loan-product check · same deal, 3 products live
Conventional
25% down · 7.5% · 30yr
- Down + closing
- —
- Monthly P&I
- —
- Monthly cashflow
- —
- DSCR
- —
- Eligible?
- —
Personal DTI + credit; lowest rate.
DSCR
20% down · 8.5% · 30yr
- Down + closing
- —
- Monthly P&I
- —
- Monthly cashflow
- —
- DSCR
- —
- Eligible?
- —
No personal income docs; deal must DSCR.
Hard money
10% down · 12.0% · 12mo
- Down + closing
- —
- Monthly P&I
- —
- Monthly cashflow
- —
- DSCR
- —
- Eligible?
- —
Short-term bridge; refi at stabilization.
Listing history 17 events
-
2026-06-18days on market $269,900 Active 41 DOM
-
2026-06-17days on market $269,900 Active 40 DOM
-
2026-06-16pricedays on market $269,900 Active 39 DOM
-
2026-06-15days on market $274,900 Active 38 DOM
-
2026-06-13days on market $274,900 Active 36 DOM
-
2026-06-13days on market $274,900 Active 35 DOM
-
2026-06-10days on market $274,900 Active 33 DOM
-
2026-06-09days on market $274,900 Active 32 DOM
-
2026-06-08days on market $274,900 Active 31 DOM
-
2026-06-07days on market $274,900 Active 30 DOM
-
2026-06-03days on market $274,900 Active 26 DOM
-
2026-06-02days on market $274,900 Active 25 DOM
-
2026-06-01days on market $274,900 Active 24 DOM
-
2026-05-31days on market $274,900 Active 23 DOM
-
2026-05-08$274,900 Active 1868-char remark
-
2010-04-27soldstatus $57,500
-
2010-04-27soldstatus $57,500
ⓘ Source: listings_history table (triggers on properties + properties_extension) + one-shot
backfill from property_details.listing_events for pre-trigger history.
Tax reassessment forecast NY · Partial reset (capped growth)
- Current annual tax
- $621 · $52/mo
- Projected year-2 tax
- $2,591 · $216/mo
- Expected delta
- +$1,970/yr (+$164/mo · 317.4%)
ⓘ Screening estimate from a state-policy table — verify with the county assessor before closing.
Climate risk First Street
- Flood 7/10 Severe FEMA zone AE · 95% chance over 30 yrs
- Wildfire 1/10 Low
- Heat 3/10 Moderate 7 d/yr ≥91°F today · 15 d/yr by 30 yrs out
- Wind 1/10 Low
- Air quality 4/10 Moderate 4 unhealthy d/yr today · 9 by 30 yrs out
Nearby sold comps map
Loading sold comps map…
Walkable amenities ~0.75 mi
Loading nearby amenities…
Taxation est. · year 1
- Rental income
- $57,084
- − Mortgage interest
- −$15,119
- − Property taxes
- −$621
- − Insurance
- −$6,468
- − Repairs & maintenance
- −$4,567
- − Management
- −$4,567
- − Depreciation
- −$7,852
- Taxable income
- $17,891
- Est. tax owed @ 24.0%
- −$4,294
- After-tax cash flow
- $16,729/yr
For passive investors: Depreciation is non-cash, so a rental often shows a tax loss while cash-flowing — sheltering income. Rental losses are passive: they offset passive income freely, and up to $25,000/yr can offset ordinary (W-2) income if you actively participate and your MAGI is under $100k (phasing out to $0 by $150k); unused losses carry forward. On sale, claimed depreciation is recaptured at up to 25%, and gains may owe capital-gains tax (a 1031 exchange can defer both). Figures are a year-1 estimate at your 24.0% rate — not tax advice; consult a CPA.
Schools (NCES district)
- District
- Buffalo City School District
- NCES district ID
- 3605850
- Math proficiency
- 41% ▲ 11.00%
- Reading proficiency
- 40% ▲ 7.00%
- Median HH income
- $31,665
- Composite
- 33.17/100
- National rank
- #5544
- State rank
- #535 of 590 in NY
Livability — Buffalo
- Score
- 77/100
- State rank
- #195
- US rank
- #3011
Category grades
Schools grade is shown separately in the Schools card above.
Census & demographics
- Census place
- Buffalo, NY
- County
- Erie County · 714,559 people
- City population
- 440,021
- Metro
- Buffalo-Cheektowaga, NY
- Population (ZIP)
- 7,932
- Household income
- $28,182
- Rent vs Own
- Severe rent burden
- 945.0
Population outlook (Erie County) Hauer SSP2
- Today (2025)
- 933,037 people
- By 2030
- 935,181 · +0.2%
- By 2040
- 928,531 · -0.5%
- By 2050
- 905,725 · -2.9%
- By 2075
- 834,037 · -10.6%
- By 2100
- 708,033 · -24.1%
Race, ethnicity, and origin ACS 2023
- Neighborhood character
- Diverse neighborhood (Simpson 0.60)
- Race & ethnicity
- Black 58% White 19% Hispanic / Latino 18% Two or more races 4%
- Hispanic origin (detail)
- Puerto Rican 14% Dominican 1%
- Common ancestry
- Romanian 2% Subsaharan African 1%
- Foreign-born
- 6% · Canada
- Languages at home
- 81% English-only · Spanish 14% French/Haitian/Cajun 2% Russian/Polish/Slavic 1%
Political lean MEDSL · Erie
- 2024 margin
- Lean D (+9.7) · D 54.8% · R 45.2%
- 2008→2024 swing
- -7.9pp toward R · 2008: 17.5pp · 2024: 9.7pp
- All cycles
- 2024: D+9.7 2020: D+14.7 2016: D+4.8 2012: D+15.6 2008: D+17.5
Not yet ingested
- Civics
- —
Market trends
- HPI YoY
- ▼ -3.36%
- Current HPI
- 312.6232
- Rent YoY
- ▲ 5.48%
- Metro
- Buffalo-Cheektowaga, NY
- State GDP YoY
- ▲ 2.60%
- F500 in state
- 92
Industry mix (Fortune 500 HQ in NY)
| Industry | F500 HQs | Revenue |
|---|---|---|
| Financial Services | 10 | $950B |
|
||
| Consumer Goods | 9 | $162B |
|
||
| Insurance | 4 | $225B |
|
||
| Telecommunications | 2 | $144B |
|
||
| Pharmaceuticals | 2 | $112B |
|
||
| Media / Entertainment | 2 | $69B |
|
||
Price history
+369.4% since first listed4 events — show timeline
- 2026-06-15 Price Changed $269,900 WNYREIS
- 2026-05-08 Listed $274,900 WNYREIS
- 2010-04-27 Sold (Public Records) $57,500 Public Records
- 2010-04-27 Sold (Public Records) $57,500 Public Records
Property tax history
+10.8%/yrLatest (2025): $621 · +135.7% YoY. Source: county tax records.
Cash-flow waterfall
monthlySold comps — $/sqft
last 12 mo · ≤1 miLoading sold comps…